MULTIPLE HUMAN TRACKING IN COMPLEX SITUATION
BY DATA ASSIMILATION WITH PEDESTRIAN BEHAVIOR MODEL
W. Nakanishi a, *, T. Fuse a
a Dept. of Civil Engineering, University of Tokyo, 7-3-1 Hongo, Bunkyo, Tokyo 113-8656 Japan - (nakanishi@trip, fuse@civil).t.u-tokyo.ac.jp
KEY WORDS: Observations, Simulation, Integration, Image, Sequences, Tracking, System, Modelling
ABSTRACT:
A new method of multiple human tracking is proposed. The key concept is that to assume a tracking process as a data assimilation process. Despite the importance of understanding pedestrian behavior in public space with regard to achieving more sophisticated space design and flow control, automatic human tracking in complex situation is still challenging when people move close to each other or are occluded by others. For this difficulty, we stochastically combine existing tracking method by image processing with simulation models of walking behavior. We describe a system in a form of general state space model and define the components of the model according to the review on related works. Then we apply the proposed method to the data acquired at the ticket gate of the railway station. We show the high performance of the method, as well as compare the result with other model to present the advantage of integrating the behavior model to the tracking method. We also show the method’s ability to acquire passenger flow information such as ticket gate choice and OD data automatically from the tracking result.
1. INTRODUCTION
Recently in-depth understanding of pedestrian behavior in public space is becoming significant with regard to achieving more sophisticated space design and flow control. The difficulty in space design in big stations, for example, is that we should consider the congested level inside a station entirely, which changes every second, and passengers’ microscopic route choices at the same time. Therefore, understanding passenger flow in detail is necessary to accomplish good facilities planning. The same is true in shopping malls and pedestrian crossings. In order to understand such human behavior, the main problem is to comprehend individual's behavior in complex situation that people move interdependently.
Observation data from diverse sensors, which are informative to understand human behavior, are accumulated these days thanks to the development of sensing technology. As such data increase, a strong need arises to acquire behavior information automatically. However, automatic human tracking is still challenging under the situations that people move close to each other or are occluded by others. Human tracking is usually run by color information obtained from video camera, for we can get information of the entire field observed. As color information is not robust to occlusions, range information obtained from laser scanner or stereo video camera is also used for human tracking recently (e.g. Munoz-Salinas, 2008).
Meanwhile some simulation models of walking behavior have made progress recently (Bierlaire and Robin, 2009). In such models, pedestrian's choice of next step is explained by not only each individual's current position and velocity but also the interdependency as the response to the presence of other pedestrians. In order to develop simulation models, real data of pedestrian behavior is necessary for calibration of parameters and evaluation of reproducibility. In addition, the possibility to improve behavior models by feeding the tracking result back to them becomes greater if automatic tracking is achieved.
In this paper, we propose a new method of multiple human tracking under the complex situations. The key concept is that to assume a tracking process as a data assimilation process, widely used in many fields of geosciences (e.g. Daley (1991) and Wunsch (1996)). As human behavior is uncertain and human is non-rigid object, stochastic and non-linear tracking process is suitable. Also as huge volumes of data are processed for tracking, sequential process is suitable. An on-line data assimilation system matches this two needs. It consists of observations, forecasting and filtering. In human tracking, observations correspond to observation data from sensors, forecasting to pedestrian behavior model and filtering to existing tracking method by image processing.
The rest of the paper is organized as follows. In section 2, we describe how we apply data assimilation to human tracking. In section 3, we present the calculation method of this assimilation. In section 4, we define some components of the model according to the review on related works, both human tracking method by image processing and simulation model of pedestrian behavior. Finally, we apply the proposed method to real data in section 5 and conclude the paper in section 6.
2. DATA ASSIMILATION
2.1 Human Tracking as Data Assimilation
We assume a human tracking process as an on-line data assimilation process as mentioned above. It consists of observations, forecasting and filtering step. In data assimilation, after the current state is predicted by forecasting step, observations of the current and past state are combined with them by filtering step. In human tracking, the process is repeated like this: In each frame, positions and shapes of people being tracked are estimated by pedestrian behavior model (forecasting step). Then estimated shapes and positions are optimized referring to the new observation data (filtering step). Each step in this paper in detail is described below.
2.2 Observations
Observations are information that we can obtain from various sensors. In human tracking under complex situations, people may be occluded by others or close to each other even if there are no occlusions. We may be able to identify and track multiple people that are close to each other by color information, using color difference of clothes, for example. However, color information is not suitable for identification of people under occlusions. On the other hand, range information is robust to occlusion thanks to difference of distance to some people closer and farther. Nevertheless, range information cannot distinguish two people in proximity because the difference in distance is slight. In addition, it does not bring information about identification of each person because the observed shape is not so different from person to person. In consideration of such conditions, we use both color and range information, which can redeem their demerit each other. We use stereo video camera to acquire them simultaneously.
2.3 Forecasting
Forecasting step is a step to predict a current state of a system from the last state by numerical model. In human tracking, it is corresponding to the pedestrian behavior model. It predicts pedestrian's current position based on the last position and conditions around them. Among many models such as social force model and cellular automaton, we use discrete choice model in this paper. This is because discrete choice model decides the next step of each pedestrian stochastically and can deal with interactions between pedestrians. Besides, the alternatives of next step are individual for each pedestrian for each time. Thus, we consider this forecasting process as non-linear process, contrary to many literatures on human tracking, simply assuming random walk or linear process (e.g. Ali and Dailey (2009)).
2.4 Filtering
Filtering step is a step to balance the predicted current state by forecasting step and current observations. In human tracking, it is corresponding to the problem to evaluate the likelihood of the predicted state as person. Because background is not stable in complex situations, we evaluate the similarity of foreground area, the position and shape of human. Both color and range information is used for this filtering.
3. GENERAL STATE SPACE MODEL
3.1 General State Space Model
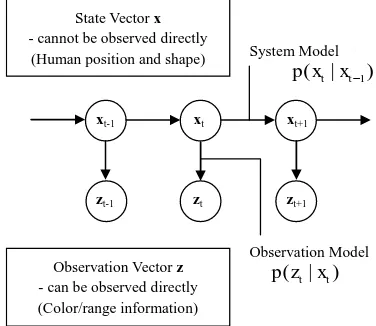
This data assimilation system can be described in a form of general state space model (Higuchi, 2003). General state space model is widely used in many fields recently, for it can deal observation model p(zt|xt), a probability distribution of zt on the
condition of xt, and system model p(xt|xt-1), a probability distribution of xt on the condition of xt-1. After we obtain z1:t =
{z1, z2,..., zt}, series of observations from time 1 to t, xt is
obtained by maximum a posteriori probability (MAP) estimate.
According to Bayes' theorem, the posterior distribution of xt is processed like this: First, prior probability of xt is calculated by
applying system model to the probability distribution of xt-1. Then obtained prior probability of xt is combined with
observation zt, and posteriori probability of xt is calculated. In
this framework, we need to define state vector xt and
observation vector zt, and model system model p(xt|xt-1) and observation model p(zt|xt). We explain about their definition in
section 4.
3.2 Particle Filter
To estimate a state vector, we need to calculate probability distributions in the equation (1) successively. We use particle filter for this calculation. Particle filter is a method to approximate the conditional distribution discretely by number of particles sampled from that distribution (Gordon et al., 1993). Calculation of the particle filter is processing as follows and in figure 2:
1. Approximating the conditional distribution p(xt-1|z1:t-1) by number of particles independently sampled with weight (observation model).
2. Resampling particles with equal weight according to the weight of each particle sampled at step 1.
3. Moving each particle obtained at step 2 according to the system model p(xt|xt-1).
4. Weighting particles according to the observation model p(zt|xt).
5. Estimating xt as the expected value of weighted particles
obtained at step 4. State Vector x - cannot be observed directly
(Human position and shape) System Model
p x x
(
t|
t1)
Figure 1. General state space model
Figure 3. State vector
In this section, we define and model the components of general state space model.
4.1 State Vector
State vector is corresponding to the position and shape of each person. We define a state vector as an ellipsoid and its coordinates, which is human shape and position, shown in figure 3. State vector is described as follows:
x = (x, y, z, w, h, d) (2)
where (x, y, z) = central coordinates of ellipsoid (w, h, d) = length of each axis
4.2 Observation Vector
We also define an observation vector as observations from sensor. Stereo video camera is used in this work so we acquire both color and range information. Observation vector at pixel (i, j) is as follows:
zij = (Xij, Yij, Zij, rij, gij, bij) (3)
where (X, Y, Z) = coordinates of observation point corresponds to pixel (i, j)
(r, g, b) = pixel value of red, green and blue at pixel (i, j)
4.3 System Model
System model explains sequential change of state vector. We define system model using simulation model of pedestrian behavior. We apply the model by Robin et al. (2009) because the parameters are evaluated on real data. This model describes features of pedestrian behavior, such as keeping direction, going toward destination, accelerating if current velocity is slow and vice versa, following the person in front of them and avoiding collision. Choice set is fan-shaped shown in figure 4. Alternatives of choice set are 33 in total, three for velocity (acceleration, constant speed and deceleration) and 11 for angle. The utility function is described as follows:
vmax = maximum speed of pedestrian (constant)
vmaxLS = if pedestrian's current speed is below vmaxLS,
utility to accelerate increases (constant) I = dummy for each alternatives
dir = angle between current direction and direction to alternatives
ddir = angle between directions to destination and alternatives from current position
ddist = distance from alternatives to destinations D, Δv, Δθ = distance between pedestrians, difference in speed of pedestrians and difference in angle between current direction of pedestrians, respectively
Using this choice model, we define system model as follows:
xt = xt-1 + vt-1 + wt-1 (5) Where vt-1 is the vector determined according to the choice from discrete choice model at time t-1, that is, the alternative with maximum utility. w is noise term with its expected value 0 and variance σ2
.
Figure 4. Choice set from Robin et al. (2009) 10°
1. Discrete approximation by weighted particles
2. Resampling
3. Moving particles by system modelp
(
x
t|
x
t1)
4. Weighting particles by observation modelp
(
z
t|
x
t)
5. Estimating xt as expected value of this particles
Figure 2. Calculation flow of particle filter Conditional distribution
Then we have to handle two problems remained. Firstly, although system model deals with three-dimensional ellipsoid, pedestrian behavior model deals with behavior on two-dimension plane. Therefore we assume that ellipsoid is upright on the floor and set the coordinates parallel to the floor (ground coordinates). At the same time, we calculate the angle between camera coordinates and the ground coordinates. Secondly, behavior model assumes that destinations of every pedestrian are known in advance. However, in case of on-line tracking, we cannot know their destination in advance. Therefore, we omit the term about destination in this model, the term (b) in equation (4). After this step, all we have to do is to set initial position, shape and velocity for all people to be tracked.
4.4 Observation Model
distribution according to the similarity between color histograms of pixels in the ellipsoid at time t-1 and t. We use Bhattacharyya coefficient B as follows, a coefficient correlation of color histogram as used in existing works (e.g. Wu and Nevatia (2007) and Ali and Dailey (2009)).
, 1,
dt, m = relative frequency of pixel value m in histogram d
We calculate this for each color r, g and b, and define pcolor(zt|xt) as a product of them.
4.4.2 Range Observation Model: prange(zt|xt) is a
probability distribution according to the similarity between shape of predicted ellipsoid and observed object in actuality. For pixel P included in the ellipse made by projection of predicted ellipsoid to the obtained image, let d P
( )
the distance from observed coordinates P(X, Y, Z) to the center of ellipsoid5.1 Observation Conditions and Parameter Settings
We apply the proposed method to the data acquired at the ticket gate of Tama-Plaza station, the railway station in the popular residential area about 20km west from central Tokyo. We took
the data in the morning, the commuter rush hour and confirmed that people behavior was under the complex situations. The stereo video camera used in this observation is consisted of two cameras (SONY-DFW, 1.2 million pixels), set about one meter spaced, calibrated in advance. Frame rate is set at 7.5 [frames/sec] from the constraints of the stereo synchronization process. In this condition, the video was taken from a point about 10m height, looking down obliquely (figure 5).
In the proposed method, we need to set some initial values and parameters in advance. We set the number of particles as N=500. For the state vector, we get the initial position of people manually and set as the position (x, y, z). The size of the ellipsoid is set to w=0.4[m], h=1.6[m] and d=0.3[m] considering the size of people. We also set the initial velocity of each person manually. For the variance of system model, we set σ = (10, 5, 10, 0.05, 0.05, 0.05) [cm] after some trials. Finally we calculate the angle between camera and ground coordinate as ω=0.62[rad].
5.2 Results and Discussions
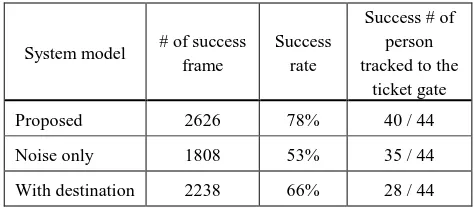
We apply this method for 30 seconds (226 frames). During this period 51 people with 3,384 frames in total are to be tracked. We make a performance verification of the proposed method by comparison of the position of the person obtained from tracking result with manually read from the image. As a result, we succeeded in 2,626 frames (78%) in total and 40 people of 44 are correctly tracked to the ticket gate (table 6).
Table 6. Tracking result with comparison by system model
System model # of success associated with points on the image is a unique number given to each ellipsoid, which is corresponding to the tracked person.
Figure 5. Example of obtained image
Platform #2 Platform #1
South Exit North Exit
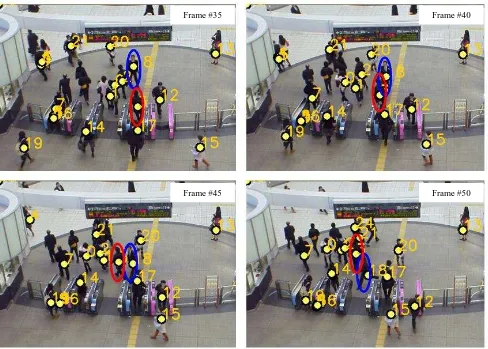
We confirm that under the situation without occlusion and proximity between people or people and object, tracking succeeded in almost all frames. In addition, in situations involving a speed change, occlusion, proximity, avoidance behavior and direction change at around the gate, success rate stays at a high level. For example, two people shown as an oval of red and blue on figure 7 are successfully tracked under the condition that they are changing the direction and avoiding the collision near the ticket gate.
Although the effectiveness of the proposed method has been shown from the results above, some points to be improved remain for more accurate tracking. For example, by introducing the interaction between person and object to system model, the accuracy when people pass through the ticket gate may improve. In addition, considering the interaction with the person beside and behind or minimum distance between people in system model would bring a more robust tracking.
5.3 Comparison with Other System Model
To verify the effectiveness of the proposed model, we use other system models and compare tracking results. Two cases are experimented: (a) system model with noise term only (vt-1=0 in equation (5)) and (b) system model with destination term (use term (b) in equation (4) and destinations are set manually). In case of (a), success rate dropped to 53% and the number of people tracked to the ticket gate to 35. This shows that integration of pedestrian behavior model with tracking method is meaningful. In the same way, in case of (b), the result is 66%
and 28 people. Failure cases are mainly caused by direction change at the ticket gate, for the direction choice around there is not necessarily the same as the final destination (table 6).
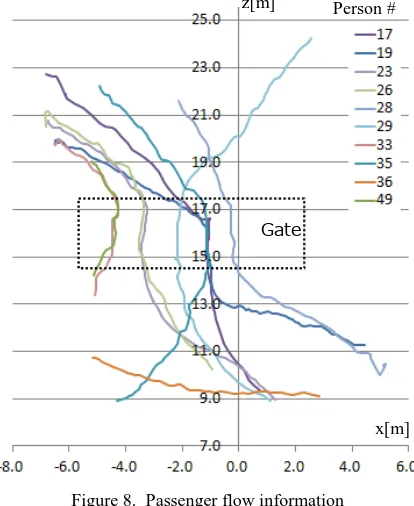
5.4 Acquisition of Passenger Flow
We can get passenger flow information by projecting the tracking result to the ground floor. Figure 8 shows a part of the acquired passenger flow. From this flow information, we try to get passenger’s ticket gate choice automatically. This data are more useful than simple cross-sectional data because each passenger’s origin is related to the choice of the ticket gate. The result is shown in table 9. Compared with the data acquired manually, 37 of 42 people’s choices are successfully obtained. Another example shown in table 10 is OD data. 26 of 39 person's OD data are correctly acquired. From this result we can grasp the general tendency like the flow between south exit and platform 2 is at a high level. In this way, the proposed method increases the possibility to acquire detail flow data of the individuals. It is expected that comprehension of people’s behavior using this flow data leads to more sophisticated and precise flow control and facility design.
5.5 Integration with Detection Method
We try to expand the method to achieve the long time tracking, integrating a detection method of people entering the image, instead of setting it manually. After person is detected at time t, we assume a probability distribution p(xt) and forecast the state
xt+1 by system model with noise term only. Then we filter xt+1 Figure 7. Results
Frame #45 Frame #50
Frame #35 Frame #40
Table 9. Ticket gate choice with origin information
A B C D E Total
North exit 12/12 1/3 0/0 0/0 N/A 13/15 South exit 0/0 5/5 3/4 4/4 N/A 12/13 Platform 1 N/A 0/0 0/0 0/0 0/0 0/0 Platform 2 N/A 0/0 0/1 7/7 5/6 12/14 Total 12/12 6/8 3/5 11/11 5/6 37/42 Result of automatic / manual acquisition. N/A means one-way gate. Row is origin, column is chosen gate. Gates are named from A to E, respectively from left to right on figure 5.
Table 10. OD matrix
North South #1 #2 Total
North exit ― 0/0 1/2 3/11 4/13
South exit 1/1 ― 1/1 11/11 13/13
Platform 1 0/0 0/0 ― 0/0 0/0
Platform 2 3/3 6/10 0/0 ― 9/13
Total 4/4 6/10 2/3 14/22 26/39
Result of automatic / manual acquisition. Row is origin, column is destination.
by observation model p(zt+1|xt+1), the same as tracking. This simple integration brings good result in plain situation like without occlusion and proximity. We need additional step to deal with complicated situation.
6. CONCLUSION
We propose a new method to track multiple human in complex situations. We assume human tracking as data assimilation and combine observed information of color and range with pedestrian behavior model in general state space model. From some applications, we show the high performance of proposed method. We also show the acquisition of passenger flow
information using tracking result. It is expected that enormous human choices in the real situation will be offered, for automatic tracking can deal with much amount of data.
Proposed method can be easily applied to other situations. According to observation sites and human behavior there, we can use different pedestrian behavior model by replacing system model. In the same way, we can introduce different sensors such as range scanner and infrared sensor by replacing observation vector and observation model.
Further works are as follows. Firstly, we need to make better the components of general state space model defined in section 3 for more accurate tracking. Secondly, automatic human detection is necessary to achieve the long time tracking. For this problem, simple framework is already completed as explained in 5.5, so their expansion is the next work. Furthermore, we aim to develop a method to analyze pedestrian behavior using tracking results.
References:
Ali, I. and Dailey, M. 2009. Multiple human tracking in high-density crowds, Advanced Concepts for Intelligent Vision Systems, Vol. LNCS 5807, pp.540-549.
Bierlaire, M. and Robin, T. 2009. Pedestrian choices, In H. Timmermans (Ed.): Pedestrian Behavior: Models, Data Collection and Applications, pp.1-26, Emerald Group, 2009. Daley, R. 1991. Atmospheric Data Analysis, Cambridge University Press, Cambridge.
Gordon, N. J., Salmond, D. J. and Smith, A. F. M. 1993. Novel approach to nonlinear / non-Gaussian Bayesian state estimation, Radar and Signal Processing, IEE Proceedings F, Vol. 140, No.2, pp.107-113.
Higuchi, T. 2003. Data assimilation with Monte Carlo mixture Kalman filter toward space weather forecasting, Proceedings of International Symposium on Information Science and Electrical Engineering 2003, pp.122-125.
Munoz-Salinas, R. 2008. A Bayesian plan-view map based approach for multiple-person detection and tracking, Pattern Recognition, Vol.41, No.12, pp.3665-3676.
Robin, T., Antonini, G., Bierlaire, M. and Cruz, J., 2009. Specification, estimation and validation of a pedestrian walking behavior model, Transportation Research Part B: Methodological, Vol.43, No.1, pp.36-56.
Wu, B. and Nevatia, R. 2007. Detection and tracking of multiple, partially occluded humans by bayesian combination of edgelet based part detectors, International Journal of Computer Vision, Vol.75, No.2, pp.247-266.
Wunsch, C. 1996. The Ocean Circulation Inverse Problem, Cambridge University Press, Cambridge.
ACKNOWLEDGEMENTS:
This research was supported by Japan Society for the Promotion of Science, Grant-in-Aid for Young Scientists B (22760401). Figure 8. Passenger flow information
z[m]
x[m] Gate
Person #