A COLOR BALANCING METHOD FOR WIDE RANGE REMOTE SENSING IMAGERY
BASED ON REGIONALIZATION
Jia LIU, HaiTao LI, HaiYan GU
Key Laboratory of Geo-informatics of National Administration of Surveying, Mapping and Geoinformation, Chinese Academy of Surveying and Mapping, Beijing 100830, China
Tel: +86 010 63880688, E-mail: [email protected]
KEY WORDS: Color balance, Regionalization, Wide range, Image mosaic.
ABSTRACT:
Quick mosaicking of wide range remote sensing imagery is an important foundation for land resource survey and dynamic monitoring of environment and nature disasters. It is also technically important for basis imagery of geographic information acquiring and geographic information product updating. This paper mainly focuses on one key technique of mosaicking, color balancing for wide range Remote Sensing imagery. Due to huge amount of data, large covering rage, great variety of climate and geographical condition, color balancing for wide range remote sensing imagery is a difficult problem. In this paper we use Eco-geographic regionalization to divide the large area into several regions based on terrains and climatic data, construct the algorithmic framework of a color balancing method according to the regionalization result, which conduct from region edge to center to fit wide range imagery mosaicking. The experimental results with wide range HJ-1 dataset show that our method can significantly improve the wide range of remote sensing imagery color balancing effects: making images well-proportioned mosaicking and better in keeping images' original information. In summary, this color balancing method based on regionalization could be a good solution for nationwide remote sensing image color balancing and mosaicking.
1. INTRODUCTION
Wide range mosaic map indicating the distribution of natural resources and geographical landscape which can provide a good foundation on large-scale dynamic monitoring of environmental pollution, natural disasters and land resource surveys, also mosaic map can be used as the basis image of geographic information for convenient geographic information products updating[1,2] in the information industry. The color balancing technology in imagery mosaicking is an effective guarantee of image quality and color consistency. Due to huge amount of data, large covering rage, great variety of climate and geographical condition, color balancing for wide range remote sensing imagery is a difficult problem. So that an effective and applicable color balancing method for wide range remote sensing imagery is imminently needed.
Supposing there are few images covered in south of china. They may be well matched using traditional color balancing method. But if images have a greater color difference, such as images covered in great difference topography, we cannot blindly use the same method to balance their colors. Otherwise it will alter the true features. And if we adopt the traditional method of color balancing for wide range images, the area and the volume of calculation might be exponential growth, which will unexpected change the image gray value, and cause repeated calculations.
The research designs a color balancing method for wide range remote sensing imagery using improved gain compensation algorithm, based on regionalization, matching images from region edge to center. And this paper presents the whole process of the method, including how to acquire regionalization and how to match images from region edge to center. And there is also a test using HJ-1 data to do color balancing and mosaic to compare our method and traditional method, which shows that the method proposed in the paper will make images mosaicking well-proportioned, ensures that images of large-areas keeps original color, improve efficiency by reducing repeated calculation. We believe that this method will benefit the further study of wide range remote sensing imagery mosaic.
2. NATIONWIDE ECO-GEOGRAPHIC REGIONALIZATION
2.1. Eco-geographic Regionalization
Regionalization is a process that based on the classification and analysis of geographic auxiliary information which normally divides the large area into many small regions. Typically, regionalization is obtained from: 1) superposition analysis of the thematic vector image partition map and remote sensing images, which shows the relationship between distribution of thematic and topography & geomorphology; 2) carrying out a regional scoping and evaluation of a topic use spatial analysis capabilities of GIS platform to do data acquisition, storage, management, analysis and built database. For example, researcher from Natural Zoning Working Committee of Chinese Academy of Sciences use accumulated temperature to divide temperature zone. Also, China Land Resources Regionalization obtained from bottom-up clustering process of the country unit completed by Geographic sciences and Natural Resources Research, CAS.
Eco-geographic regionalization is based on analysis of geographical features, climate, vegetation phenology feature of different areas, also considering the application suitability, the overall workload in order to get a divided definite geographical unit area. These divided units keep the homogeneity of surface types, soil, vegetation, and spectral radiance values. Eco-geographic regionalization can improve land cover classification accuracy, benefit mosaicking of vector or classified raster data, strengthen the management of remote sensing data, and also can be the basis data sets for ecological remote sensing monitoring to guide our future work of remote sensing information extraction.
In this paper, we use nationwide Eco-geographic regionalization to help to achieve the color balancing for wide range remote sensing imagery.
2.1.1. Scale of Regionalization
Eco-geographic regionalization is normally carried out by national scale, regional scale, or local scale:
National scale is mainly used for low-resolution data, such as remote sensing images with the resolution of 1km or 250m, the data sources are NOAA/AVHRR, SPOT / VGT, MODIS, etc. This scale of regionalization is generally carried out by considering national meteorological elements and terrain information.
Regional scale is mainly used for high-resolution data, such as 30m, 25m, 20m and other resolution remote sensing images, the data sources are LANDSAT TM/ETM+, SPOT5, CERS and 30m resolution multi-spectral images of environment or disaster mitigation satellites. This scale of regionalization generally carried out according to vegetation, landform, soil and other information.
Local scale is mainly used for even higher resolution data, such as 10m, 2.5m resolution remote sensing images. The main data sources are SPOT5.
In this paper, the original intention is to help to do color balancing for Nationwide Remote Sensing imagery, to accomplish quick mosaicking of wide range remote sensing imagery. The data resource of our test is HJ-1 with a resolution of 30m, and the color balancing algorithm is improved gain compensation which will get better result for larger amount of data. Thus, the national scale Eco-geographic Regionalization will be more suitable for our requirement.
2.1.2. Regionalization Principles
The definition of Eco-geographical regionalization involves a large number of standards. Regionalization in this paper is based on the following three principles.
(1) Ensure the consistency of landscape features. The elevation, weather, soil type, hydrological conditions and other ecological characteristics of change should be fully considered. These factors will not only affect the distribution of the natural landscape, but also the color rule of remote sensing images. If all the elements of each partition unit are excellent consistent, color of its images will be excellent proportioned.
(2) Ensure the appropriateness of the scale. To ensure that after partition, the every sub-region can be covered within a certain number of images, the regionalization need to be national scale, to ensure the integrity of the partition without crushing area.
(3) Consider DEM data and air temperature, humidity and other weather information as a leading factor.
2.1.3. Methods of Regionalization
In this paper, overlay method, leading mark method, geographic correlation analysis method and combined analysis method are applied in combination with each other.
Overlay method: Distribution maps with natural elements and regionalization map are stacked together, and then the most overlapping lines as the basis for division will be selected. Overlay method can reduce the subjectivity and arbitrariness, and helps to find relation between different natural phenomena.
Leading mark method: According to comprehensive analysis, the leading mark will be chosen to determine the boundaries or part of the boundaries.
Geographical correlation analysis method: Firstly compare distribution maps with natural elements and regionalization map, then the discipline of nature regional differentiation and interdependent relationship will be analysed, based on which the boundaries will be determined
Combined analysis: In order to classify and summarize the natural geographic areas or phenomena, tiny land category will be removed. Gradually, the same land cover types or geomorphological units are merged together, and eco-geographic regionalization is formed.
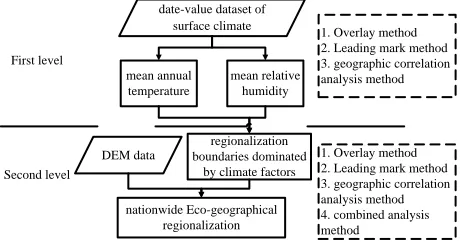
2.2. Nationwide Eco-geographic Regionalization
In this paper, meteorological data and DEM data are used for division with the major workflows as follows:
Second level
Figure 1. Process of nationwide Eco-geographic regionalization mean annual temperature and mean relative humidity, shown in Figure 2, and introduce them into ArcMap to conduct the following reprocess:
Figure 2. 2009 China's date-value dataset of surface climate from weather station
(1) Compute the difference of weather station information using Kriging interpolation, to form the 2009 distribution map of mean annual temperature and mean relative humidity, as shown in Figure3.
Figure 3. 2009 distribution map of mean annual temperature and mean relative humidity (a) mean annual
temperature; (b) mean relative humidity.
(a) (b)
(2) Classify and vectorize the results of kriging interpolation. Then the basic regional distribution of national climate is received, as shown in figure4.
Figure 4. Classification and vectorization of mean annual temperature and mean relative humidity (a) mean
annual temperature; (b) mean relative humidity.
(3) The results of step (2) are stacked together to extract the regionalization boundaries dominated by climate factors, as shown in Figure 5.
Figure 5. Extract the regionalization boundaries dominated by climate factors
Secondly, pre-processing of the national SRTM250m DEM data is done by segmentation, vectorization method (Figure 6). Pre-processing will produce small regions with certain similar characteristics.
Figure 6. Classification, segmentation, vectorization of national SRTM250m DEM data
2.2.3. Merge Polygons
Finally, through the overlay analysis of regionalization boundaries dominated by climate and DEM data, we merge the small polygons, finally formed a nationwide Eco-geographical regionalization, shown in Figure 7.
Figure 7. Forming a nationwide Eco-geographical regionalization using overlay analysis
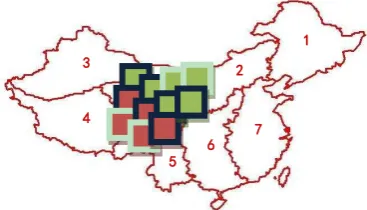
2.2.4. Result Evaluate
The nationwide Eco-geographical regionalization divided the country into seven large regions. Each region has similar climate and terrain feature. It can be seen from Figure8 that the characteristics of each region are basically the same while the results, national main temperature, main relative humidity, and the National DEM image superimposed on each other. That regionalization result will lay a good foundation for the implementation of the color balancing for wide range remote sensing imagery.
Figure 8. Eco-geographical regionalization result evaluation (a) combine with main relative
humidity;(b)combine with national main temperature;(c)combine with DEM
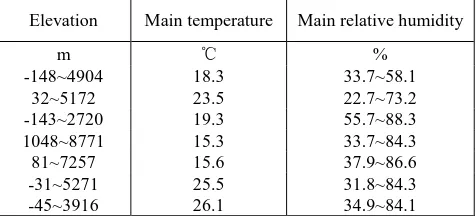
Statistical analysis was performed on the Eco-geographical regionalization (Table 1). The climatic and terrain conditions of each region are basically the same.
Elevation Main temperature Main relative humidity
m ℃ %
-148~4904 18.3 33.7~58.1
32~5172 23.5 22.7~73.2
-143~2720 19.3 55.7~88.3
1048~8771 15.3 33.7~84.3
81~7257 15.6 37.9~86.6
-31~5271 25.5 31.8~84.3
-45~3916 26.1 34.9~84.1
Table 1. Eco-geographical regionalization result evaluation (a)
(c)
(b)
(a) (b)
3. COLOR BALANCING METHOD BASED ON REGIONALIZATION
This chapter will discuss the color balancing method based on regionalization. There are three items should be introduced: the first one is the improved gain compensation algorithm, the second one is color balancing method from region edge to center based on regionalization, the last one is the wide range remote sensing imagery color balancing test with HJ-1 data.
3.1. Improved Gain Compensation Algorithm
Gain compensation is based on the error function e which is the sum of normalized intensity error gains for all overlapping pixels. This algorithm calculates gain values of images and correct grey values so that the color of images becomes similar.
Algorithm finds each image’s gain value to ensure the error
tends to a minimum value. The problem can be transformed into an n-dimensional extremum problem on unconstrained conditions which can be solved by simplex optimization method. Gain compensation method is mainly used in
panoramic photo stitching, and hasn’t been widely used in remote sensing images. Figure1 shows the algorithm workflow:
Image 1
Figure 9. Gain compensation process.
The error function e is defined as
algorithm robustness. Practically, for 255 gray-scale images, it is often took σN = 10, σg = 0.1. The equation will be solved by using the simplex optimization method. It calculates gi, gj and applied to the original image i and j, and finally get color-balanced images.
The improved gain compensation algorithm has two key points: 1) The cloud detection based on threshold method will be used to determine the gray value to ensure the influencing pixels will be excluded from the regional mean statistics. 2) A gain compensation algorithm based on reference image will be implemented, carrying out by utilizing the plural modality algorithm to solve an n-dimensional extremum problem on constrained conditions. The gain values of the reference image is set to be the constrained conditions and the solving process is to find other image’s gain value to ensure a minimum error e.
3.2. Edge-center Color Balancing Method
According to Chapter 2, image of the whole country is divided into seven regions. The schematic diagram of the Edge-center Color Balancing Method is shown as figure 10 with the following five steps.
Figure 10. The Edge-center color balancing method
(1) Select images according to their geometric position to distinguish internal images from marginal images. In figure 10, the red rectangles are region2 images; the green ones are region5 images. And the marginal images are shown by the rectangles of blue outline; internal images are shown by the rectangles of yellow outline.
(2) Balance the marginal images using improved gain compensation algorithm and record the gain values. Their gain values will be constant.
(3) Compute internal images’ gain values using improved gain compensation algorithm according to the reference images. The reference images are the marginal images in the same regions.
(4) Correct all the images’ grey values.
(5) Process two regions’ images with feather mosaics.
We believe that the marginal images have larger span in the geographic form, and reflect more extraordinary terrain and color differences. We first balance marginal images, and then the internal images of each region using the balancing results of marginal images so it ensures that wide range images will keep their original color, also saves processing time by reducing
Wide range mosaic Project
(WML)
Extract five reference point of
images
Read regionalization Vector data and extract
polygons
Select images
Improved Gain Compensation
correct Image grey values
1. Input image name 2. Input vector name 3. Output path 4. Mosaic type
Images mosaic Images and
regionalization
internal images
marginal images
Gain Value
Improved Gain Compensation
Gain Value
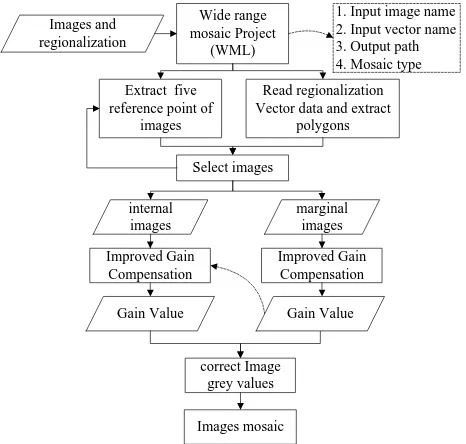
Figure 11. The algorithm flow of the color balancing method for wide range remote sensing imagery based on
regionalization
In the process, one key point is the improved gain compensation algorithm which has been elaborated in the section3.1, another key point is distinguishing internal images from marginal images. We simplify the distinguish method by determining the relative position of images five reference points to the regionalization vector according to the following four principles :
(1) If the midpoint of the image is in a certain region, the image is defined as the internal image of that region;
(2) If two out of four vertices of the image are in different regions, the image is defined as marginal image;
(3) If the midpoint of the image is not in any region, and there is a vertex in a certain region, the image is defined as internal image of this region;
(All images can be distinguished. One image may belong to different regions. It can avoid image missing on the external border.)
3.4. Experiment
This paper selects 31 images of HJ-1 satellite (Albert conical equal area, double standard parallels of 25 ° and 47 °, the central meridian 105 °) from the west of China for the experiment of our color balancing method for wide range remote sensing imagery based on regionalization. The images are covered somewhere of Xinjiang and Tibet. The experiment is respectively using the traditional color balancing methods and our Edge-center color balancing method based on regionalization. The experiment results of these two methods are shown in Figure 12.
Figure 12. The experimental result (a) Traditional method; (b) Edge-center method.
From the experimental results, we can find out that our color balancing method for wide range remote sensing imagery based on regionalization is feasible, and both methods have their own advantages:
(1) The result of traditional method: the effects of color balancing in different area are uniform, but it is prone to have color distortion and untrue in somewhere(shown in Figure 4-12
⁑, ⁒);
(2) The Edge-center Method: the effects of color balancing in different area are consistent, and there is no color distortion so that the result looks more realistic.
(3) Analysis: Comparing to the traditional method, our Edge-center method avoided excessive color deviation, and better in keeping the natural color of images. And if the feathered and smoothing are used, the effect of mosaic will be better. Weak point is that the marginal images(Figure 12 ⁓) color balancing effect is not as good as internal images (Figure 4-12 ⁔). The main reason is that there are little marginal image. We can
⁓
⁔ ⁑
⁒
(a)
(b)
(a)
(b)
improve the image selection principles to get more images involved into the color balancing of marginal images, the color balancing results will be better.
4. SUMMARY AND FUTURE WORK
The traditional method of color balancing normally start from small area to large area, which will inevitably make the gray value of the image changed again and again, resulting in repeated calculation. Our color balancing method for wide range remote sensing imagery based on regionalization solves the problem, and makes images well-proportioned mosaicking and better in keeping their true natural color. The experimental result shows that it is a new practical automatic color balancing method for wide range remote sensing imagery with significant advantage. However, there are still many technical should be studied and improved for this method.
In the future, a larger number of experiments should be done for further algorithms improvement. And we should explore some ways to improve the performance by speeding up the gray value statistics, image partition for parallel computing. The final goal is to implement a software program for rapidly mosaics of wide range remote sensing imagery.
ACKNOWLEDGEMENTS
This research was funded by non-profit industry project
“Research and application of surveying and mapping production technology (201412008)” and Key Laboratory of Geo-Informatics of National Administration of Surveying, Mapping and Geoinformation project (201402).
REFERENCES
[1] Hongwei Yang. “Study on the Image Fusion, Mosaic and Map Based on the Remote Sensed Image with High Spatial Resolution and Multi-sources”. Lanzhou University. 2010,5.
[2] Huiyun Ma. Liangming Liu, Junjie Yan, Lingkui Meng, “the Processing of China Color Mosaic Map Based on MODIS Data”. Surveying and Mapping of Sichuan 28(2), June 2005.
[3] Matthew Brown, David G. Lowe. “Automatic Panoramic Image Stitching using Invariant Features”. Department of Computer Science, University of British Columbia, Vancouver, Canada. [4] Hongcheng Jiang. "A Study and More Remote Sensing Images
Mosaicing System"(in chinese), Institute of Remote Sensing Applications, Chinese Academy of Sciences. 2004,6
[5] Robert Bindschadler, Patricaia Vornberger, Andrew Fleming, Adrian Fox, Jerry Mullins, Douglas Binnie, Sara Jean Paulsen, Brian Granneman, David Gorodetzky. The Landsat Image Mosaic of Antarctica. Remote Sensing of Environment 112, 2008.