A NEW TECHNIQUE BASED ON MINI-UAS FOR ESTIMATING WATER AND
BOTTOM RADIANCE CONTRIBUTIONS IN OPTICALLY SHALLOW WATERS
M.A. Montes-Hugo a*, C. Barrado b, E. Pastorb,
aInstitut de Sciences de la Mer de Rimouski, Université du Québec a Rimouski, 310 Alleé des Ursulines, Office P-216, G5L 3A1,
Rimouski, Québec, Canada- [email protected]
bUniversitat Politecnica de Catalunya, Avinguda del canal Olimpic, Castelldefels, Spain - [email protected],
KEY WORDS: UAS, ocean color, littoral waters, bottom reflectance, radiance, visible spectrum, Saint Lawrence Estuary
ABSTRACT:
The mapping of nearshore bathymetry based on spaceborne radiometers is commonly used for QC ocean colour products in littoral waters. However, the accuracy of these estimates is relatively poor with respect to those derived from Lidar systems due in part to the large uncertainties of bottom depth retrievals caused by changes on bottom reflectivity. Here, we present a method based on mini unmanned aerial vehicles (UAS) images for discriminating bottom-reflected and water radiance components by taking advantage of shadows created by different structures sitting on the bottom boundary. Aerial surveys were done with a drone Draganfly X4P during October 1 2013 in optically shallow waters of the Saint Lawrence Estuary, and during low tide. Colour images with a spatial resolution of 3 mm were obtained with an Olympus EPM-1 camera at 10 m height. Preliminary results showed an increase of the relative difference between bright and dark pixels (dP) toward the red wavelengths of the camera's receiver. This is suggesting that dP values can be potentially used as a quantitative proxy of bottom reflectivity after removing artefacts related to Fresnel reflection and bottom adjacency effects.
1. INTRODUCTION
The use of unmanned aerial vehicles (UAS) has several applications in environmental studies including the control of wildfires and the optimization of agriculture production (Ambrosia et al., 2003;Berni et al., 2009). Although promising, the utilisation of UAS for mapping bathymetry and turbidity of shallow nearshore environments is still lacking.
Unlike satellites, UAS is a remote sensing platform that can provide extremely high spatial resolution (i.e., cm). This is particularly important in coastal oceanography for investigating benthic communities, and processes related to sediment transport and small-scale turbulence.
Similar to airborne surveys, UAS flights can be scheduled depending on the weather conditions but at a lower cost. Lastly, the footprint of UAS-based optical passive systems is smaller with respect to those from satellite imagers. Thus, UAS-derived measurements are less affected by adjacency effects.
The inversion of bottom depth based on satellite ocean colour measurements is relatively inaccurate (error ~30%) with respect to those derived from active optical systems such as Lidars (Light detection and range) (Lee et al., 2002; Wang and Philpot, 2007). This is mainly related to the major uncertainty of passive optical retrievals of bottom depth associated to the spatial variability of bottom reflectivity.
In that regard, high resolution UAS measurements may be applied to independently discriminate optical signal associated with water and bottom components. Thus, optical data from drones can be used as a complementary tool for improving satellite estimates of bottom depth and water turbidity in
optically shallow waters (i.e., those with substantial radiance contributions due to water and bottom components).
In order to estimate bottom reflectivity, the aim of this study is to evaluate a new technique based on visible (i.e., wavelength = 400-700 nm) remote sensing measurements obtained by a mini-UAS and performed in contiguous areas with and without solar illumination.
This approach is based on the cloud-shadow algorithm developed for satellite observations and originally proposed for removing the atmospheric path contribution to the TOA (i.e., top-of-the-atmosphere) radiances (Reinersman et al., 1998). The suggested technique is expected to work as long as the bottom reflectivity of illuminated and non-illuminated pixels is comparable.
2. METHODS
2.1 Aerial optical system
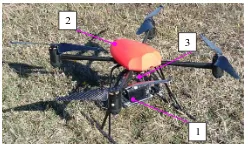
UAS images were obtained with an Olympus camera (12.3 mP, EPM-1) attached to a draganfly X4P quadcopter (Figure 1).
1 2
3
Figure 1. UAS and scientific payload. 1: camera, 2: drone, 3: gimbal
The camera was set with a nadir-viewing angle and a shooting rate of 15 pictures per minute. At 10 m above the sea surface, the field of view is 53.1°, the footprint is 10 x 7 m, and the spatial resolution (i.e., pixel size) is 3 mm.
2.2 Field experiment
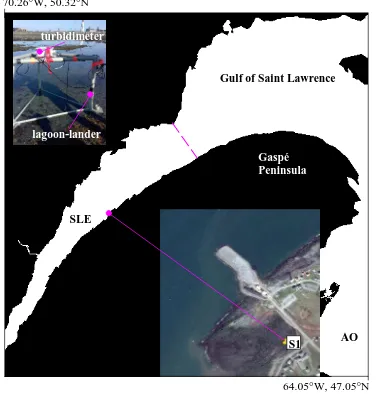
UAS flights were conducted over an intertidal area of a small cove in the lower estuary of the Saint Lawrence System, Canada (48.515°N, 68.469°W) (Figure 2). Images were taken 11:30 am and 12:30 pm of October 1, 2013.
Figure 2. Study area. S1: sampling location, in situ instrumentation (inset upper-left corner), SLE: Saint Lawrence
Estuary, AO: Atlantic Ocean
Changes on underwater light attenuation during the UAS flights was quantified based on turbidity and chromophoric dissolved organic matter (CDOM) absorption (aCDOM) measurements.
Continuous turbidity data was recorded every minute using an OBS3+ sensor (Campbell Instruments). Discrete aCDOM determinations were made based on spectrophotometry (Mitchell et al., 2002). Water level was determined every 15 minutes from a tidal gauge situated at Rimouski City (Fisheries and Ocean Canada). intensity variations by using the Rahman bidirectional reflectance function (BDRF) (Rahman et al., 1993):
))
Values of Ed were computed based on a radiative transfer model (RADTRAN). Ancillary meteorological information (wind, visibility) was obtained from local monitoring stations at Mont Joli airport. Concentration of ozone and precipitable water was derived from climatologies provided by SeaDAS 7 software (NASA's Ocean Biology Processing Group).
The temporal variability on solar illumination was minimized by scaling each ρs value with the following factor:
The cloud-shadow method was applied to images previously corrected by the illumination effects. The shade of the lagoon-lander structure was geolocated and used for extracting the dark pixels (hereafter dp) (Figure 3).. Likewise, bright pixels were
lagoon-lander
Figure 3. Pixel extraction for cloud-shadow algorithm. dp
selected from a contiguous area (hereafter bp).The arithmetic average of Li was computed for each type of pixels and within a binary mask having the same size (201 x 401 pixels or 60.3 x 120.3 cm). The bottom-radiance contribution (fb) as percentage and for each spectral range (X) is:
1
where X corresponds to R,G, and B matrices.
3. RESULTS
Figure 4. Illumination correction. Rahman BDRF at noon (upper panel), BDRF factor (lower panel),in the upper-left inset
φ1 (red arrow) and φ2 (blue arrow)
As expected, the largest magnitude of the BDRF was observed at the center of the footprint as the camera off-nadir angle never exceeded 2°. Also, a larger correction due to sunlight variability was found close to the camera viewing angle.
The difference between total upwelling photons originated from water scattering and bottom reflections (i.e., bp pixels) and those solely derived from the water column (i.e., dp pixels) is summarized in Figure 5 for two times of the day.
It is clear from the graph that fb computed for the visible spectrum increases as the water becomes less turbid (i.e., smaller NTU or nephelometric turbidity units) even though the higher water level as the tide rises.
Time (h)
Figure 5. Proportion of bottom-derived radiance as a function of water turbidity and tide height
Measurements of aCDOM at 412 nm were fairly constant during the time series (0.04 ± 0.001 m-1 = arithmetic average ± 2 standard errors) suggesting that light attenuation was mainly determined by suspended particulates. Thus, NTU was a good indicator of water transparency changes in our study.
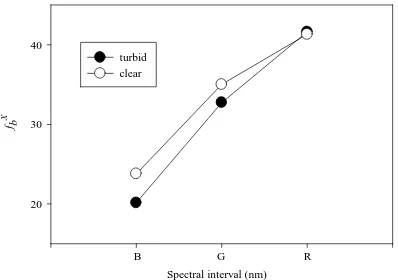
The spectral variation of fb for relatively clear and turbid waters (i.e., NTU values at 11:30 am and 12:30 pm, respectively) is
Figure 6. Proportion of bottom-derived radiance for different spectral region. Turbid and clear waters are defined based on
contrasting cases shown in Figure 5.
As anticipated based on remote sensing reflectance measurements reported in the literature, the influence of bottom contribution to total upwelling reflectivity was more important at longer wavelengths.
Moreover, fbX within the red spectral window was not affected by water turbidity. Conversely, bottom-related contributions were substantially reduced at shorter wavelength intervals as the water visibility decreases. This later effect can be attributed to multiple particle scattering contributions to dp values and originated from adjacent pixels.
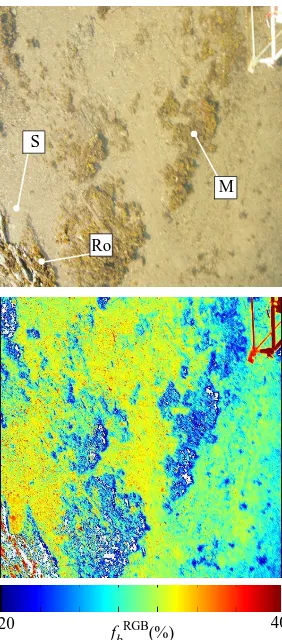
The spatial distribution of fbRGB over the UAS footprint surrounding the lagoon-lander reference location is depicted in Figure 7. The calculation of fbRGB throughout the whole area was simplified by using the same dp values obtained in the vicinity of the lagoon-lander structure.
fbRGB(%)
20 40
M S
Ro
Figure 7. Proportion of bottom-derived radiance over different benthic cover types. M: macroalgae, S: broken shells, Ro: rock
As a first-order approximation, the cloud-shadow technique quickly revealed the larger bottom reflectivity of rocks and sediments largely composed by mussel shells (fbRGB > 40%) with respect benthic communities dominated by macroalgae (fbRGB~25%).
However, a finer analysis should include a shade-detection algorithm for finding multiple dark spots scattered over the image and produced by several types of objects sitting on the bottom (e.g., rocks) or floating near the top of the water surface (e.g., algae).
4. CONCLUSIONS
This study presents for the first time one technique for estimating bottom reflectivity based on UAS images and the same principles proposed for the cloud-shadow algorithm. This proved that UAS can be used as a practical remote sensing platform to enhance satellite products by providing complementary information about bottom cover types.
This is expected to have a major implication in coastal erosion studies as more accurate satellite retrievals of bottom depth and turbidity patterns in optically shallow waters will be achieved. Likewise, the nearshore discrimination of bottom and water optical properties by UAS is expected to have a major application for correcting time series of ocean colour observations derived from existing (e.g., GOCI) and future (e.g.,
The approach developed here is not invasive, thus specific in
situ measurements of bottom and water signatures are not
required. This is particularly useful in nearshore environments where suspended particulates and bottom optical properties are highly variable.
Preliminary results are very encouraging even though additional experiments are needed for calibrating UAS images with optical measurements derived from radiometers. Likewise, Monte Carlo simulations should be done in the future in order to determine impact of multiple particle scattering on dp magnitude and subsequent variability of fbX.
ACKNOWLEDGEMENTS
We are very grateful with Professor Thomas Buffin-Belanger for lending the UAS and the UAS pilot Gérard Michaud for his assistance during the flights. This contribution is part of OPUS (Optimal Processing of UAS Optical signatures) an international project between Quebec (co-PI: Montes-Hugo) and Barcelona (co-PI: Barrado and Pastor), and funded by the Ministère des relations internationales, de la Francophonie et du commerce extérieur
(MRIFCE), Québec, Canada.
REFERENCES
Ambrosia,V.G.;Wegener,S.S.;Sullivan,D.V.;Buechel,S.W.;Dun agan,S.E.;Brass,J.A.;Stoneburner,J.;Schoenung,S.M.,2003. Demonstrating UAV-aquired real-time thermal data over fires. Photogr. Eng. Rem. Sens.,69,391-402.
Berni, A.J.;Zarco-Tejada, P.J.;Suarez,L.;Fereres, E. 2009. Thermal and Narrowband Multispectral Remote Sensing for Vegetation Monitoring From an Unmanned Aerial Vehicle. IEEE Trans. Geosc. Rem. Sens.,47, doi. 10.1109/TGRS.2008.2010457
Jiang, J,; Liu, D.,; Gu, J.; Susstrunk, S., 2013. What is the Space of Spectral Sensitivity Functions for Digital Color Cameras?. IEEE Workshop on the Applications of Computer Vision (WACV).
Lee, Z.;Carder, K.L.;Chen,R.F.;Peacock, T.G. 2001. Properties of the water column and bottom derived from Airborne Visible Infrared Imaging Spectrometer (AVIRIS) data. J. Geophys. Res.,106,C6,11,639-11,651.
Mitchell, B.G.; Kahru, M.; Wieland, J.; Stramska, M. 2002: Determination of spectral absorption coefficients of particles, dissolved material and phytoplankton for discrete water samples. In Ocean optics protocols for satellite ocean color sensor validation. Revision 3. Edited by J.L. Mueller and G.S. Fargion. NASA Technical Memorandum, 2002-21004/Rev 3, Vol. 2. NASA Goddard Space Center, Greenbelt, Maryland. pp. 231–257,2002.
Rahman, H.; Pinty, B.; Verstraete, M.M., 1993. Coupled surface-atmosphere reflectance (CSAR) Model 2. Semiempirical surface model usable with NOAA Advanced Very High Resolution Radiometer Data. J. Geophys. Res.,98,D11,20,791-20,801.
Reinersman, F.;Carder K.L.; Cheng,F.I.R., 1998. Satellite-sensor calibration verification with the cloud-shadow method. Applied Optics, 37, 5541-5549.
Wang, C.K.; Philpot W.D., 2007. Using airborne bathymetry lidar to detect bottom type variation in shallow waters. Rem. Senss Environ.,106,123-135.