AN OPTIMISED SYSTEM FOR GENERATING MULTI-RESOLUTION DTMS USING
NASA MRO DATASETS
Y. Tao, J.-P. Muller, P. Sidiropoulos, J. Veitch-Michaelis, V. Yershov
Imaging group, Mullard Space Science Laboratory, University College London, Holmbury St Mary, Surrey, RH56NT UK ([email protected]; [email protected]; [email protected]; [email protected]; [email protected])
Commission III, WG III/1
KEY WORDS: multi-resolution, DTM, MRO, CTX, HiRISE, CASP-GO
ABSTRACT:
Within the EU FP-7 iMars project, a fully automated multi-resolution DTM processing chain, called Co-registration ASP-Gotcha Optimised (CASP-GO) has been developed, based on the open source NASA Ames Stereo Pipeline (ASP). CASP-GO includes tie-point based multi-resolution image co-registration and an adaptive least squares correlation-based sub-pixel refinement method called Gotcha. The implemented system guarantees global geo-referencing compliance with respect to HRSC (and thence to MOLA), provides refined stereo matching completeness and accuracy based on the ASP normalised cross-correlation. We summarise issues discovered from experimenting with the use of the open-source ASP DTM processing chain and introduce our new working solutions. These issues include global co-registration accuracy, de-noising, dealing with failure in matching, matching confidence estimation, outlier definition and rejection scheme, various DTM artefacts, uncertainty estimation, and quality-efficiency trade-offs.
1. INTRODUCTION
1.1 Background and Context
Understanding the role of different planetary surface formation processes within our Solar System is one of the fundamental goals of planetary science research. There has been a revolution in planetary surface observations over the last 15 years, especially in 3D imaging of surface shape. This has led to the ability to be able to overlay different time epochs back to the mid 1970’s, to examine time-varying changes, such as the recent discovery of mass (e.g. boulder) movement, tracking inter-year seasonal changes and looking for fresh craters.
To track these changes whether manually or automatically using data mining on the planet Mars, it is important to be able to be able to process data from different sensors and therefore address issues of processing large datasets with different image resolution, lighting conditions, coverage and locational accuracy. The goal of our work is to be able to maximize the exploitation of the available planetary datasets to enable improved understanding of the geology and geomorphology of the Martian surface through the generation of high quality co-registered Digital Terrain Models (DTM) and corresponding terrain-corrected images, OrthoRectified Images (ORI), using data from different NASA instruments. Furthermore, these DTMs and ORIs are co-registered to the HRSC/MOLA geocoded global datasets to enable change detection.
The EU-FP7 iMars (http://www.i-mars.eu) project includes the development of higher resolution 3D models which can be employed to create a set of co-registered imaging data through time, so permitting a much more comprehensive interpretation of the Martian surface to be made.
Within the iMars project, a fully automated multi-resolution DTM processing chain has been developed, called Co-registration ASP-Gotcha Optimised (CASP-GO), based on the
open source NASA Ames Stereo Pipeline (ASP) (Moratto, 2010) and (Broxton, 2008), tie-point based multi-resolution image co-registration (Sidiropoulos, 2015), and Gotcha (Shin, 2012) sub-pixel refinement method. The implemented system guarantees global geo-referencing compliance with respect to High Resolution Stereo Colour imaging (HRSC), and hence to Mars Orbiter Laser Altimeter (MOLA), providing refined stereo matching completeness and accuracy from the ASP normalised cross-correlation.
The CASP-GO processing chain has been tested/applied to stereo Mars Reconnaissance Orbiter (MRO) Context Camera (CTX) imagery (6m) over the Mars Exploration Rover (MER-A, B), Mars Science Laboratory (MSL) and a large area mosaic over the US Geological Survey’s MC11-E area (~100 stereo pairs) and is ready to be applied to the production of planet-wide DTMs and ORIs from CTX and MRO High Resolution Image Science Experiment (HiRISE) 25cm NASA images (~4500 stereo pairs for each) if sufficient computing resources can be found.
In this paper, we summarise issues discovered from experimenting with the use of the open-source ASP DTM processing chain and introduce our new working solutions. These issues include global co-registration accuracy, de-noising, dealing with failure in matching, matching confidence estimation, outlier definition and rejection scheme, various DTM artefacts, uncertainty estimation, and quality-efficiency trade-offs. Examples of DTM processing results from CTX over the MC-11E area will be provided. Internal comparison and evaluation between different DTM pipelines are also shown for the MER and MSL landing sites.
1.2 Dataset Overview
The global reference for our multi-resolution DTM production is MOLA data, which is considered to be the best global Mars 3D reference model to date. Individual MOLA tracks have been
interpolated and extrapolated to yield a global MOLA DTM with a spatial resolution of up to 128 grid-points per degree (463m) with a vertical precision of 2-13m.
The HRSC on Mars Express comprises nine channels/looks that together in a single pass collect multi-angular and multi-colour images of the Martian surface, allowing stereo colour images to be produced from single orbit observations. DLR have generated along-track orbital strip DTMs (at grid-spacing from 50-150m) and ORIs (up to 12.5m/pixel) in Sinusoidal projection system by processing the raw HRSC data using radiometric de-calibration, noise removal, image matching, geo-referencing and photogrammetric processing, and where these have been employed along-track Bundle Adjustment (BA), they are then labelled as “Level-4 Version 50+” when the products reach a satisfactory level of quality. The v50+ HRSC DTMs use the MOLA reference sphere with a radius of 3396.0 km. In iMars, the v50 HRSC ORI/DTMs have been employed for most of the sites as a reference base map for subsequent cascaded CTX/HiRISE DTM production. More recently, with increasingly dense HRSC coverage, DLR has generated a large area mosaic over the US Geological Survey’s MC11-E area (~100 stereo pairs), which covers two of the four proposed ExoMars 2018 landing site candidates. The MC11-E HRSC DTM mosaic uses Equidistant Cylindical projection with grid spacing of 50m for the DTM and colour mosaics, and 12.5m for panchromatic image mosaic. DLR’s MC11-E DTM and ORI are based on the same set of procedures for image filtering and rectification, least squares matching, strip BA, and calculation of 3D points applied for single strip data products, but additionally with bundle block adjustment, joint interpolation of multi-scale 3D point data sets, and photometric correction and image normalisation to an external brightness standard (Thermal Emission Spectrometer albedo).
The MRO CTX currently captures single panchromatic grey-scale images at ~6m/pixel over a swath-width of 30km. The CTX images are usually acquired at the same time as HiRISE so the stereo coverage is very limited also, albeit over a wider swath than HiRISE. UCL have processed CTX stereo pairs for MER-A, MER-B, MSL, Viking-1, Viking-2, MPF, and Phoenix to derive ORI (6m) and DTMs of 18m/grid point resolution using the ASP software in early 2013 within the EU FP-7 Planetary Robotics Vision Data Exploitation (PRoViDE) project. CTX ORI and DTM are essential for accurate HiRISE to HRSC co-registration. In late 2015, within the iMars project, CTX stereo pairs for MER-A, MER-B, MSL have been reprocessed at UCL using an optimised CASP-GO processing chain, which brings CTX ORI and DTM to a higher level of quality. More recently, a total of 69 CTX stereo pairs over the MC11-E area have been processed at UCL using the CASP-GO system.
On the other hand, the NASA MRO HiRISE camera is designed to acquire very detailed orbital images of Mars. HiRISE uses 14 CCDs including 10 red channels, 2 blue-green channels, and 2 NIR channels. The nominal maximum size of the red images is about 20,000 x 126,000 pixels and 4,000 x 126,000 pixels for the narrower B-G and NIR bands. To facilitate the mapping of landing sites, HiRISE produces stereo pairs of images from which the topography can be measured to an accuracy of 0.25 metres. By the time of writing up this paper, UCL has started processing HiRISE DTMs for the test landing sites and MC11-E area.
1.3 CASP-GO Pipeline Overview
The automated DTM processing chain, called Co-registered Ames Stereo Pipeline with Gotcha refinement and Optimization (CASP-GO), takes ISIS formatted “left” and “right” MRO images (HiRISE or CTX) and a reference HRSC orthorectified image (ORIs) as inputs. Using a combination of the UCL-Gotcha (Shin, 2012), which is the 5th generation of an adaptive least squares correlation and region growing matcher that provides accurate and robust sub-pixel conjugate points, and the NASA Ames Stereo Pipeline (ASP) ORIs and DTMs are generated which are co-registered to HRSC (and thence to a MOLA reference frame). The complete workflow has 10 steps (Fig. 1): (a) ASP “left” and “right” image pre-processing (image normalisation, LoG filtering, pre-alignment); (b) ASP disparity map initialisation (pyramid cross-correlation and building a rough disparity map); (c) Maximum likelihood sub-pixel refinement and building of a float initial disparity map; (d) ASP sub-pixel correlation; (e) Rejection of mis-matched disparity values and erode matching gaps; (f) Adaptive Least Square Correlation (ALSC) sub-pixel refinement; (g) Gotcha (ALSC with region growing) densification of disparity maps; (h) Co-kriging grid-point interpolation to generate ORI and DTM as well as height uncertainties for each DTM point; (i) ORI co-registration/geocoding with reference to HRSC orthoimage and DTM adjustment; (j) Generation of Object Point Cloud (OPC) using a remote server at our collaborator at Joanneum Research Institute for 3D real-time visualisation on a GPU using Pro3D®, specifically for HiRISE products.
In CASP-GO, we have developed a fully automated processing system with improved performance compared to the original ASP system. In particular, CASP-GO includes (a) co-registered geo-spatial coordinates w.r.t HRSC (and MOLA) data; (b) improved DTM completeness for unmatched areas; (c) reduced DTM artefacts; (d) improved DTM accuracy; (e) fully documented uncertainties for every height point. The CASP-GO processing system has been initially applied to MER, MSL, and MC11-E CTX stereo images and is being streamlined to be applied to a large fraction of the CTX stereo pairs (≈4,500 pairs each) and some 400 pairs of HiRISE within the iMars project. These products will all be available to the planetary science community by the end of iMars through the iMars webGIS.
2. CASP-GO PROCESSING CHAIN
2.1 Original ASP Workflow
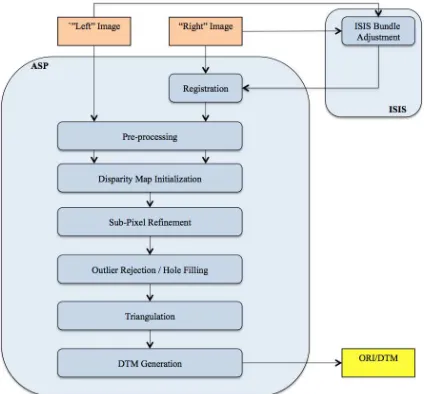
The NASA Ames Stereo Pipeline (ASP) is a suite of automated geodesy and stereo-photogrammetry tools designed for processing planetary imagery captured from orbiting and landed robotic explorers on other planets or Earth. It was designed to process stereo imagery captured by NASA and commercial spacecraft and produce cartographic products including digital elevation models (DEMs), ortho-rectified imagery, and 3D models. The original Ames Stereo Pipeline (ASP) was developed by the Intelligent Robotics Group (IRG) of Intelligent Systems Division at the NASA Ames Research Center. It builds on over ten years of IRG experience developing surface reconstruction tools for terrestrial robotic field tests and planetary exploration (Moratto, 2010). Figure 1 shows a schematic flowchart of the key processes involved.
ASP takes ISIS formatted “left” and “right” images as input and starts stereo processing by (a) pre-processing, including least squares bundle adjustment (BA), left-right image alignment, map projection that eliminates some of the perspective
differences leaving only small perspective differences in the images, image normalisation to bring the two images into the same dynamic range, and image filtering to reduce noise and extract edges; (b) disparity map initialisation that uses a pyramid tiled, integer based correlation approach to find correspondences between pixels in the left image and pixels in the right image; (c) sub-pixel refinement to obtain sub-pixel correlation from their integer estimates; (d) triangulation that uses the geometric camera models stored in ISIS cub files to find the closest point of “intersection” of the two camera rays from disparity map and finally (e) DTM and ORI generation.
Figure 1. Flow diagram of the original ASP processing chain.
The original ASP pipeline was investigated in the early stages of the iMars project. A quality assessment of the processed results were made by comparing the output DTMs with those produced from the BAE Socet System (SS) and the University of Seoul (UoS) pipeline applied to the same regions on Mars. For this purpose input CTX and HiRISE stereo images of the three most observed sites on MER and MSL were chosen. The supporting (reference) DTMs and images were taken from the HRSC products overlapping with the CTX images.
The averaged and standard deviation of the differences between the HRSC, ASP, SS, and UoS DTMs for CTX was +1.4 ± 84.2m, −2.1 ± 84.4m and −2.7 ± 84.9m, respectively. The same differences for the HiRISE instrument were −13.3 ± 19.7m, +4.2 ± 19.7m and +2.3 ± 37.2m. The large dispersion of the differences is due to a larger number of surface features over a larger area for CTX and a smaller number of features for a smaller area covered by the HiRISE instrument. The results were considered to require improvement in global consistency, completeness and robustness.
Generally different DTMs from different pipelines have different kinds of artefact. For example, the OSU HiRISE DTM employed within the PRoViDE project has mis-matched outliers in some crater regions, the ASP processing chain has a quilting artefact caused by initial integer base cross-correlation, failed matching areas for texture-less places, and there are known artefacts in the UoA/USGS products, such as “Boxes”, CCD seams, faceted areas and manually interpolated areas. These artefacts are generally minor for GIS and visualisation after a DTM spacing (down-sampling) of 3:1 from full pixel level resolution. However, for a detailed geological study of selected sites, a DTM at a higher level of quality and lower level of
artefacts is always desirable. Therefore, we have taken advantages of the open source ASP pipeline and further extended/modified several key components to specifically address issues found from the experimental products, in order to develop a more optimal processing chain, called CASP-GO, to provide co-registered geo-spatial coordinates w.r.t HRSC (and MOLA) data, improved DTM completeness, reduced DTM artefacts, and improved DTM accuracy.
2.2 CASP-GO Workflow
The CASP-GO pipeline is shown in Figure 2. Apart from the ASP pre-processing, cross-correlation matching, triangulation, and DTM/ORI generation, five additional workflows were introduced to further improve the ASP results. These included (a) a fast Maximum likelihood sub-pixel refinement method to build a float initial disparity map; (b) an outlier rejection and erosion scheme to define and eliminate mis-matches; (c) an ALSC and region growing (Gotcha) based refinement and densification method to refine the disparity value and match un-matched and mis-un-matched area; (d) co-kriging grid-point interpolation to generate DTM as well as height uncertainties for each DTM point; (e) ORI co-registration w.r.t. HRSC. Each of these function extensions/modifications (labelled as UCL pipeline) will be introduced in detail in this section.
Figure 2. Flow diagram the proposed UCL-Ames CASP-GO processing chain.
2.3 Initial Disparity Refinement
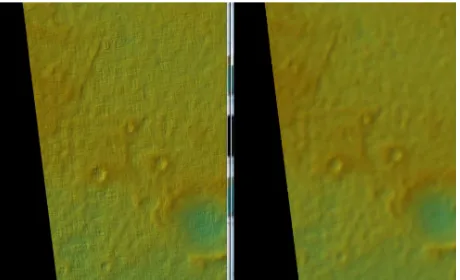
During our experiments on the CTX DTMs for A, MER-B, and MSL, one of the artefacts we found is a “staircase” effect in the overall DTM. The artefact can be observed clearly after a hill-shading process with an elevation of 30º and azimuth of 330º for the light source. In Figure 3, the quilting pattern repeats in the same resolution of the first level of pyramid, which equals to the resolution of the initial disparity map. We found that even though ASP Bayes EM weighted affine adapted correlation exhibits a high degree of immunity to image noise, refining the lower resolution integer disparity map generates severe artefacts resulting in this quilting pattern. Pixel locking effects appeared on both the faster ASP sub-pixel correlation solution, i.e. parabola fitting, and the slower sub-pixel solution, i.e. Bayes EM weighted affine correlation. This is because the sub-disparities tend toward their integer estimates and when using a lower resolution integer estimates, the algorithm doesn’t guarantee continuity between sub-disparities from different
adjacent integer estimates. The “staircase” becomes most obvious in feature rich areas, e.g. crater edge, because the difference between two adjacent integer estimates is higher in these areas.
In order to reduce the “staircase” artefact, we can either generate integer disparity estimates at the same resolution of final sub-disparities, or generate float disparity estimates at lower resolution. We applied a fast Maximum Likelihood image matcher (Olson, 2002) to generate float disparity estimates on the same resolution as the ASP integer based correlation. The probabilistic formulation for lower resolution matching uses an arbitrary likelihood function for the matching error between edge or image features that eliminate the sharp distinction between matched and unmatched templates. In this approach, we seek for maximum likelihood estimation of template positions, i.e. the joint probability density function (PDF) for the distances. The joint density is modelled as the sum of the error density when an edge pixel is an inlier and probability density of the distances when the edge is an outlier. (Olson, 2002) described a multi-resolution search strategy that examines a hierarchical cell decomposition of the space of possible template positions, which divides the space of template positions into rectilinear cells and determines which cells could contain a position satisfying the acceptance criterion recursively. In our case, given that we have already obtained integer distance estimation and to compute the probability density function, only the magnitude of distances is required, the searching strategy can be simplified to finding template positions in 8 directions with a threshold equals to half of the difference of integer disparity value in each directions.
The maximum-likelihood measure gains robustness by explicitly modeling the possibility of outliers and allowing matches against pixels that do not precisely overlap the template pixel from cross-correlation. It is a fast and robust approach to turn ASP integer disparity to float initial disparity maps at a lower resolution, which will be used as seed disparity in ASP sub-pixel cross-correlation, i.e. the 4th step in CASP-GO system. The results are shown in the right hand image of Figure 3.
Figure 3. An example of the MER-A DTM, showing quilting artefact from ASP processing (left) and DTM after initial disparity refinement in CASP-GO (right).
2.4 Outlier Rejection and Erosion Scheme
Final sub-pixel disparity maps obtained from the refined initial disparity map still have several different problems for different data. For example, from our experiments on the CTX DTMs for MER-B and MSL, two obvious problems are unmatched areas (no disparity available, i.e. errors of omission) and mismatched areas (wrong disparity, i.e. errors of commission). The first issue can be triggered in various situations: (a) the regions of
matching have different lighting conditions/contrast/specular properties of the surface; (b) the regions of matching have very little texture or extremely low contrast that the insufficient signal to noise ratio may be rejected by the correlation; (c) the regions of matching are highly distorted due to different image perspective, such as crater and canyon walls.
The ASP correlation process attempts to find a match for every pixel using a window that evaluates the lowest cost compared to all the other search locations. Generally, if we use a smaller search kernel and smaller search range, there will be more unmatched area, given more chances that the template in the left image can not find any matched template in the limited search area in the right image. However, if we set the kernel larger, then more areas can be matched but with more losing sharp features, because the disparity tends to be too smooth. If we set the search range larger, chances are that the template in the left image can find a “matched” template far beyond the true position with a lower correlation cost because the true position meets one of the situations listed above. The first issue hence becomes the second issue, i.e. mis-matches. It is hard to eliminate all mis-matches even though we use a more accurate pre-allocated search range, which is not always possible, due to the native weakness of cross-correlation. Also we do not want too much unmatched area, in which case the follow-on densification and co-kriging steps will take too many computing hours.
Therefore, in CASP-GO we normally set a slightly larger correlation kernel, which will minimise un-matched area, but smaller search range, which will minimise mis-matches. Then reject matched area, and erode on the border of mis-matched pixel and un-mis-matched pixel, since generally the matching quality is much lower at the neighbours of “bad” disparities. This will leave “only” un-matched area, which can be addressed from follow-on Gotcha densification and co-kriging interpolation, on ASP sub-pixel disparity output.
The outlier rejection schemes are: (a) a disparity value differs than a threshold by a percentage of pixels in a kernel; (b) a kernel with standard deviation higher than a threshold; (c) the difference of the mean value of a kernel and neighbouring kernel is higher than a threshold; (d) a kernel with a neighbouring kernel being rejected by a threshold percentage; (e) adjacent disparity values from (a), (b) and (c). Note that the outlier rejection schemes may also remove some disparities that are actually correct. However this can be easily and more precisely re-matched in the next step (Gotcha densification).
2.5 ALSC Refinement and Gotcha Densification
Based upon the “cleaned” sub-pixel disparity map, an ALSC refinement is performed on all the remaining disparity values iteratively. These refined disparity values are used as seed points for Gotcha densification (Shin, 2012). The Gotcha matcher that is based on ALSC and region growing is robust and accurate, but very slow in large-scale image matching since it tries to match every point iteratively and re-sort all seed points when a new point is matched. However, given sufficient number of sub-pixel disparities that passed the outlier rejection schemes, small difficult regions can be matched with Gotcha accurately. For example, the geometrical distortion generated by different viewing angles can be addressed with Gotcha by modifying the shape of ALSC window iteratively.
The Gotcha algorithm applied in this work can be summarised as (a) with given sub-pixel disparity values, retrieve seed
points (point correspondences) on the border (within 5-11 pixel width) according to the x and y translation (disparity); (b) run ALSC on seed tie-points and store similarity value; (c) sort seed tie-points by similarity value; (d) a new matching is derived from the adjacent neighbours of the initial tie-point with highest similarity value; (e) if the new match is verified by ALSC then it is considered as seed tie-points in next growing; (f) this region growing process repeats from (c) to (e) until there are no more acceptable matches; (g) retrieve final disparity map after densification.
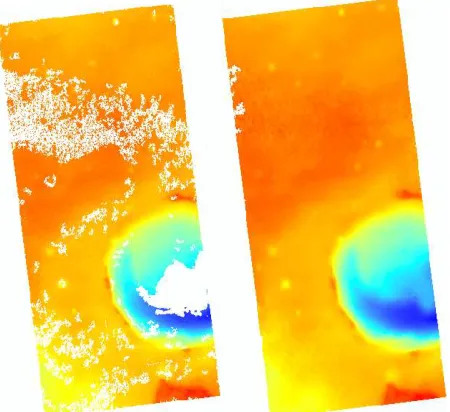
Figure 4. An example of MSL DTMs derived from CTX stereo, showing un-matched areas from ASP processing (left) and improved completeness using Gotcha densification in CASP-GO (right).
With Gotcha densification, we can achieve improved completeness on final DTM without significantly smoothing out sharp features from large matching kernel. Generally a larger ALSC window and eigenvalue yields better completeness in disparity and hence DTM. The similarity values from Gotcha matcher are then used together with co-kriging parameters to produce DTM uncertainty values. See Figure 4 for an example of this.
2.6 Co-kriging Interpolation
After Gotcha densification, ideally we should get disparities for most of the pixels. However for some textureless or extremely low contrast area, where the matching is rejected by both cross-correlation and Gotcha, the final DTM may still has “holes” remaining. In this work, we used the co-kriging method to interpolate onto a gridded DTM. Kriging is a robust technique that uses a spatial model to bias the interpolation process. The basic idea of Kriging in DTM interpolation applications is to use a weighted average, which depends on both the distance of point pairs and spatial variation, of neighbouring known elevation values to predict a missing elevation value. A detailed description of theKriging method can be found in (Stein, 1999).
In CASP-GO, a co-kriging method has been integrated using the Geostatistics Template Library (GsTL)’s co-kriging implementation. Co-kriging is a computationally expensive algorithm. It is impractical to repeatedly solve the Kriging equations using all observations available. Therefore, a fixed search radius was used for determining neighbouring points has been used in CTX DTM interpolation. Also, the total size of interpolation needs to be minimised from stereo matching and Gotcha densification steps. Nevertheless, co-kriging greatly improved the accuracy over linear facet interpolation of a Delauney triangulation of the data and provides an accuracy estimate for each point interpolated based on the estimated quality of the data, which can be indicated from the ALSC similarity, and the spatial variation of the terrain.
Each elevation output from stereo matching has associated with it various parameters, which may correlate with the elevation accuracy. These include the maximum eigenvalue of the covariance matrix that reflects uncertainty in the positioning of
the matching window, a measure of local consistency of line disparities, and optionally parameters of radiometric gain and shift, and skewness from the camera model.
On the other hand, the two rays from the camera centre to a pixel location never intersect perfectly at a 3D point in practice. This is because any slight error in camera position or orientation information will affect the camera rays’ positions. When taking the closest point of intersection of the two rays as the location of 3D from ASP disparity to point clouds triangulation, the actual distance between the camera rays at the point becomes an important elevation accuracy parameter. The distance between the two rays at their closet intersection is also a weighted term of the final uncertainty value.
Figure 5. An example of MER-B DTM after bad matching rejection in CASP-GO (left) and final DTM using Gotcha densification and co-kriging.
2.7 ORI Co-registration and DTM Adjustment
The refined stereo matching workflow has brought the CTX and HiRISE DTM production to a new level of accuracy. However, the HiRISE and CTX datasets are generally not co-registered with the HRSC ORI/DTM (DLR processed v50 products) and MOLA dataset. This was reported in a previous EU project – PRoVisG and follow-on HiRISE-CTX-HRSC co-registration work in (Tao, 2015). These mis-registrations are about 100-200m between HiRISE/CTX and HRSC for the MER and MSL areas, according to manually selected control points on obvious landmark features, such as crater edges.
In this work, we have added a Mutual Shape Adapted Scale Invariant Feature Transform (MSA-SIFT) based co-registration workflow to the final ORI and DTM product. Technical details of MSA-SIFT and the evaluation on ORI/DTM co-registration results for MER and MSL are described in (Tao, 2015). In this ORI co-registration and DTM adjustment work, we take HRSC ORI as reference image for CTX ORI co-registration and subsequent shift of CTX DTM according to the CTX ORI to HRSC ORI transformation. For HiRISE co-registration, we take registered CTX ORI as reference image for HiRISE ORI co-registration and subsequent transformation of HiRISE DTM.
Figure 6. an example of MSA-SIFT tie-points from MER-B CTX ORI (left) and HRSC ORI (right), showing increasing uncertainty value from blue to red.
Bringing all CASP-GO products into an unique geo-spatial context with respect to HRSC and MOLA data is important for data exploitation such as visualisation, GIS and change detection, which are the main goals in iMars.
3. RESULTS
3.1 CASP-GO DTMs over MER, MSL, and MC-11E
The CASP-GO processing chain described in this paper has been tested/applied to stereo CTX (6m) imagery over the MER, MSL and a large area mosaic over the US Geological Survey’s MC11-E area (~80 stereo pairs) and is now ready and waiting to be applied to the production of planet-wide DTMs and ORIs from ~4,500 CTX stereo pairs and ~400 (out of ~4,500) HiRISE stereo pairs where there are repeat views.
The CASP-GO output includes ORI, DTM, Gotcha mask, co-kriging mask, uncertainty map and hill-shaded colourised browser products, which can be directly ingested into the iMars web-GIS server.
Apart from the MER-A, MER-B, MSL CTX DTM, we have also processed all available CTX stereo pairs over the MC-11E area to 18m DTM and 6m ORI.
Figure 7. An overview of processed CTX DTMs superimposed on the MC-11E HRSC DTM mosaic (colour bar in local stretching).
Figure 8. Example of MC11-E CTX DTM browser products.
The resultant DTMs are shown in Figures 7 and 8.
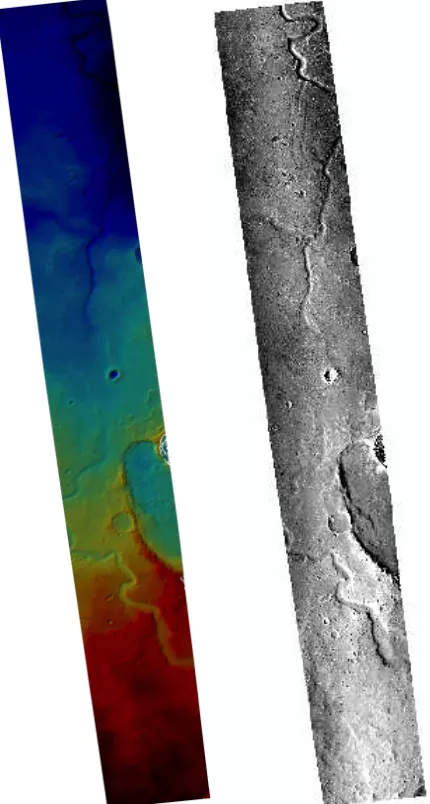
Figure 9. An example of one of the MC11-E CTX DTM and ORI products from CASP-GO pipeline.
3.2 WebGIS and 3D Visualisation
iMars CASP-GO data products will be made available as open source through the iMars webGIS platforms and will also be released through the NASA PDS and possibly the ESA-PSA data archiving centres. Generation of Object Point Cloud (OPC)
for 3D real-time visualisation on GPU using Pro3D®, specifically for HiRISE products, is done in collaboration with Joanneum Research and VRVis, from previous work within the PRoViDE project.
4. SUMMARY AND FUTURE WORK
4.1 Pipeline Summary
In this paper, we have introduced a fully automated multi-resolution DTM processing chain, called CASP-GO, based on the open source NASA ASP software, tie-point based multi-resolution image co-registration, Gotcha sub-pixel refinement, and co-kriging method. The implemented system guarantees global geo-referencing compliance with respect to HRSC and MOLA, provides refined stereo matching completeness and accuracy from the ASP normalised cross-correlation. We introduced issues discovered from experimenting with the use of the open-source ASP DTM processing chain and solutions from our new pipeline. These issues include global co-registration accuracy, de-noising, dealing with failure in matching, matching confidence estimation, outlier definition and rejection scheme, DTM artefacts, uncertainty estimation, and quality-efficiency trade-offs.
4.2 Data Processing Summary
At UCL-MSSL, we have mirrored the HRSC, CTX, HiRISE data volumes in a local shared storage system in order to speed up the production process with an option such that if data is unreachable it can be read from the original source again. The developed software is installed in a shared directory, which is accessible from 14 Linux processing blades (10 with 16 cores and 48GB RAM; 4 with 24 cores and 96GB RAM). Jobs are controlled via a local desktop machine and distributed to the 14 processing blades with multiple sessions of multi-threaded processing. Processed results are stored in several 1TB RAID storage disks and logged back to the local controlling desktop. Failed jobs can be examined through detailed log files and in the future will be reprocessed automatically with different processing parameters. Once all jobs are done, the resulting products will be fetched by a PostgreSQL database and displayed in a web-GIS systems or converted at Joanneum Institute for eventual use within the the Pro3D® viewer (the 3D rendering/analyzing software developed by VRVis in PRoViDE project), which is installed on a GPU server at MSSL. The GPU has a K-2 GRID card with 0.5TB RAM and 24TB local disk space and can support up to 16 simultaneous users.
We have experience several difficulties during the processing chain development and testing stage with handling large data volumes. For example, to address the large data size problem, we use pyramiding and tiling for large HiRISE scenes and mosaic afterwards. To address single processing computational complexity, we use computationally inexpensive algorithms for initial processing and use more complex methods for result improvement. In the future, we plan to port most of our existing processing chains to a GPU server, to further accelerate single session processing time. Automated task scheduling system is also important to handle large data volumes. Moreover, an automated image quality assessment mechanism has been developed at MSSL to distinguish different levels of image quality for HiRISE, CTX and HRSC image in order to improve the job success rate and save processing time from low quality input data.
4.3 Future Work
Regarding the automated DTM pipeline, we are currently about to start processing a large fraction of the CTX and HiRISE stereo pairs accumulated to date in a matter of several months on a large Linux cluster of 224 cores. The CASP-GO software can also be applied to the ExoMars Trace Gas Orbiter 2016 CaSSiS instrument colour stereo views. We plan to further extend the capability and make the CASP-GO open source.
ACKNOWLEDGEMENTS
The research leading to these results has received funding from the European Union’s Seventh Framework Programme (FP7/2007-2013) under iMars grant agreement n˚ 607379 as well as partial funding from the STFC “MSSL Consolidated Grant” ST/K000977/1.
REFERENCES
Moratto, Z. M., M. J. Broxton, R. A. Beyer, M. Lundy, and K. Husmann. 2010. Ames Stereo Pipeline, NASA’s Open Source Automated Stereogrammetry Software. Lunar and Planetary Science Conference 41, abstract #2364.
Broxton, M. J. and L. J. Edwards. 2008. The Ames Stereo Pipeline: Automated 3D Surface Reconstruction from Orbital Imagery. Lunar and Planetary Science Conference 39, abstract #2419.
Olson, C., Maximum-Likelihood Image Matching, 2002, IEEE Transactions on Pattern Analysis and Machine Intelligence, vol. 24, no. 6.
Sidiropoulos, P., and J.-P. Muller, “Matching of Large Images Through Coupled Decomposition,” IEEE Trans. Image
Processing, 2015 vol. 24 (7) pp. 2124-2139. DOI:
10.1109/TIP.2015.2409978
Shin, D. and J.-P. Muller, Progressively weighted affine adaptive correlation matching for quasi-dense 3D reconstruction. Pattern Recognition, 2012. 45(10): p. 3795 -3809.
Stein, M. L. (1999), Statistical Interpolation of Spatial Data: Some Theory for Kriging, Springer, New York.
Tao, Y. and J.-P. Muller, “Automated localisation of Mars rovers using co-registered HiRISECTX-HRSC orthorectified images and wide baseline Navcam orthorectified mosaics”, ICARUS, in proceeding, 2015.