ANALYSIS
Easter Island: historical anecdote or warning for the future?
Rafael Reuveny
a,*, Christopher S. Decker
b,1aSchool of Public and En6ironmental Affairs,Suite430,Indiana Uni6ersity,Bloomington,IN47405,USA bKelley School of Business,Suite451,Indiana Uni6ersity,Bloomington,IN47405,USA
Received 5 October 1999; received in revised form 11 April 2000; accepted 16 May 2000
Abstract
Two standard solutions for the ‘Malthusian Trap’ involve institutional reforms and technological progress. Using Easter Island as an example, we investigate the hypothetical role that technological progress and population management reform might have played in preventing the collapse of the island’s civilization. The model includes a composite manufactured good and a composite harvested renewable resource. Fertility is assumed to rise with per capita income. The resource’s carrying capacity and intrinsic growth rate as well as labor’s harvesting productivity are subject to technological progress. Fertility is subject to population management reform. The model yields a system of two simultaneous, nonlinear, non-autonomous differential equations. We first study the system’s steady states. The system is then parameterized for Easter Island and its comparative dynamics are investigated in simulations. We find that technological progress can generate large fluctuations in population, renewable resources, and per capita utility, sometimes resulting in system collapse. With high fertility rates, the population and the resource vanish. None of the simulations investigated here exhibit a constantly growing per capita utility over time. Finally, we evaluate the applicability of these results to contemporary societies. © 2000 Elsevier Science B.V. All rights reserved.
www.elsevier.com/locate/ecolecon
1. Introduction
Concerns regarding the Earth’s population ex-plosion and the pressure it places on natural resources have rekindled interest in the sustain-ability of economic prosperity, an issue that seems
particularly relevant as we enter a new millen-nium. Brown and Flavin (1999) explain, ‘‘the key limits as we approach the twenty-first century are fresh water, forests, rangelands, oceanic fisheries, biological diversity, and the global atmosphere.’’ They go on to ask, ‘‘Will we recognize the world’s natural limits and adjust our economies accord-ingly, or will we proceed to expand our ecological footprint until it is too late to turn back?’’ These concerns can be traced back to the work of Malthus (1798), who argued that population growth would eventually lead to natural resource
* Corresponding author. Tel.: +1-812-8554944; fax: + 1-812-8557802.
E-mail addresses: [email protected] (R. Reuveny), [email protected] (C.S. Decker).
1Tel.: +1-812-8559219; fax: 1-812-8553345.
depletion, economic decline, starvation, violent conflict, and population decline.2
Many scholars believe that the decline of Easter Island exemplifies Malthus’s predictions (Weiskel, 1989; Ponting, 1991; Keegan, 1993; Brown and Flavin, 1999). The case of Easter Island stands at the center of our paper. A thousand years ago a civilization thrived there; by the time Europeans arrived in 1722, it had essentially disappeared and no one really knows why. While scholars have puzzled over this for years, offering many interest-ing theories, it was not until recently that formal economic modeling was applied to the subject. Brander and Taylor (1998) attempted to solve the mystery by modeling the island’s economy as a predator – prey system of renewable resource use in which the human population, dependent on the
island’s resources for survival, overexploited
them. This ultimately resulted in a dramatic popu-lation decline, a characteristic of the so-called ‘Malthusian Trap.’ Brander and Taylor assumed that island’s resources and institutional structure were not subject to change or reform over time. We build on their work by relaxing these two restrictions. We then address the relevance of our work to modern countries, particularly less devel-oped countries (LDCs).
Two solutions to the ‘Malthusian Trap’ are typically suggested in the literature on sustainable development.3 The first solution involves
institu-tional reforms. In this view, overexploitation of natural resources results from ill-defined property rights. Assigning private ownership to a resource will limit its extraction. Another kind of institu-tional reform involves population management efforts to reduce birth rates. The second solution to the ‘Malthusian Trap’ is technological pro-gress. Natural resource depletion need not be a
concern if technological progress improves re-source yields, carrying capacity and harvesting efficiency. In a sense, technology can provide ‘substitute’ for natural resource depletion (Solow, 1997; Stiglitz, 1997). However, this approach is not without critics. In particular, Georgescu-Roe-gen (1971), Daly (1997) argued that capital and technology ultimately cannot provide substitute for natural resources.
Standard economic growth models emphasize the role of technological progress in securing per-petual growth. Armed with technology, popula-tion issues became tertiary to the analysis. Consequently, in these models population growth is determined exogenously, and typically is as-sumed either to be constant or to grow
exponen-tially. Recently, dynamic models featuring
endogenous population growth have appeared. The studies by Prskawetz et al. (1994), Milik and Prskawetz (1996), Brander and Taylor (1998) are particularly relevant to our paper. In the first two studies, a natural resource harvested under open access is combined with labor to produce a final good, but the consumption side is not modeled. In the Brander and Taylor study, a consumption side is added to a similar, but simplified, analytical framework. All of these studies yield a similar system of differential equations, which is then
parameterized and simulated. The goal of
Prskawetz et al. and Milik and Prskawetz is to illustrate the general mathematical properties of such a model. Therefore, their parameterization is largely without empirical underpinning. Brander and Taylor’s motivation is to study Easter Island specifically and thus their parameterization is cho-sen for that case.
Given the relatively primitive nature of the Easter Island civilization, it seems plausible to ignore — as Brander and Taylor do — institu-tional reforms and technological progress in this case. Yet, as stated earlier, the possible solutions to the ‘Malthusian Trap’ involve precisely these two elements. We can now restate the two goals of our paper more fully. First, we wish to investi-gate two hypothetical questions regarding Easter Island. What could have happened on Easter Island if its technology had been progressing? Similarly, what could have happened if popula-2The work of Malthus, while acknowledged, has been
eclipsed by Adam Smith and David Ricardo. John Maynard Keynes sought to correct this neglect: ‘‘If only Malthus, instead of Ricardo, had been the parent stem from which nineteenth century economics proceeded, what a much wiser and richer place the world would be today (Keynes, 1933:120).’’ Interest in the work of Malthus grew following the work of Meadows et al. (1972).
3For reviews of this literature, see Perman et al. (1996),
tion management had been adopted on the island? Our second goal is to evaluate the applicability of our findings to contemporary societies.4
Many economic growth models assume that technological progress is exogenous and universal. This approach does not explain the sources of technological progress. Beginning in the mid-1980s, endogenous growth models focused on the determinants of technological progress, emphasiz-ing the role of human capital, innovation and economic profits.5In this paper, we do not explain
the determinants of technological progress, but rather seek to investigate the effects of technolog-ical progress. We adopt a typtechnolog-ical neoclasstechnolog-ical economic growth approach and assume the exis-tence of an exogenous and universal process of technological progress.
Our analysis employs a combination of analyti-cal model building and numerianalyti-cal simulations. The model includes a composite manufactured good and a composite harvested renewable resource. Fertility is assumed to rise with per capita income. The resource’s carrying capacity and intrinsic growth rate as well as labor’s harvesting productiv-ity are subject to technological progress. Fertilproductiv-ity is subject to population management reform. The model yields a system of two simultaneous, nonlin-ear, non-autonomous differential equations that, to the best of our knowledge, has no analytical solution. We first study the system’s steady states. The system is then parameterized for Easter Island and its comparative dynamics are investigated in simulations.
The simulations demonstrate that population management can guide the system smoothly to-ward a steady state with positive population and resource levels. Technological progress, however, tends to generate large fluctuations in population and resource stocks, and can even lead to complete
human extinction. None of the simulations exhibit a constantly growing level of per capita utility over time. We conclude our paper by evaluating the implications of these results for contemporary societies.
This paper proceeds as follows. Section 2 de-scribes the model, and Section 3 discusses its parameterization. Section 4 reports simulation re-sults, Section 5 evaluates the contemporary impli-cations of these results, and Section 6 concludes.
2. Analytical model
The model adopts attributes of both the Solow – Stiglitz and the Georgescu-Roegen – Daly ap-proaches. In the spirit of Solow – Stiglitz, we assume that natural resources and man-made
goods are substitutes. However, population
growth is endogenously determined by the
availability of natural resources. Hence, in the spirit of Georgescu-Roegen – Daly, the system is constrained by the natural environment.
2.1. Model de6elopment
Some resource models assume that agents max-imize the sum of their current and discounted future utilities by choosing the amount of the resource to harvest in each period. This framework assumes that a harvesting rule could be imple-mented if a system of enforceable property rights is in place. We extend the work of Prskawetz et al. (1994), Milik and Prskawetz (1996), Brander and Taylor (1998). Like them, we assume that there are no enforceable property rights vis-a-vis renewable resources, which probably was true on Easter Island (Van Tilberg, 1994). Therefore, the agents in the model only maximize their current utility.
The economy is composed of two composite goods or sectors. GoodHis a composite renewable resource good representing an ecological complex, the components of which may include trees, soil
,etc. GoodMis a composite product representing
all other goods, the price of which is normalized to one. For the sake of simplicity, we assume that labor is the only factor of production. In each period, producers maximize profits by using a 4It is also possible to analyze the property rights aspect of
institutional reforms, but this mathematically complex issue merits a separate analysis.
5For a review, see Aghion and Howitt (1998). The gain
linear production function in sectorM,MP
=lLM,
and a Cobb – Douglas production function in sec-torH,HP
=aScL
H
u, where 0
Bc51 and 0Bu5
1. The superscriptPdenotes production,Sdenotes the natural resource stock, LM denotes the labor
devoted to producing M, LH denotes the labor
devoted to harvesting, andlandaare technology
parameters.6 Given our focus on Easter Island,
whose economy was highly dependent on natural resources, we assume the existence of exogenous
labor augmenting
tech-nological progress in harvesting, but not in the production of the composite manufacturing good. For example, a move from man-based harvesting to tools-based harvesting increases the value ofa.7
Economic competition is assumed in both factor and output markets. Hence, the wage rate (w) is considered exogenous by agents and is the same in all sectors. Producers’ profit in the harvesting sector H (PH) is PH=pH
P−wL
H and profit in
the manufacturing sector M (PM) is PM=M−
wLM. The variable p is the price of the harvested
good. Since in a competitive equilibrium no profits
are made, the price of the resource good is p=
wLH/HP and the wage rate is given by w=l.
8
Using the harvesting production function, the price
of the harvested good can be expressed as p=
(lLH
1−u
)/(a(t)Sc).
A representative consumer is assumed to have a Cobb – Douglas utility function that increases with the quantity of both goods (superscriptCdenotes consumption):
where HC and MC are the total quantities
con-sumed of goodsHandMrespectively,Lis
popu-lation, andbis a taste parameter. Each consumer is assumed to be endowed with one unit of labor. Hence, his/her budget constraint is given by the equationw=p(HC/L)+(MC/L). Standard utility
optimization yields consumption values for HC
and MC:
Hc=
Lblp
Mc=L(1−b)l (2)
The population is assumed to be fully employed, so that L=LM+LH. Using the production
func-tion in sector M, we getL=LH+M
P
/l. Market clearing conditions are assumed to hold in each
period in the H and M sectors. Hence, MC=
MP=M and HC=HP=H. Replacing MP with
L(1−b)l in L=LH+MP/l, we derive LH in
terms of L: LH=Lb. Substituting LH in the
ex-pression p=(lLH1−u)/(a(t)Sc), we arrive at the
following expression for the resource price:
p=l(Lb)
1−u
a(t)Sc (3)
Using Eqs. (2) and (3) and the equilibrium condition in both markets, we derive the equi-librium solution for H and M for any given period t:
H=bua(t)LuSc M=Ll(1−b) (4)
The natural growth of the resource is assumed to follow the commonly used logistic form with an intrinsic growth rate r, and a carrying capacityK: GN=r(t)S[1−S/K(t)].
9This functional form
im-plies that whenSequalsK(t), the natural resource growth rate is zero. The overall resource growth is given by its natural growth net of the harvesting rate,GN−H. By substituting the equilibrium
solu-tion for H into this expression, we derive the
differential equation for the resource growth:
dS
In Eq. (5),randKdepend on time because they are assumed to be subject to resource augmenting 6Prskawetz et al. (1994), Milik and Prskawetz (1996) use
our production function in sectorH, and Brander and Taylor (1998) use our production function in sectorM.
7As noted, the efficiency of producing good M(l) is not
increasing over time. Note also that in our model the dynamics ofSandLdo not depend on whetherlgrows over time. See Eqs. (6) and (7). We defer the issue of progress inlto future research.
8The resultw=lholds for a linear production function in
M. For other production functions, the solution is more complicated. However, the added complexity does not change the qualitative nature of the model. See Prskawetz et al.
technological progress. For example, r may in-crease over time due to the development of high
yield seeds. Likewise, K may increase over time
through the development of improved soil fertiliza-tion treatments.
Next, we define the proportional growth rate of the population,w, as:
w=dL/dt
L (6)
We assume that the population’s intrinsic birth rate,b and mortality rate,d, are proportional, so that w=b−d.10 Population is made endogenous
by assuming that w=b−d+F, where F is the
fertility function. We assumeF=f(H/L)x, where
f\0 andx\0 are parameters, andxcaptures the notion of institutional reforms in the form of population management. SubstitutingF,wand the solution forHinto Eq. (6), we derive the differen-tial equation for population growth:
dL
dt=L[b−d+f(b
ua(t)ScLu−1)x]. (7)
InterpretingH/L as per capita income, the ex-pression F=f(H/L)x implies that fertility grows
with per capita income, but with either diminishing or increasing returns, depending onx.11 A similar
assumption is used in Sato and Davis (1971), Lane (1975), Prskawetz et al. (1994), Milik and Prskawetz (1996) and others. Brander and Taylor (1998) apply this assumption to Easter Island. As summarized by Heerink (1994), the fertility func-tion in the model is more appropriate for societies with low per capita income. More generally, and in the spirit of Georgescu-Roegen (1971) and Daly (1992, 1997), many renewable resources supply the health and nutritional requirements necessary for procreation. Without these requirements, the pop-ulation is likely to decline, regardless of its income. In this interpretation, our fertility function cap-tures the notion that the population cannot grow
forever simply by substituting man-made goods for natural resources.12
2.2. Steady states
Eqs. (5) and (7) characterize the dynamic interre-lationship between population (L) and the renew-able resource (S). The solution of this system gives
S and L as functions of time and the system’s
parameters. There are generally two features to such a solution — the steady state (i.e. whenLand Stake on constant values) and the transition path to this steady state. In principle, however, a system of non-linear, non-autonomous simultaneous dif-ferential equations may not exhibit a steady state; its variables may continue to evolve over time.
To find the steady states, we let dS/dt=0 and dL/dt=0 in differential Eqs. (5) and (7) and solve forLandS. The resulting system of equations has
two corner steady states, L=0 and S=0, and and the resource is depleted. In the steady state (L=0,S=K), there are no people in the system and the resource is at carrying capacity.
The system of equationsLZ=0 andSV=0 has
no internal solutions withL\0 and 0BSBK. To see this, note that if an internal steady state were
to exist, then we must haveZ=0 for someL\0
and 0BSBK. Z=0 implies S=E(t)L(1−u)/c, where E[(d−b)/f]1/(xc)[1/(a(t)bu)]1/c. However, the expression S=E(t)L(1−u)/c cannot hold with constant values ofSandLsinceEdepends on time
and u and c are constant parameters.
Finally, note that if a(t), K(t) andr(t) were to asymptote to constant values astgoes to infinity, or alternatively, if the growth rates ofa(t),r(t) and
10With a constantw, the solution of Eq. (6) is the familiar
exponential growth of population (which is typically assumed), L=L(0)ewt, whereL(0) is the initial population.
11It is possible to identify income per capita in the model
with (H+M)/Land notH/L. This does not change the nature of the results since in this modelM/L=l(1−b)=a constant.
12One may argue that medical progress, which reduces
K(t) were all to asymptote at a value of zero as t goes to infinity, then the system might converge to an internal steady state. For example, ifa(t),r(t) andK(t) take a logarithmic functional form, their
growth rates diminish to zero as t approaches
infinity. In this particular case, while never achiev-ing constantL andSvalues, the system of differ-ential Eqs. (5) and (7) might nevertheless mimic an approach to an internal steady state as the growth rates ina,randKdecline over time (yet they never actually reach zero).
3. Parameterization
To the best of our knowledge, the system of differential Eqs. (5) and (7) does not have an analytical solution. Nevertheless, it is possible to simulate its behavior numerically, which requires parameterization. We adopt the parameterization utilized by Brander and Taylor for our base case. For our purpose, the important question is not so much the specific value of a particular parameter in the model, but whether the base case can reproduce known information about Easter Island. Table 1 summarizes the notation, interpretation, and values of the model parameters. The initial
values for S and L are set to 12 000 and 40,
respectively. These are reasonable numbers for
Easter Island. The value of 12 000 is also used for the initial carrying capacity, K(t=0), to capture the situation when the first people arrived on the island (i.e. we assume that the natural resource base was fully established at that time). Next, we consider the harvesting efficiency, a(t). Given K(t=0)=12 000, an initial value of a(t=0)=
0.00001 suggests that if the resource is at capacity, harvesting will initially provide just enough con-sumption necessary to allow the current generation to reproduce itself (i.e. zero population growth). This consumption level is often called subsistence consumption. Such an efficiency level seems a reasonable place to begin since technological pro-gress is often motivated by the desire to grow beyond mere subsistence. Another parameter of interest is the initial intrinsic resource growth rate, r(t=0). Brander and Taylor contend thatr=0.04 is a reasonable value for Easter Island, hence we adopt it as our starting point. The population parameter fand the net birth rate (b−d) are set at 4 and −0.1, respectively. The negative net birth rate implies that without undertaking some effort at survival (i.e. harvesting), the population will decline.13
4. Simulations
We first simulate a base case without technolog-ical progress and compare the results with avail-able historical records pertaining to Easter Island. We then conduct simulations where parameters are changed one at a time (comparative dynamics), and simulations where more than one parameter changes (combination runs). In our simulations, the resource’s carrying capacity (K), the resource’s
Table 1
Base case parameters for simulations
Notation Interpretation Base value Initial human population
L(0) 40
S(0) Initial stock of the renewable 12 000 resource
K Carrying capacity 12 000 Harvesting efficiency
a 0.00001
Intrinsic growth rate of the
R 0.04
renewable resource
Fertility rate 4
f
parameter-sensitivity ofFto HandL
X Fertility rate 1
parameter-institutional reform
13The remaining parameters are as follows. The taste
parameter (b) is set at 0.4. With a Cobb – Douglas utility,bis the share of the labor devoted to harvesting. In many studies, the resource sector absorbs around 50% of labor, thus, b of 0.4 is reasonable. The parametersuandcare set at one. This makes the harvesting function similar to the one suggested by Schaefer (1957) and used in Brander and Taylor (1998) and others (see Clark, 1990). We also tried simulations in whichu
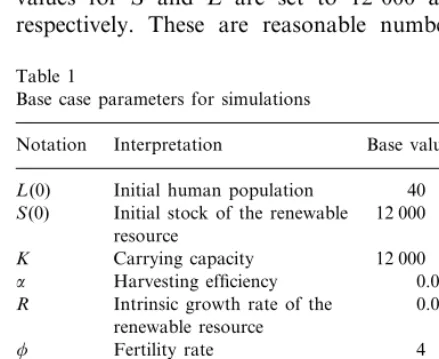
Fig. 1. Base case — no technological progress.
growth rate (r), and harvesting efficiency (a) grow over time, and the fertility relationship takes on various values of x. We use three different values
ofx. The most common pattern for technological
progress in the literature is exponential, where technology advances at a constant rate per period (Solow, 1956; Jones, 1998; Hughes, 1999). This assumption, implying as it does that technology will advance without bound, is not without critics (Daly, 1992). As an alternative pattern to exponen-tial progress, we also inspect cases where progress proceeds at a diminishing (logarithmic) rate over time.14
4.1. Resource and population trajectories
Fig. 1 presents the base case results for a con-stant technology and no population management. The horizontal axis shows 140 time periods, each representing one decade. Period zero corresponds roughly to year 400 A.D., when the first indigenous people are said to have arrived on the island. The simulation ends at period 140, roughly the time when Europeans first arrived on the island (1722 A.D.). As in Brander and Taylor (1998), Fig. 1 generally replicates known historical data for the
island. Starting in period 50, there is a decline in the resource stock. Population peaks at 10 000 during the periods 70 – 100 (years 1100 – 1400 A.D.) and then declines to 3800 around period 140. These population numbers are mid-range estimates for Easter Island.15
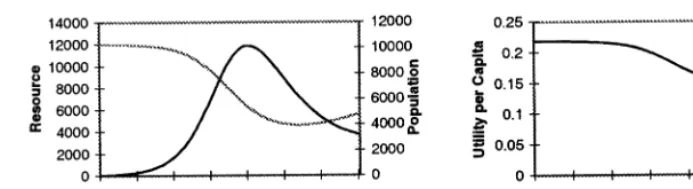
For each of the comparative dynamic simula-tions, we show 200 periods. Fig. 2 presents results that occur when the carrying capacity (K) increases over time, ceteris paribus. With logarithmic pro-gress (Panel A), the population and the resource stock fluctuate over time. Logarithmic technologi-cal progress in K generates slightly more volatile fluctuations relative to the base case. With expo-nential progress inK(Panel B), the system exhibits a twin-peaked, highly non-linear picture that is very different from the base case. Population reaches much higher peaks in this case, compared with the logarithmic case. It jumps to 80 000, falls quickly to near-zero, jumps again to 80 000, and then again falls quickly to near-zero.
Fig. 3 presents results when the resource’s intrin-sic growth rate (r) increases over time, ceteris paribus. In both cases, the resource stabilizes in the long-run, but nearly half of the resource is de-pleted. With logarithmic progress in r (Panel A), population grows in the long run in what appears to be a linear manner. There are no oscillations, but the rate of population growth drops substan-tially in the middle of the simulation. With expo-nential progress in r (Panel B), population grows 14The simulations were conducted using the mathematical
package MAPLE. The numerical method used was the Fehlberg fourth-fifth order Runge – Kutta. The assumed paths of progress are K=12 000+30ln(t+1); K=12 000+30et;
r=0.04+0.1ln(t+1); r=0.04+0.00155e(t/35);a=0.00001e(t/20); a=0.00001+ln(t/5 000 000+1). In fertility, we usedx=0.5, 0.7 and 1.2. We also investigated the effects of linear techno-logical progress. The results were basically similar to those obtained from logarithmic progress.
15For details on Easter Island see Ponting (1991), Van
Fig. 2. Technological progress in carrying capacity, (A) logarithmic progress; (B) exponential progress.
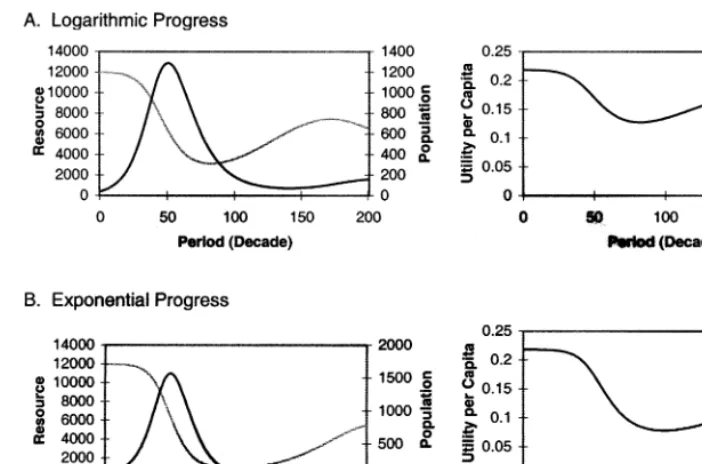
Fig. 4. Technological progress in harvesting, (A) logarithmic progress; (B) exponential progress.
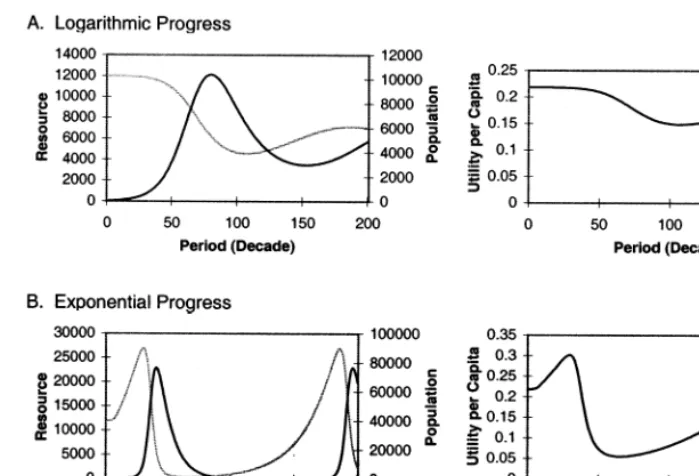
faster in the long run, but both the population and the resource stocks fluctuate in the short and medium runs. In both cases, technological
pro-gress in r has a persistent long-run effect on
population growth; the faster the growth rate ofr, the faster the growth in population. These results stand in marked contrast to the base case.
Fig. 4 presents results when the efficiency of resource harvesting (a) increases over time, ceteris paribus. With logarithmic progress ina(Panel A), population peaks after about 50 periods and sub-sequently declines toward zero. Initially, the re-source is quickly depleted but it is able to regenerate once the population begins to decline. With exponential progress in harvesting efficiency (Panel B), population peaks at about 50 periods, and then falls off quickly. By the end of the simulation, the population level is zero. Because population diminishes before the resource is com-pletely depleted, the resource is able to regenerate. These results differ from the base case. The popu-lation peaks sooner, at a smaller level, and falls off more quickly. With logarithmic progress, the
economy ends up with fewer people and exhibits larger fluctuations, and with exponential progress the population vanishes.
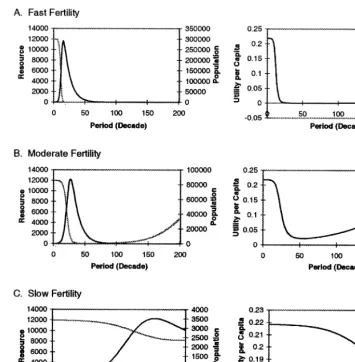
Fig. 5 presents results for three values of popu-lation management efforts (x), ceteris paribus. In Panels A and B, fertility is higher than in the base case (Fig. 1, x=1). In Panel C, fertility is lower than in the base case. We use the terms ‘fast’ to describe the fertility rate in Panel A (x=0.5),
‘moderate’ in Panel B (x=0.7), and ‘slow’ to
describe the fertility rate in Panel C (x=1.2).16In
Panel A, both the resource and population vanish. In Panel B, population is depleted before the resource and the resource regenerates. With a slow fertility rate in Panel C, population does not vanish. Furthermore, relative to the base case, the population and resource trajectories are smoother, population converges at a lower level, and the resource converges at a higher level.
16For the range of the values of S (0 – 12 000) and the
values ofa,b,uandcused here, we getbuacSB1. Hence,
Fig. 5. Populations management efforts, (A) fast fertility; (B) moderate fertility; (C) slow fertility.
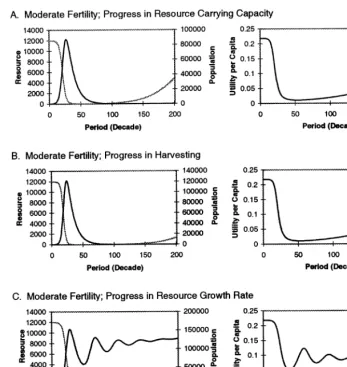
Fig. 6 considers cases where several parameters change concurrently, further demonstrating the inherent complexity of the model. The possible number of combinations of changes is large even in this relatively simple model. We consider three
examples involving moderate fertility (x=0.7)
and logarithmic technological progress. In Panel
A, x=0.7 combines with progress in K.
Popula-tion peaks at a high level but the resource di-minishes quickly. Population then declines to near zero before the resource is diminished, and thus the resource replenishes itself. This result is
dif-ferent from the x=1 case (Panel A in Fig. 2),
where there were oscillations in both the popula-tion and the resource but populapopula-tion did not diminish to zero. Panel B in Fig. 6 considers
progress in a. The outcomes of nearzero
popula-tion and resource stocks develop faster, relative to
the x=1 case (Panel A in Fig. 4). Population
peaks at a higher level, but declines faster. Since population declines to near zero before the re-source is depleted, the rere-source replenishes itself. In Panel C, logarithmic technological progress in
r also generates a different pattern when
com-pared with the x=1 case (Panel A in Fig. 3).
Fig. 6. Multiple parameter simulations, (A) moderate fertility; progress in resource carrying capacity; (B) moderate fertility; progress in harvesting; (C) moderate fertility; progress in resources growth rate.
fluctuate, while when x=1, there are no
fluctuations.
4.2. Social welfare
Our results so far do not measure which sce-nario might be best from a public policy perspec-tive. To address this issue, a measure of social welfare is required. However, there are no univer-sally accepted criteria for devising such a measure (Nicholson, 1998). Consider, for example, total utility as a measure of social welfare. If it were
models, we have assumed the existence of a repre-sentative agent in Section 1 (i.e. all agents have the same utility function). In our case, then, per capita utility can be used as a measure of social welfare.
Figs. 2 – 6 illustrate various time paths of per capita utility17. To evaluate these time paths, we
use three criteria that account for the fact that utility changes over time. As noted above, the relative importance of these criteria, as well as their use, is subjective and ultimately depends on the society’s goals. First, we compare the value of utility at the end of the simulated time period to its initial value (initial-end criteria), an indication of whether or not society generated welfare over the simulation period. Second, we compute the mean value of utility (mean criteria), an indication of the welfare over the entire simulation period. Third, we compute the variance of the utility (variance criteria), an indication of fluctuations in per capita utility over time.
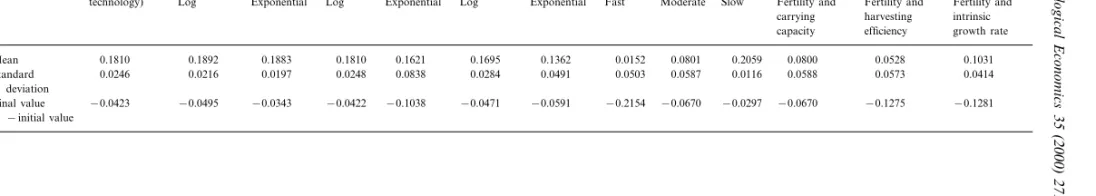
Table 2 presents the welfare effects. From the initial-end criteria, all the simulations generate a lower end-value of per capita utility compared with the initial value. A fast fertility rate generates the greatest decrease in utility, followed by the combination runs. None of the cases in Table 2 does better (and some do worse) than the base case. Hence, the notion that technological pro-gress could lead to ever-increasing social welfare is not borne out in Table 2.
As for the mean criteria, for all types of techno-logical progress, the highest mean per capita util-ity occurs in the case with logarithmic progress in r. The lowest mean value occurs in the case with
exponential progress in a. Overall, the highest
mean per capita utility occurs in the slow fertility rate case, and the lowest occurs in the fast fertility rate case. In the combination runs, the mean levels are generally lower than in the ceteris paribus simulation as well as the base case. Com-pared with static technology, rapid (exponential)
and moderate (logarithmic) improvements in r,
and moderate improvements in K marginally
im-prove welfare. In contrast, rapid increases in K
spark population booms and busts, resulting in a mean per capita utility that is lower relative to the base case. The greatest improvement over the base case comes through slow fertility rates.
As for the variance criteria, the highest variabil-ity in per capita utilvariabil-ity occurs when there is exponential technological progress in K, followed by fast and moderate fertility (both alone and combined with logarithmic progress). The lowest variance occurs in the slow fertility case, followed
by the logarithmic progress in r case. In the
combination runs, the variances are generally higher than in the ceteris paribus cases. With the exception of the two technological progresses inr simulations, and the slow fertility rate simulation, the variances are higher than the static technology (base case) simulation. Of these three simulations, the slow fertility rate generates the smallest volatility in per capita utility.
Finally, per capita utility in the end of the simulation is generally larger when the population is smaller. For example, logarithmic technological
progress in K generates higher end value per
capita utility than exponential progress in K.
However, with logarithmic progress in K, the
number of people at the end of the simulation is lower than when progress is exponential. As noted, whether a smaller number of people, each with a higher per capita utility is preferred to a larger number of people, each with a lower per capita utility, is an open question.
5. Contemporary implications
Some researchers argue that Easter Island is just one of several examples of societal collapse precipitated by over-exploitation of natural
re-sources.18 As noted by Weiskel (1989, p. 104),
these societies evolved along a similar pattern of
18Other examples include the Akkadian and the Sumerian
cultures of Mesopotamia, the Anasazi culture of North Amer-ica, the Maya culture of South AmerAmer-ica, and the ancient Indus Valley societies. See Tainter (1988), Ponting (1991) and Kohler (1996).
17In panel B of Fig. 4 and Panel A of Fig. 5, the plot of
Reu
6
eny
,
C
.
S
.
Decker
/
Ecological
Economics
35
(2000)
271
–
287
283
Table 2
Welfare analysis-effect on social utility from technological growth in model parameters
Carrying capacity Harvesting efficiency Fertility rate Combinations Base case Intrinsic growth rate
(static
Exponential Log Exponential Fast Moderate Slow Fertility and
Log Fertility and
Exponential
technology) Log Fertility and
harvesting
carrying intrinsic growth rate capacity efficiency
0.1810 0.1621 0.1695 0.1362 0.0152 0.0801 0.2059 0.0800 0.0528 0.1031 Mean 0.1810 0.1892 0.1883
0.0838 0.0284 0.0491 0.0503 0.0587 0.0116 0.0588
0.0248 0.0573
0.0197 0.0414
Standard 0.0246 0.0216 deviation
‘‘gradual emergence, brief flowering, and rapid collapse of civilization, often taking the form in the final stages of devastating military struggles over the control of arable land or essential re-sources.’’ Some scholars believe that the environ-mental constraints faced by those societies pose similar risks to contemporary societies, particu-larly in LDCs, where there are relatively high rates of population growth and great economic dependencies on renewable resources. Our results generally show that technological progress in the resource sector would have had limited ability to prevent Easter Island’s population and resource fluctuations. These results may have implications for LDCs, but one should consider them cau-tiously. After all, our model does not take into account the potentially mitigating effects that capital accumulation, technological progress in the manufacturing sector, property rights re-forms, demographic transition, foreign aid, and
trade might have on resource dependent
economies. While these effects may not have ap-plied to Easter Island, they could be more signifi-cant in LDCs.
People in LDCs generally depend more on the natural environment for their livelihoods than do people in developing countries (DCs). The accumulation of capital, the build-up of sizeable non-resource based sectors, and the implementa-tion of technological progress in these sectors might alleviate some of the pressures that LDCs place on the resource base. However, these are costly and lengthy processes. In this respect, the population cycles in our simulations may not be an outlandish possibility for LDCs in the future.
As a general rule, property rights institutions are currently defined and enforced less rigorously in LDCs than in DCs. It is also likely that Easter Island’s society did not develop efficient property rights institutions. This does not mean that efficient property right institutions could not arise in LDCs in the future. Ostrom (1990) ob-serves empirical cases in which such institutions
arose endogenously in low-income societies.
However, she also describes cases where they did not develop at all. Hence, the endogenous emer-gence of efficient property rights institutions in LDCs cannot be taken for granted, and may
require exogenous intervention from DCs or in-ternational organizations.19
The model assumes that fertility rises with per capita income. While this assumption is used in several models, it does not allow for the possibil-ity of demographic transition during the process of development. The theory of demographic transition argues that for states with low per capita incomes fertility rises with income, but as per capita income increases above a given threshold (typically a $1000), fertility declines (Heerink, 1994). This interpretation is not with-out critics, but is accepted by most
demogra-phers and economists.20
Demographic transition implies that yet another way to mitigate pres-sures on renewable resources in LDCs is to ac-celerate their economic growth. However, this approach may also entail a cost. Accelerated eco-nomic growth may well increase pressure on the environment in the form of pollution, resource
depletion, global warming or deforestation.
Moreover, a situation with current DCs’ per cap-ita income applied to all countries is probably not sustainable (e.g., see Daly, 1992).
The model also assumes a closed economic system without foreign aid and trade, but of course, LDCs are not closed economies. Re-source scarcities may be alleviated by foreign aid. Nevertheless, we believe the insights gained from understanding the underlying tendencies of the system without foreign aid are important, as they could assist in preventing environmental col-lapses that require such aid in the first place. As for trade, its effect on the social welfare of a natural resource-dependent economy is not clear. Consider a two-sector economy that has a com-parative advantage in its natural resource sector. As shown by Brander and Taylor (1995) and others, trade will induce more resource harvest-ing. Over time, the resource is overexploited and social welfare declines relative to autarky. On the
19Fernandez and Rodrik (1991) argue that institutions
might not emerge when the distribution of benefits they may create is not clear to the actors involved.
20Abernethy (1993) criticizes the theory of demographic
other hand, if the economy has a comparative advantage in its non-resource based sector, trade prompts allocation of more labor to this sector, reducing natural resource harvesting. In this case, social welfare rises relative to autarky.
The discussion has, thus, far omitted the possi-bility of violent conflict over depleting resources. Malthus (1798) predicted that since population grows faster than food supplies, disease, starva-tion and violent conflict will eventually increase. These forces will provide a check on population size, resulting in fluctuations in population and resources. The typical argument made against this prediction is that it does not consider the mitigat-ing effect of technological progress.
Much in the spirit of Malthus, our simulation results demonstrate that per capita utility and the stocks of the resource and population fluctuate widely over time, despite the presence of techno-logical progress. It makes sense to assume that when per capita utility falls below a given threshold, people may resort to conflict in order to increase their own consumption. Such periods may also represent famines and disease. Periods when the resource is diminishing rapidly may represent resource destruction due to conflict. However, these are not the only Malthusian im-plications of this paper. Violent conflict, disease, and famines may also limit the physical and men-tal capabilities of the population, thus reducing its ability to generate technological progress. This point, however, is controversial. For example, Boserup (1981) and Simon (1996) argue that since necessity is the mother of invention, these same adverse forces will generate more innovation.
It is interesting to note that during its decline, Easter Island did experience increased violence
(Keegan, 1993).21 To what extent are these
dis-rupting and violent political forces with us today? Myers (1993), Homer-Dixon (1994) and others present supporting evidence that environmental decay may well give rise to violent conflict in LDCs. Moreover, a 1998 report of the World Watch Institute in Washington, DC finds that
current population levels in Africa are lower than the levels predicted a few years ago. In line with our discussion, the report attributes the lower observed population levels to environmental degradation, increases in disease (e.g. AIDS), and violent conflict.22
6. Conclusion
We have investigated the interaction between renewable resources and population assuming hy-pothetical technological progress and population management on Easter Island. In the majority of our simulations, the population and the resource fluctuated widely over time; technological pro-gress would not necessarily have generated a ‘golden path’ of economic growth on Easter Is-land. Institutional reform in the form of fertility management had a positive effect on the system, allowing for relatively smooth population and resource trajectories. A constantly growing per capita utility was not observed in any of the simulations. We did not investigate whether a different parameterization of the model would allow for constantly growing per capita utility. It may be that allowing for demographic transition would permit continuous growth in welfare to occur. However, we defer this interesting question to future research.23
Our results suggest that policies designed to alleviate the Malthusian predicament must deal with certain fundamental questions. Should soci-ety attempt to increase social welfare even if it results in wider social welfare fluctuations over time? Should society encourage social welfare sta-bility even if it means lower levels of welfare? Should society promote high social welfare at the
22In principle, such conflicts could also occur in DCs.
Choucri and North (1975), for example, argue that World War I was largely the result of a competition over natural resources in colonial areas due to an increasing European population. The competition induced arms races and the system became unstable. Recall also the fish wars between DCs since the 1970s (e.g. Iceland – UK, Spain – Canada).
23We wish to thank an anonymous reviewer for this
sugges-tion.
21This statement also applies, to varying degrees, to other
expense of a larger population? We believe it is reasonable to support policies that minimize pop-ulation fluctuations while attempting to keep more people in the system, even at the expense of having lower per capita utility. However, as with other normative choices, this goal is subjec-tive.
Since we have employed a relatively simple model, there are several ways in which the analy-sis could be developed further. Future research may make agents forward-looking. It is not clear how the dynamics would be altered in this case. Demographic transition might also be incorpo-rated into the model. However, we believe the assumption that below a given renewable re-source stock fertility decreases with rere-source de-pletion, regardless of per capita income, should be maintained. Another avenue of future research involves Monte Carlo simulations whereby one draws parameter values from assumed distribu-tions. Similarly, one could try other technological trajectories, as well as lengthen the time horizon for the simulations to learn more about the mod-el’s dynamics.24 Finally, it would be worthwhile
to endogenize technological progress. For in-stance, one could make progress a function of population growth or, alternatively, a function of resource scarcity.
At the end of the day, we would like to revisit the following question — to what extent are the simulation results applicable to contemporary LDCs? Given the model’s simplicity, we need to be careful. While the model’s base case replicates what is understood to have happened on Easter Island, there is clearly some distance between even the poorest LDC and Easter Island. At the same time, we agree with those scholars who argue that the Easter Island case is important. Technological progress is often viewed as the main engine of sustainable development, assuring ever-increasing welfare over time. This view is not supported here. Whether contemporary societies evolve along paths similar to those presented here also depends on their choices. However, we be-lieve the Easter Island story does serve as a clear
warning of what the future might hold should nations choose policies similar to those chosen on ‘our’ Easter Island.
References
Abernethy, V.D., 1993. Population Politics: The Choices That Shape Our Future. Plenum Press, New York, p. 350. Aghion, P., Howitt, P., 1998. Endogenous Growth Theory.
MIT Press, Cambridge, MA, p. 694.
Arrow, K., 1950. A difficulty in the concept of social welfare. J. Political Econ. 58, 328 – 346.
Boserup, E., 1981. Population and Technological Change: A Study of Long Term Trends. Chicago University Press, Chicago, p. 255.
Brander, J.A., Taylor, M.S., 1995. International Trade and Open Access Renewable Resources: The Small Economy Case. NBER Working Paper Series, 5021, Cambridge, MA.
Brander, J.A., Taylor, M.S., 1998. The simple economics of Easter Island: a Ricardo – Malthus model of renewable resource use. Am. Econ. Rev. 88, 119 – 138.
Brown, L.R., Flavin, C., 1999. A new economy for a new century. In: Brown, L., Flavin, C., French, H. (Eds.), State of the World. W.W. Norton, New York, pp. 3 – 21. Choucri, N., North, R.C., 1975. Nations in Conflict: National
Growth and International Violence. Freeman, San Fran-cisco, p. 356.
Clark, C.W., 1990. Mathematical Bioeconomics: The Optimal Management of Renewable Resources. Wiley, New York, p. 386.
Daly, H.E., 1992. Steady State Economics. Earthscan Publica-tions, London, p. 302.
Daly, H.E., 1997. The contribution of Nicholas Georgescu-Roegen. Ecol. Econ. 22, 261 – 266.
Dilworth, C., 1994. Two perspectives on sustainable develop-ment. Population Environ. 15, 441 – 467.
Fernandez, R., Rodrik, D., 1991. Resistance to reform: status quo bias in the presence of individual-specific uncertainty. Am. Econ. Rev. 81, 1146 – 1155.
Georgescu-Roegen, N., 1971. The Entropy Law and the Eco-nomic Process. Harvard University Press, Cambridge, MA, p. 457.
Heerink, N., 1994. Population Growth, Income Distribution, and Economic Development. Springer, Berlin, p. 401. Homer-Dixon, F.T., 1994. Environmental scarcities and
vio-lent conflict: evidence from cases. Int. Security 19, 76 – 116. Hughes, B.B., 1999. International Futures. Westview Press,
Boulder, CO, p. 215.
Jones, C.I., 1998. Introduction to Economic Growth. W.W. Norton, London, p. 200.
Keegan, J., 1993. A History of Warfare. Knopf, New York, p. 432.
Keynes, J.M., 1933. Essays in Biography. Macmillan, London, p. 318.
24We wish to thank an anonymous reviewer for these two
Kohler, T., 1996. Agent-Based Modeling of Anasazi Village Formation in the Northern American Southwest. Working Paper, Santa Fe Institute. www.santafe.edu.
Kremer, M., 1993. Population growth and technological change: one million B.C. to 1990. Q. J. Econ. 108, 681 – 716.
Lane, J.S., 1975. A synthesis of the Ramsey-Meade problems when population change is endogenous. Rev. Econ. Studies 42, 57 – 66.
Malthus, T., 1798. An Essay on the Principle of Population. Penguin, New York, p. 291 (1970 edition).
Meadows, D.H., Meadows, D.L., Randers, J., Behrens, W.W. Jr, 1972. The Limits to Growth: A Report for the Club of Rome’s Project on the Predicament of Mankind. Universe Books, New York, p. 205.
Milik, A., Prskawetz, A., 1996. Slow – fast dynamics in a model of population growth. Math. Population Studies 6, 155 – 169.
Myers, N., 1993. Ultimate Security: The Environmental Basis of Political Stability. W.W. Norton, New York, p. 308. Nicholson, W., 1998. Microeconomic Theory: Basic Principles
and Extensions. The Dryden Press, Fort Worth, TX, p. 821.
Ostrom, E., 1990. Governing the Commons: The Evolution of Institutions for Collective Action. Cambridge University Press, Cambridge, p. 280.
Pack, H., 1994. Endogenous growth theory: intellectual appeal and empirical shortcomings. J. Econ. Perspect. 8, 55 – 72. Perman, R., Ma, Y., McGilvray, J., 1996. Natural Resource
and Environmental Economics. Longman, London, p. 396. Ponting, C., 1991. A Green History of the World: The
Envi-ronment and the Collapse of Great Civilizations. Penguin, New York, p. 430.
Prskawetz, A., Feichtinger, G., Wirl, F., 1994. Endogenous population growth and the exploitation of renewable re-sources. Math. Population Studies 5 (1), 87 – 106. Sato, R., Davis, E.G., 1971. Optimal saving policy when labor
grows endogenously. Econometrica 39, 877 – 898. Schaefer, M.B., 1957. Some considerations of population
dy-namics and economics in relation to the management of marine fisheries. J. Fisheries Res. Board Can. 14, 669 – 681. Simon, J., 1996. The Ultimate Resource 2. Princeton
Univer-sity Press, Princeton, NJ, p. 734.
Solow, R.M., 1956. A contribution to the theory of economic growth. Q. J. Econ. 70, 65 – 94.
Solow, R.M., 1994. Perspectives on growth theory. J. Econ. Perspect. 8, 45 – 54.
Solow, R.M., 1997. Georgescu-Roegen versus Solow/Stiglitz: reply. Ecol. Econ. 22, 267 – 268.
Stiglitz, J.E., 1997. Georgescu-Roegen versus Solow/Stiglitz: reply. Ecol. Econ. 22, 269 – 270.
Tainter, J., 1988. The Collapse of Complex Societies. Cam-bridge University Press, CamCam-bridge, p. 250.
Toman, M.A., Pezzey, J., Krautkraemer, J., 1995. Neoclassical economic growth theory and sustainability. In: Bromley, D.W. (Ed.), The Handbook of Environmental Economics. Blackwell, Cambridge, MA, pp. 139 – 165.
Van Tilberg, J.A., 1994. Easter Island: Archeology, Ecology and Culture. British Museum Press, London, p. 191. Weiskel, T., 1989. Lessons of the past: an anthropology of
environmental decline. The Ecologist 19, 104 – 119.