Economics of Education Review 20 (2001) 151–163
www.elsevier.com/locate/econedurev
Transfer from two-year to four-year college: an analysis of
gender differences
Brian J. Surette
*Federal Reserve Board, 20th & C Streets, NW, Mail Stop 153, Washington, DC 20551, USA
Received 10 June 1998; received in revised form 15 January 1999; accepted 30 August 1999
Abstract
Nearly one-third of all students who attend a two-year college transfer to a four-year college by the time they turn 25. This paper demonstrates that women are less likely than men to transfer, and that women who do transfer are less likely to earn a bachelor’s degree. Given the large wage returns to each year of college, and the large sheepskin value of a bachelor’s degree, the lower propensity by women to transfer may reduce their subsequent earnings. This paper tests several plausible explanations for the transfer rate difference. Most notably, marital status, the presence of children, and gender differences in occupational preferences do not fully explain women’s lower transfer rates. Despite controlling for these and other factors, women remain less likely than men to transfer from a two-year to a four-year college. 2001 Elsevier Science Ltd. All rights reserved.
JEL classification: I21; J24
Keywords: Two-year college; Transfer; Community college; Return to college; Human capital
1. Introduction
Nearly one-third of all students who attend a two-year college transfer to a four-year college by the time they turn 25. This paper demonstrates that women are less likely than men to transfer, and that women who do transfer are less likely to earn a bachelor’s degree. Given the large wage returns to each year of college, and the large sheepskin value of a bachelor’s degree, the lower propensity by women to transfer may reduce their sub-sequent earnings. This paper tests several plausible explanations for the transfer rate difference. Most notably, marital status, the presence of children, and gen-der differences in occupational preferences do not fully explain women’s lower transfer rates. Despite con-trolling for these and other factors, women remain less
* Tel.:+1-202-452-2442; fax:+1-202-452-5295.
E-mail address: bsurette@frb.gov (B.J. Surette).
0272-7757/01/$ - see front matter2001 Elsevier Science Ltd. All rights reserved. PII: S 0 2 7 2 - 7 7 5 7 ( 0 0 ) 0 0 0 1 3 - 3
likely than men to transfer from a two-year to a four-year college.
Much of the recent literature relating to two- and four-year college attendance has focused on whether the emergence of two-year colleges as major players in higher education has had a positive or negative effect on overall education levels among young adults (Breneman & Nelson, 1981; Brint & Karabel, 1989; Grubb, 1989a; Rouse, 1995). This literature is inconclus-ive about two-year colleges’ effects on educational attainment.
colleges to which transfers are accepted. Rouse (1995) examines the effect of starting at a two-year college on total years of college completed and the probability of completing a bachelor’s degree. The decision to transfer is not examined. Finally, Grubb (1989a) examined indirectly the decision to transfer from a two-year to a four-year college using aggregate (state-level) data. His results suggest that women are less likely to transfer, though data limitations prevent him from directly exam-ining that phenomenon.
This paper models attendance at both two-year and four-year colleges, as well as the decision to transfer from a two-year to a four-year college, using a 12-year panel from the National Longitudinal Survey of Youth (NLSY). These data allow the direct examination of the decision to transfer and provides an understanding of which factors play a major role in that decision. The main conclusion from this paper is that, despite the large number of economic and demographic variables used to control for differences in college attendance decisions, women are less likely than men to transfer.
2. Descriptive results
The data for this study are drawn from the 1979 through 1990 waves of the NLSY. To ensure that all post-secondary education decisions during this period are observed, individuals who turned 18 prior to 1979 are excluded.1Only high school graduates are retained. The final data set contains 2413 women and 2349 men. For this analysis, successive waves of data are retained for each individual.2 The final data contain 20,432 female and 18,832 male person-years. Mean characteristics for
1 Individuals with extreme values for the variables of inter-est, or those with obviously inconsistent data, were dropped. The military sample and the poor white samples are also excluded because membership in these groups is based at least in part on individual and family decisions that may be related to the outcomes examined in this paper. The model retains the over-samples of black and Hispanic individuals, which are sim-ply additional members of these demographic groups, drawn randomly.
2 Prior to the first missed interview missing data were imputed—primarily by examining individuals’ responses to rel-evant survey questions over several years. For cases in which this did not provide the necessary information, predicted values from multivariate models or group means replaced missing values. Only a small fraction of any one variable was imputed based on predictions or group means. Collectively, imputation allows the retention of a great deal of non-imputed information that would otherwise be discarded.
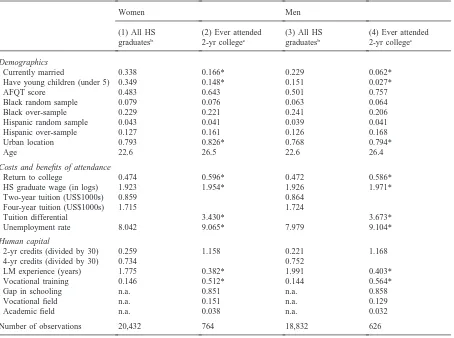
this sample are presented in Table 1. Definitions of the variables are provided in Appendix A.
The college attendance and accumulated credit vari-ables discussed here were derived from FICE3codes and self-reported credit histories provided by each college student in the Geocode version of the NLSY. FICE codes were matched to US Department of Education (hereafter “Education Department”) data on the highest degree offered at each school. Two-year colleges are defined as those offering an associate’s degree as their highest degree. Schools offering bachelor’s or graduate degrees are defined to be four-year colleges.4The use of FICE codes facilitates a consistent definition of college type for each person; misreporting of college type is reduced or eliminated.
College attendance is defined in this study by whether or not an individual enrolled in and completed credits at each type of college in each calendar year.5Attendance rates at two-year and four-year colleges are presented by age in Table 2. The table shows that women are more likely than men to attend two-year college during the prime college-going ages (18–22).6It is well known that since the 1960s, women’s overall college attendance rates have increased dramatically and have now over-taken men’s college attendance rates.7These data indi-cate that the attendance gender gap favoring women reflects higher two-year attendance.
This paper defines a “transfer” as any student who attends four-year college concurrent with or subsequent
3 Federal Interagency Committee on Education (FICE) codes are unique identifiers for each accredited college or university in the United States.
4 Schools that offer only a vocational certificate are not treated as colleges in this paper. Rather, credits earned at vocational institutes are included in the analysis as part of the formal vocational training programs.
5 It would have been interesting to identify individuals who attended college but did not complete any credits. Owing to the complexity of tracking individuals and college types over a 12-year panel, it was simply not feasible with these data to do so. Such individuals are treated as having never attended.
6 The 1996 Digest of education statistics (United States Department of Education, 1996) reports college enrollment rates for the early 1980s higher than those reported in Table 2. Two factors may explain this difference. First, my data include the NLSY’s black and Hispanic over-samples; these groups have lower college attendance rates than the population as a whole. Excluding them raises attendance rates by a few percent-age points. A second cause is definitional. Students in my data must complete credits to be counted as having attended college. The Education Department defines attendance by enrollment status as of October 1. Students who drop out after October 1, but before completing any credits, are not counted in my defi-nition of attendance, but are in the Education Department’s definition.
153 B.J. Surette / Economics of Education Review 20 (2001) 151–163
Table 1
Descriptive characteristic of the sample, by gendera
Women Men
(1) All HS (2) Ever attended (3) All HS (4) Ever attended graduatesb 2-yr collegec graduatesb 2-yr collegec
Demographics
Currently married 0.338 0.166* 0.229 0.062*
Have young children (under 5) 0.349 0.148* 0.151 0.027*
AFQT score 0.483 0.643 0.501 0.757
Black random sample 0.079 0.076 0.063 0.064
Black over-sample 0.229 0.221 0.241 0.206
Hispanic random sample 0.043 0.041 0.039 0.041
Hispanic over-sample 0.127 0.161 0.126 0.168
Urban location 0.793 0.826* 0.768 0.794*
Age 22.6 26.5 22.6 26.4
Costs and benefits of attendance
Return to college 0.474 0.596* 0.472 0.586*
HS graduate wage (in logs) 1.923 1.954* 1.926 1.971*
Two-year tuition (US$1000s) 0.859 0.864
Four-year tuition (US$1000s) 1.715 1.724
Tuition differential 3.430* 3.673*
Unemployment rate 8.042 9.065* 7.979 9.104*
Human capital
2-yr credits (divided by 30) 0.259 1.158 0.221 1.168
4-yr credits (divided by 30) 0.734 0.752
LM experience (years) 1.775 0.382* 1.991 0.403*
Vocational training 0.146 0.512* 0.144 0.564*
Gap in schooling n.a. 0.851 n.a. 0.858
Vocational field n.a. 0.151 n.a. 0.129
Academic field n.a. 0.038 n.a. 0.032
Number of observations 20,432 764 18,832 626
a Definitions of variables are provided in Appendix A.
b Includes multiple observations of individuals observed in more than one of the 12 years examined.
c Includes individuals only in the last year they are observed during the 12-year panel. Variables that can change with time are set to their value at age 20 and are designated with an asterisk for use in the transfer model.
to two-year attendance.8 In other words, if a student attends two-year college at age 19 and attends a four-year college at age 20, she is considered to be a transfer from age 20 onward for descriptive purposes. Table 2 shows cumulative transfer rates by age and demonstrates that men are about 5 percentage points more likely to
8 Concurrent spells need to be included as transfers because I cannot separately identify spring, summer, or fall attendance for a particular calendar year. This is due to high rates of miss-ing data for enrollment dates, especially the month of enrollment.
transfer than women.9This difference is statistically sig-nificant.10
These figures demonstrate two potentially contradic-tory facts about women’s and men’s college attendance patterns: women are more likely than men to attend
Table 2
College attendance rates among high school graduates
Age Two-year attendance rates (%) Four-year attendance rates (%) Cumulative transfer probability (%)
Women Men Women Men Women Men
18 14.0 12.1 29.3 28.7
19 17.8 14.2 28.9 28.3 8.6 7.6
20 17.5 14.4 29.1 28.1 20.8 21.3
21 12.2 10.7 26.5 27.3 29.1 31.8
22 8.8 6.4 23.4 25.7 33.1 39.1
23 4.7 5.2 14.0 17.7 33.1 37.7
24 3.2 3.7 7.0 9.7 30.1 36.8
25 3.8 2.8 5.0 5.2 29.6 34.3
P-values: two-tailed test 0.007a 0.768a 0.012b
of no gender difference
Source: Author’s calculations from the 1979–1990 NLSY.
a P-value for two- and four-year attendance calculated over ages 18 through 23.
b P-value for cumulative transfer probability calculated for individuals older than 20 in the last year they are observed in the data.
year college but are less likely to transfer. This suggests that women and men may have different reasons for attending college, and the same reasons that cause women to attend two-year college at higher rates than men may also explain why they transfer less often. Two of the most obvious potential explanations for these pat-terns are differing domestic responsibilities and occu-pational ambitions. The model presented in the next sec-tion uses a human capital framework to sort through these and several other plausible explanations for the transfer rate difference.
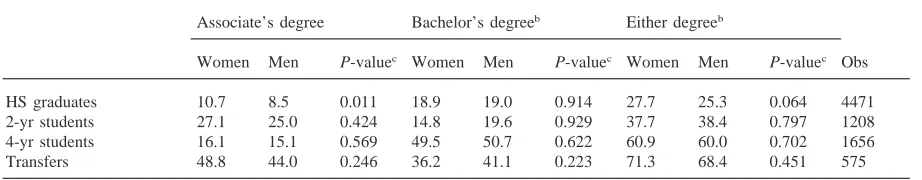
Table 3 shows that the lower transfer probabilities observed for women may affect overall education levels. It presents degree completion rates for the oldest cohorts in my sample (age 21 to 29) in the last year they are observed. Among all high school graduates (row 1), women have a higher probability of completing an
Table 3
Degree completion rates (%) among HS graduates aged 21+yearsa
Associate’s degree Bachelor’s degreeb Either degreeb
Women Men P-valuec Women Men P-valuec Women Men P-valuec Obs
HS graduates 10.7 8.5 0.011 18.9 19.0 0.914 27.7 25.3 0.064 4471
2-yr students 27.1 25.0 0.424 14.8 19.6 0.929 37.7 38.4 0.797 1208
4-yr students 16.1 15.1 0.569 49.5 50.7 0.622 60.9 60.0 0.702 1656
Transfers 48.8 44.0 0.246 36.2 41.1 0.223 71.3 68.4 0.451 575
Source: Author’s calculations from the 1979–90 NLSY.
a Includes high school graduates who never attended college. Only uses observation from the last year that an individual is observed in the data.
b Includes individuals who attended both 2-year and 4-year college. c P-values are for two-tailed test of no gender difference in means.
155 B.J. Surette / Economics of Education Review 20 (2001) 151–163
modest: it documents the fact that women differ from men in their college attendance and transfer decisions and attempts to discover what factors can (and cannot) explain these differences.
3. A bit of economic theory
The decision to transfer is the result of a two-step pro-cess: the decision to attend two-year college initially, and the subsequent decision to attend a four-year college. This paper focuses on what causes women and men to differ at the second step. Properly addressing this ques-tion, however, also requires an examination of whether (and how) women and men differ at the first step. Thus, the first part of this section models the decision to attend both types of college among all high school graduates. The dependent variables are whether or not an individual attended two-year college and whether or not an individ-ual attended four-year college in each year. The second part of this section models the decision to transfer. “Transfer” is defined by whether or not an individual who attended a two-year college ever subsequently attends a four-year college.
3.1. The attendance models
The standard human capital model teaches that college attendance decisions depend primarily on whether the discounted value of the premium college-educated work-ers earn (compared to high school graduates) exceeds the costs of attendance. The model must therefore include direct costs of college such as two-year and four-year tuition, opportunity costs such as foregone earnings, and the wage premium college-educated workers earn. Attendance decisions will also be driven by demographic and other characteristics that reflect preferences or econ-omic circumstances, such as marital status, having young children, and accumulated human capital. The attendance model is estimated on the entire panel of high school graduates who have not completed a bachelor’s degree.11 The first and third columns in Table 1 summarize the set of variables used to model the decision to attend each type of college.
So what can explain women’s higher two-year attend-ance rates and lower transfer rates? We postulate first that women are more likely to select two-year colleges for practical reasons related to their child-rearing responsibilities, marital status, and economic
circum-11 Individuals can attend college in multiple years, and the panel nature of this model reflects that. Standard errors are cal-culated using the Huber–White method to avoid overstating the model’s predictive power. Once an individual completes a bach-elor’s degree she is excluded from the models.
stances, and that such factors explain both their higher two-year attendance rates and their lower transfer rates. Two-year colleges generally offer more flexible class schedules and lower costs than four-year colleges. As women tend to bear a disproportionate share of home-maker and child-rearing responsibilities, two-year col-leges may appeal more to married women or mothers than to men. We therefore expect being married and hav-ing young children to reduce college attendance more for women than for men, and for these two variables to have larger negative effects on four-year than on two-year attendance. Gender differences in the monetary costs and benefits of attendance could also explain differences in attendance patterns. If true, we expect women to be more sensitive than men to tuition, opportunity costs, and the college wage premium.
The geographic proximity of college may be another practical determinant of attendance. Rouse (1995), for example, finds a negative correlation between attendance and distance to the nearest two- and four-year college. If the effects of proximity on transferring differ by gen-der—for example, if women are less likely to have access to transportation—the female coefficients may capture these effects in the estimated models. Unfortu-nately, the NLSY does not contain high-quality infor-mation on proximity to college. However, the data do contain information about whether each individual lives in a predominantly urban county. Moreover, colleges tend to be located in or near urban areas. Our urban indi-cator may therefore serve as a proxy for proximity to college.12If proximity explains the observed gender dif-ferences in attendance patterns, one expects living in an urban area to have a larger, positive effect on women’s than men’s attendance decisions.
Another explanation advanced for women’s lower transfer rates is that at the margin women who attend college are of lower ability than men, with the most mar-ginal attending (and remaining at) two-year colleges. This explanation is suggested by the fact that a larger percentage of female high school graduates attend col-lege: if the distributions of educational ability of high school graduates are the same across gender, the mar-ginal women may be of lower educational ability than their male counterparts. We control for student ability and intelligence using the Armed Forces Qualification Test (AFQT) score, a measure like IQ. If more marginal women attend two-year college than men, we expect the effects of the AFQT on attendance to be smaller for women than for men.
A final plausible explanation for women’s higher two-year attendance rates and lower transfer rates is that women simply prefer two-year colleges to four-year col-leges for reasons that are not directly observable. For example, it is well known that women and men tend to end up in different occupations. If the female-dominated occupations require training at two-year colleges, and the male-dominated occupations require training at four-year colleges, one might expect women and men to make dif-ferent schooling decisions. We would like to control for such preferences to test this explanation, but we cannot directly observe them. However, one may be able to infer them based on post-schooling occupational outcomes. We estimate the attendance model both with and without proxies for these preferences. Specifically, we model schooling decisions using indicator variables for whether or not an individual ever works in several specific female-dominated occupations.13
3.2. The transfer model
The attendance model provides partial information about whether (and why) women and men differ in their college attendance patterns and their rates of transfer to four-year college. This section models the decision to transfer directly. We define “transfers” as individuals who have attended two-year college at some point in their lives and have subsequently attended a four-year college. Only the last observation of each individual is used in this model: for an individual observed in all 12 waves of the NLSY, she is a “transfer” if she attended a two-year college and subsequently attended a four-year college at some point prior to 1990.
The transfer model is based on the same human capital theory that motivates the attendance model. The main distinction is that the transfer model describes a decision about subsequent schooling, conditional on having pre-viously chosen to attend two-year college. High school graduates who never attend college, and students who attend only four-year college, are not included in this part of the analysis.
The non-transfers consist of three groups: those who continue to attend two-year college, those who complete an associate’s degree, and those who leave school. Because all these individuals could subsequently enroll in a four-year college at some point, it would be inappro-priate to exclude any of them from the analysis. The model treats them as potential transfers, but includes a
13 As the inclusion of post-schooling outcomes in schooling decisions poses problems for interpreting causality, we present models that exclude occupational indicators. The discussion in Section 4.1 outlines the main differences between the attend-ance models with and without these variables.
variable to identify individuals who have a gap in their schooling history of more than one year.14
The explanatory variables used to describe whether an individual transfers are very similar to those used in the attendance model. Exceptions are that broad field of study is incorporated and the explanatory variables that can vary with time are set to their values as of age 20. The inclusion of field of study addresses one of the limi-tations of the attendance model. Expeclimi-tations for vari-ables included in both the attendance and transfer mod-els, where different from the expectations outlined above, are noted in the discussion of the results.
4. Multivariate results
This study uses univariate probits to describe college attendance decisions and the decision among two-year college students to transfer to a four-year college.15The results are expressed as Probit derivatives for ease of exposition and interpretation.16 Estimation results from the attendance models are reported in Table 4.17Table 5 presents the results of the transfer models.
4.1. Two- and four-year college attendance models
We initially argued that women choose two-year over four-year attendance as a result of practical consider-ations—such as family responsibilities—and that such considerations might also explain why women transfer at lower rates than men. The results from the attendance models partially bear out this expectation. The
gender-14 Leigh & Gill (1997) report that individuals who leave school and then return still earn a wage premium on their initial college credits. This indicates that the value of college credits does not depreciate fully over even several years.
15 Other researchers have used multinomial logit to examine the decision to attend different types of post-secondary insti-tutions (Manski & Wise, 1983; Ordovensky, 1995; Hilmer, 1997). It seems likely that for the questions addressed in this paper, the “independence of irrelevant alternatives” (IIA) con-dition required for that method would not be satisfied.
16 Probit derivatives are simply the change in the probability of an outcome caused by a change in one of the explanatory variables. For y=F(xB), the Probit derivative is calculated y9=f(xb)b, where b is the estimate of B. The probabilities are
calculated at the x-variable means.
157
B.J.
Surette
/
Economics
of
Education
Review
20
(2001)
151–163
Table 4
Probit models of two-year and four-year college attendance (probability derivatives listed, Huber–White t-scores in parentheses)a
Two-year attendanceb Four-year attendanceb
(1) Pooled (2) Women (3) Men (4) Pooled (5) Women (6) Men
Demographics
Female 1.19 (4.03) 0.64 (1.89)
Married 22.11 (5.33) 22.65 (5.15) 21.34 (2.10) 24.45 (9.11) 25.92 (9.30) 22.62 (3.47) Young kids 22.50 (5.87) 22.97 (5.46) 22.03 (2.63) -2.51 (4.07) 24.08 (5.33) 0.25 (0.22) AFQT score 0.83 (8.36) 0.85 (5.66) 0.75 (5.86) 2.48 (20.46) 2.59 (14.09) 2.17 (14.83) Black cross 1.51 (2.33) 1.37 (1.51) 1.71 (1.89) 4.30 (4.72) 4.87 (3.95) 3.77 (2.94) Hispanic cross 1.89 (2.16) 1.41 (1.13) 2.43 (2.05) 4.15 (3.46) 6.06 (3.37) 2.16 (1.52) Black over-sample 0.94 (1.98) 1.63 (2.33) 0.16 (0.26) 4.00 (7.17) 4.45 (5.19) 3.52 (5.25) Hispanic over-sample 2.32 (4.36) 1.94 (2.62) 2.63 (3.60) 1.73 (2.68) 0.89 (0.93) 2.29 (2.73) Parents education included included included included included included Urban location 1.98 (6.05) 2.02 (4.14) 1.95 (4.55) 0.37 (0.99) 0.60 (1.08) 0.30 (0.66) Age 13.70(10.27) 15.99 (8.49) 11.33 (6.10) 11.25 (7.36) 9.77 (4.79) 12.98 (6.12) Age squared 215.63(10.84) 217.86 (8.68) 213.26 (6.67) 215.53 (9.04) 213.70 (5.98) 217.28 (7.24) Age cubed 5.34 (10.91) 5.96 (8.51) 4.66 (6.96) 5.88 (9.70) 5.25 (6.53) 6.41 (7.60) Time trend 0.00 (0.32) 0.05 (0.33) 20.02 (0.12) 20.17 (1.34) 0.27 (1.40) 20.11 (0.67)
Costs and benefits
College wage premium 3.60 (2.64) 3.46 (1.79) 3.78 (2.05) 24.33 (2.87) 21.08 (0.48) 27.35 (3.83) HS graduate wage 4.23 (2.41) 1.71 (0.64) 6.07 (2.68) 24.27 (2.24) 24.96 (1.59) 23.46 (1.64) Two-year tuition 23.02 (6.39) 23.45 (5.22) 22.68 (4.09) 2.06 (3.54) 2.26 (2.65) 1.60 (2.19) Four-year tuition 20.93 (2.45) 21.00 (1.87) 20.76 (1.47) 21.27 (2.85) 21.68 (2.56) 0.78 (1.42) Unemployment rate 0.22 (5.12) 0.19 (3.04) 0.25 (4.43) 0.16 (3.20) 0.21 (2.87) 0.13 (2.04)
Human capital
2-yr credits 4.38 (21.49) 4.22 (14.46) 4.44 (18.96) 1.44 (3.94) 0.52 (1.07) 2.12 (4.25) 4-yr credits 25.37 (10.85) 26.46 (9.93) 24.06 (5.62) 15.36 (29.82) 14.95 (19.09) 14.55 (23.79) 4-yr credits2 0.59 (6.15) 0.81 (7.30) 0.28 (1.74) 22.43 (18.14) 22.37 (11.32) 22.30 (14.92)
AA degree n.a. n.a. n.a. 0.43 (0.48) 20.18 (0.15) 1.80 (1.43)
Experience 20.94 (7.22) 20.97 (5.21) 20.98 (5.60) 22.14 (9.06) 21.78 (5.29) 22.46 (8.44) Vocational training 20.39 (0.73) 20.88 (1.23) 0.03 (0.04) 21.33 (1.67) 21.72 (1.61) 21.07 (1.13) Mean (S.E.) of dep. var. 0.086 (0.280) 0.092 (0.288) 0.080 (0.270) 0.184 (0.387) 0.179 (0.382) 0.185 (0.388)
Sample size 36,223 18,798 17,425 36,223 18,798 17,425
Pseudo-R2 0.1719 0.1809 0.1682 0.4520 0.4434 0.4700
a Standard errors are calculated using the Huber (1967) and White (1980) method to account for multiple observations of individuals.
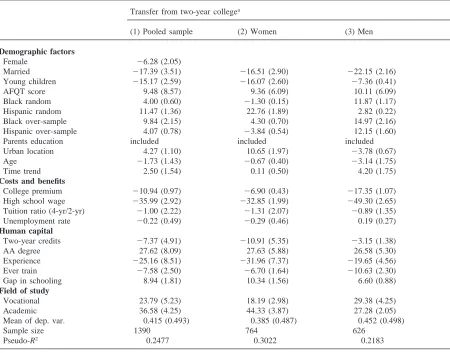
Table 5
Probit transfer models (Probability derivatives listed, t-scores in parentheses)
Transfer from two-year collegea
(1) Pooled sample (2) Women (3) Men
Demographic factors
Female 26.28 (2.05)
Married 217.39 (3.51) 216.51 (2.90) 222.15 (2.16)
Young children 215.17 (2.59) 216.07 (2.60) 27.36 (0.41)
AFQT score 9.48 (8.57) 9.36 (6.09) 10.11 (6.09)
Black random 4.00 (0.60) 21.30 (0.15) 11.87 (1.17)
Hispanic random 11.47 (1.36) 22.76 (1.89) 2.82 (0.22)
Black over-sample 9.84 (2.15) 4.30 (0.70) 14.97 (2.16)
Hispanic over-sample 4.07 (0.78) 23.84 (0.54) 12.15 (1.60)
Parents education included included included
Urban location 4.27 (1.10) 10.65 (1.97) 23.78 (0.67)
Age 21.73 (1.43) 20.67 (0.40) 23.14 (1.75)
Time trend 2.50 (1.54) 0.11 (0.50) 4.20 (1.75)
Costs and benefits
College premium 210.94 (0.97) 26.90 (0.43) 217.35 (1.07)
High school wage 235.99 (2.92) 232.85 (1.99) 249.30 (2.65)
Tuition ratio (4-yr/2-yr) 21.00 (2.22) 21.31 (2.07) 20.89 (1.35)
Unemployment rate 20.22 (0.49) 20.29 (0.46) 0.19 (0.27)
Human capital
Two-year credits 27.37 (4.91) 210.91 (5.35) 23.15 (1.38)
AA degree 27.62 (8.09) 27.63 (5.88) 26.58 (5.30)
Experience 225.16 (8.51) 231.96 (7.37) 219.65 (4.56)
Ever train 27.58 (2.50) 26.70 (1.64) 210.63 (2.30)
Gap in schooling 8.94 (1.81) 10.34 (1.56) 6.60 (0.88)
Field of study
Vocational 23.79 (5.23) 18.19 (2.98) 29.38 (4.25)
Academic 36.58 (4.25) 44.33 (3.87) 27.28 (2.05)
Mean of dep. var. 0.415 (0.493) 0.385 (0.487) 0.452 (0.498)
Sample size 1390 764 626
Pseudo-R2 0.2477 0.3022 0.2183
a Includes only individuals who attended a two-year college. High school graduates who never attended either type of college and four-year college students who never attended a two-year college are excluded.
specific regressions show that having young children or being married affects women’s college attendance decisions more than men’s. In the two-year and four-year attendance equations (columns 2, 3, 5, and 6 of Table 4) the coefficients on “married” and “young kids” are larger in absolute value for women than for men.18Moreover, consistent with notion that two-year colleges are more accommodating than four-year colleges, having young children and being married generally reduce four-year attendance more than two-year attendance.
We also suggested that living in an urban area might proxy for proximity to college, and that gender differ-ences in the effects of “proximity” thus defined might
18 Gender differences in the effects of marital status and hav-ing young children are statistically significant at the 5% level in only the four-year attendance equation.
explain observed attendance patterns. The urban indi-cator is positive and significant in all three two-year attendance equations, consistent with the hypothesis that proximity is an important determinant of two-year attendance. However, this effect does not differ by gen-der, nor does it affect four-year attendance, which sug-gests that proximity does not explain the gender differ-ence in attendance patterns.
159 B.J. Surette / Economics of Education Review 20 (2001) 151–163
The attendance models include a set of economic fac-tors to shed further light on how students decide between and use two- and four-year colleges. We focus first on the direct costs of attendance measured by two-year and four-year tuition. The signs of the own-tuition effects are generally negative, as expected, and do not differ sig-nificantly by gender. The signs of the cross-tuition effects are a priori ambiguous; their estimated values tell us something useful about how students utilize the two types of college. The positive effect of two-year tuition in the four-year attendance equations (columns 4, 5, and 6) indicates that when two-year college is expensive, stu-dents are more likely to attend four-year college (and are less likely to attend two-year college). These cross-effects are not symmetric, however. The negative effect of four-year tuition in the two-year attendance equations (columns 1, 2, and 3) suggests that when four-year col-lege is expensive, students are less likely to attend year college. This latter effect is consistent with two-year colleges’ transfer role: when four-two-year college is expensive and, therefore, more difficult to justify on economic grounds, the transfer option is less attractive and attendance at two-year colleges is reduced.19
The opportunity cost of college attendance is charac-terized by the wage earned by high school graduates in each individual’s state of residence.20As expected, this cost reduces four-year college attendance. Contrary to expectations, this opportunity cost generally raises two-year attendance. Turning next to the benefits of attend-ance, the four-year college graduate wage premium raises the probability of two-year college attendance for both women and men, but reduces the probability each (particularly men) attends four-year college. The latter effect also contradicts expectations.
These contradictory results may stem from a number of causes; state level aggregate wages capture any num-ber of state-specific effects making interpretation of such variables problematic. I retained them because human capital theory argues strongly for their inclusion in
col-19 Intuitively, this asymmetry implies that the cross-price sub-stitution effect is small compared to the income effect in the two-year attendance equation and vice versa in the four-year attendance equation. This asymmetry may stem from intertem-poral considerations playing a larger role in the two-year decision equation—in effect reducing the cross-substitution effect—than in the four-year decision equation.
20 Median wages by education level are obtained from the Current Population Survey (CPS). They are calculated by state and year for 18- to 40-year-olds reporting highest grade com-pleted equal to 12, and for 22- to 40-year-olds for individuals reporting highest grade completed equal to 16 or more. There are not enough observations to calculate these variables by gen-der for each state and year. It is straightforward, but uninforma-tive, to include the wage premium earned by individuals with 1 to 3 years of college.
lege attendance models. Note that none of the results are altered by excluding either the high school graduate wage or the return to college (or both).
Despite controlling for the many factors that human capital theory indicates should affect attendance, the female coefficient in the pooled two-year decision equ-ation remains positive and statistically significant: women remain more likely than men to attend two-year college. This suggests that the explanations advanced thus far for why women are less likely than men to attend two-year colleges only tell part of the story. Family responsibilities, proximity, monetary costs, and ability all play an important role, but they do not completely explain the significant gender difference in two-year attendance rates.
As noted earlier, attendance decisions are almost cer-tainly driven in part by occupational preferences. We cannot observe occupational preferences, but we can proxy for them using ex-post-occupational outcomes. In models not reported, we include indicators for whether each individual ever worked in one of three female-dominated occupations: the secretarial profession, the allied health profession, and primary or secondary school teaching. Training for the first two professions is gener-ally provided by two-year colleges.21 Training for the latter is generally provided by four-year colleges.
The inclusion of occupational indicators causes the coefficient on female in the pooled two-year college regression to become very small and statistically insig-nificant. Women who subsequently work in either the allied health or secretarial professions are much more likely to attend two-year colleges than those who sub-sequently work in other fields. Working as a primary or secondary school teacher or in an allied health profession significantly raises the probability of four-year attend-ance. Controlling for these variables “explains away” the unexplained gender difference in two-year college.
The inclusion of such post-schooling outcomes is hard to justify on logical and econometric grounds—and for that reason we present in Table 4 the models that exclude them. However, such models do tell us something important about the attendance decision and are therefore worthy of note. They strongly suggest that women attend two-year colleges at higher rates than men as a result of occupational preferences.
The question remains as to whether the entire set of explanatory variables explains the gender difference in
transfer rates (as opposed to attendance rates). The
four-year attendance model allows us to examine this ques-tion, albeit indirectly. Controlling for other factors, one expects women and men with equivalent numbers of two-year credits to be equally likely to attend four-year
college.22While this is not, strictly speaking, the same as transferring, it is very similar. The gender-specific four-year attendance regressions (columns 5 and 6) show that the effect of accumulated two-year credits on four-year attendance is smaller for women than for men; one year of two-year credits raises the probability men attend four-year college by 2 or 3 percentage points but has no effect on women’s probability of attendance. This differ-ence is statistically significant at the 1 percent level. Put another way, women with one year of two-year credits are significantly less likely than similar men to attend four-year college and have no higher a probability of attending a four-year college than an otherwise similar high school graduate with no two-year credits.
Note that it is not the case that credits simply matter less in women’s schooling decisions. The effects of accumulated two-year credits on further two-year attend-ance (columns 2 and 3), and the effects of accumulated four-year credits on further four-year attendance (columns 5 and 6), do not differ by gender. Women sim-ply appear less likely than similar men to use two-year colleges as stepping stones to four-year colleges. This is so despite the inclusion of many variables that could theoretically explain the gender difference. Moreover, the inclusion of the occupational indicators discussed above (but not included in the models in Table 4) does not alter this conclusion.
4.2. The transfer model
The attendance models tell us much about what might (and might not) explain the lower transfer rates observed among women. However, the effects of two-year credits on four-year attendance described above does not meas-ure gender differences in transfer rates per se. Rather, we infer lower rates of transfer for women from the fact that men and women with equivalent numbers of two-year credits (and other similar characteristics) make sub-sequent educational decisions differently.
An alternative way to test whether women are less likely than men to transfer is to directly estimate a model with an indicator for whether or not a student transferred at some point during the 12-year panel as the dependent variable. High school graduates who never attend college and students who enrolled only in a four-year college are not considered in the transfer model. Estimation results for three groups—one pooled and one each for women and men—are reported in Table 5.
22 Four-year colleges vary in whether or not two-year credits can be applied by transfer students toward a bachelor’s degree. Usually, such requirements involve grade received and course content. I have no way of identifying which credits would be acceptable in transfer so all credits earned are included in these models.
The explanatory variables are similar to those used in the college attendance equations. However, because the dependent variable is retrospective over up to 12 years, variables that can change with time are set to their values at age 20.23Thus, marital status, the presence of children under the age of 5, tuition, the unemployment rate, urban status, and others are fixed at their values when each individual was 20, even though the transfer could have occurred after that age.
The pooled estimates in Table 5 (column 1) show clearly that women are much less likely than men to transfer. Even after controlling for a wide range of other factors that could explain this trend, being female reduces the probability of transferring by about 6 per-centage points.24We postulated earlier that two-year col-leges’ more flexible class schedules better accommodate domestic responsibilities, which may be borne dispro-portionately by women. Consistent with this hypothesis, the gender-specific effects of having young children are much larger (and negative) for women (column 2) than for men (column 3). Contrary to expectations, being mar-ried reduces men’s transfer rates more than women’s, though this difference is not statistically significant. Finally, the effects of living in an urban area on the transfer decision are substantially higher for women than for men, which is consistent with proximity mattering more for women than for men.25None of these variables, however, fully explains the gender difference in trans-fer rates.
Because the transfer model is defined only for individ-uals who attended college, it is possible to address the possibility that women attend two-year colleges at higher rates than men because the fields of study offered there prepare them satisfactorily for their chosen occupations, which may differ from the fields of study men choose. We include indicators for whether the field of study was vocational or academic, as defined by a taxonomy pro-vided by the National assessment of vocational
edu-cation (United States Department of Eduedu-cation, 1989).
The omitted category is “no major field specified”. Despite the inclusion of these indicators, the coefficient on “female” in the pooled regression is negative, indicat-ing that women remain less likely than men to transfer. Women and men with similar numbers of two-year cred-its, the same broad field of study, who are unmarried and have no small children, and are otherwise identical have different rates of transfer to four-year college.
23 Setting these variables to their values at age 21 or 19 does not alter the qualitative results.
161 B.J. Surette / Economics of Education Review 20 (2001) 151–163
We also hypothesized that women’s lower transfer rates might be explained by differences in educational ability; that more marginal women than men attend two-year college. The AFQT score is included in the transfer model to address this possibility, but the effects of the AFQT score do not differ much across gender.
The AFQT is probably an imperfect proxy for edu-cational ability. Unobserved components of ability that drive schooling decisions will be partially captured by accumulated college credits. The effects of two-year cre-dits are much lower for women than for men. While hav-ing an associate’s degree raises the probability of trans-ferring equally for men and women, completing an associate’s degree requires approximately 2 year’s worth of credits. The combined effects of credits and associ-ate’s degree completion are very small in the female equ-ation, while in the male equation the combined effects of credits and degree completion are quite large.26These results confirm the findings from the attendance models; women who attend two-year college are less likely than similar men to transfer.
A third explanation advanced for why women transfer at lower rates than men is that they simply prefer two-year colleges to four-two-year colleges due to occupational ambitions. To test this hypothesis, we estimated the transfer model with indicators for whether an individual ever worked as a primary or secondary school teacher, in the allied health profession, or as a secretary (estimates not reported). Women who subsequently work in the allied health profession or as teachers are more likely to transfer. However, the key results of this paper are not affected by the inclusion of occupational dumm-ies; the coefficient on female remains negative and stat-istically significant, and in fact, becomes larger and sig-nificant at the 1% level. We conclude from these regressions that while occupation indicators have a lot of explanatory power, they do not alter the conclusion that women are less likely than men to transfer.
4.3. Credits and labor market earnings
Human capital theory predicts that credits affect col-lege attendance by changing the tradeoff between current and future earnings. If the relative returns to two-year and four-year credits differ for women and men, it might be economically rational for women to transfer at lower rates. We tried to test this hypothesis by incorporating the rate of return to college in the attendance and transfer models. Those results were somewhat unsatisfactory, due
26 For women, the effect of completed two-year credits, mul-tiplied by 2 years worth of credits, substantially offsets the effect of having an associate’s degree (27.622*10.9<+6%). For men the combined effect is about+20%.
in part to limitations in using state-level aggregate wages to proxy for current and future earnings.
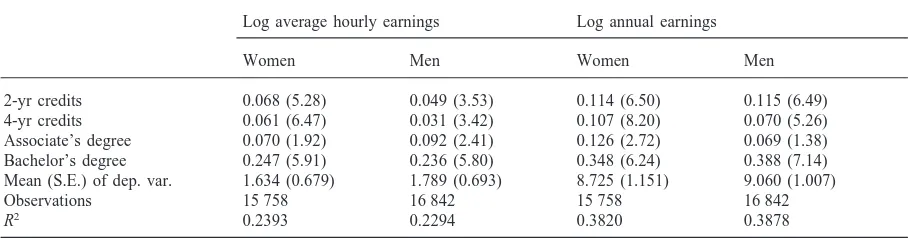
To further evaluate this possible explanation, Table 6 reports rate of return estimates from four (Mincer, 1974) human capital earnings functions based on the NLSY. Several previous authors have examined the returns to two-year college credits and associate’s degree com-pletion (Grubb, 1993; Kane & Rouse, 1995a,b; Surette, 1997). The Grubb and Kane and Rouse analyses are based primarily on the National Longitudinal Survey of the Class of 1972, and the college credit data is now over 20 years old. The NLSY data used here (and in Surette) is more recent (though still over 10 years old) and is more relevant for explaining attendance behavior during the 1980s. The estimates reported in Table 6 are broadly similar to those reported in previous studies.
The regressions presented in Table 6 explain the log of hourly earnings and the log of annual earnings, by gender, as functions of two-year credits, four-year cred-its, degrees, and a large set of other explanatory variables (see footnote in Table 6) typically included in human capital models. The estimates show that women and men do not differ appreciably in their returns to two-year cre-dits, and that for women, the returns to two-year and four-year credits do not differ much. Men’s return to four-year credits are lower than their return to two-year credits, and are much lower than women’s returns to four-year credits. This is the opposite of what one would expect if differences in returns to college explain the transfer rate difference. These estimates suggest that on economic grounds women should, if anything, be more likely than men to attend or transfer to four-year college, not less.
5. Summary and conclusion
Table 6
Log wage and log annual earnings equations (t-statistics in parentheses)a,b
Log average hourly earnings Log annual earnings
Women Men Women Men
2-yr credits 0.068 (5.28) 0.049 (3.53) 0.114 (6.50) 0.115 (6.49)
4-yr credits 0.061 (6.47) 0.031 (3.42) 0.107 (8.20) 0.070 (5.26)
Associate’s degree 0.070 (1.92) 0.092 (2.41) 0.126 (2.72) 0.069 (1.38) Bachelor’s degree 0.247 (5.91) 0.236 (5.80) 0.348 (6.24) 0.388 (7.14) Mean (S.E.) of dep. var. 1.634 (0.679) 1.789 (0.693) 8.725 (1.151) 9.060 (1.007)
Observations 15 758 16 842 15 758 16 842
R2 0.2393 0.2294 0.3820 0.3878
a Models also include the AFQT score, experience, vocational training, a quadratic in age, a time trend, the local unemployment rate, and indicators for married, have young children, black random, black over-sample, Hispanic random, Hispanic over-sample, and urban location. The wage equations also include a part-time indicator.
b Standard errors are calculated using the Huber (1967) and White (1980) method to account for multiple observations of individ-uals.
rates, but strengthens the conclusion that women are less likely than men to transfer. In other words, none of the explanatory variables used in this study can fully explain the gender difference in transfer rates. It appears that women and men simply prefer different types of college for reasons that have yet to be fully documented.
Acknowledgements
The author thanks Raphael Bostic, Rick Fry, Tom Mroz, Annika Sunde´n, and two anonymous referees for help with this paper. The opinions expressed here are not necessarily shared by the Federal Reserve Board.
Appendix A. Definitions of variables
Dependent variables
Two-year college attendance Indicator for attending two-year college in each year.
Four-year college attendance Indicator for attending four-year college in each year.
Transfer Indicator for attending four-year college sub-sequent to two-year college at some point dur-ing the panel.
Demographics
Currently married Indicator for being currently married or living with a partner.
Have young children Indicator for currently living with own children under age 5.
AFQT Deviation of the AFQT score from the age-spe-cific mean AFQT score.
Black random sample Indicator for respondent being in the NLSY’s random sample of blacks. Black over sample Indicator for respondent being in the
random over-sample of blacks.
Hispanic random sample Indicator for respondent being in the random sample of Hispanics.
Hispanic over sample Indicator for respondent being in the random over-sample of Hispanics. Parents’ education Years of schooling for both parents.
Indicators identify parents whose education levels are missing.
Urban location Indicator for living in a county where the majority of the population is considered “urban”.
Age Years of age.
Costs and benefits of attendance (all dollars are adjusted to US$1987)
HS graduate wage (in logs) Average wage earned by high school graduates in respondent’s state of residence.
College wage premium Percentage premium paid to college graduates compared to high school graduates in respondent’s state of residence. Two-year tuition (US$1000s) Average tuition at public
two-year colleges in respondent’s state. Four-year tuition (US$1000s) Average tuition at public
four-year colleges in respondent’s state. Tuition differential The ratio of four-year tuition to
two-year tuition.
163 B.J. Surette / Economics of Education Review 20 (2001) 151–163
Human capital
2-yr credits (divided by 30) Total accumulated two-year credits as of beginning of current two-year. 4-yr credits (divided by 30) Human capital
year credits as of beginning of current year.
LM experience (years) Total accumulated hours worked since leaving school (divided by 2000). Vocational training Years of vocational training. Ever train Ever participate in vocational training. Gap Ever had a gap of one year or more between
years of schooling.
Academic Indicator for majoring in an academic field at a two-year college.
Vocational Indicator for majoring in a vocational field at a two-year college.
References
Breneman, D., & Nelson, S. (1981). Financing community
col-leges: an economic perspective. Washington DC: The
Brookings Institution.
Brint, S., & Karabel, J. (1989). The diverted dream: community
colleges and the promise of educational opportunity in America, 1900–1985. New York: Oxford University Press.
Grubb, N. (1989a). The effects of differentiation on educational attainment: the case of community colleges. The Review of
Higher Education, 12 (4), 349–374.
Grubb, N. (1989b). Dropouts, spells of time, and credits in post-secondary education: evidence from longitudinal surveys.
Economics of Education Review, 8 (1), 49–67.
Grubb, N. (1993). The varied economic returns to postsecond-ary education. Journal of Human Resources, 28 (21), 365–382.
Hilmer, M. (1997). Does community college attendance provide
a strategic path to a higher quality education? Economics of
Education Review, 16 (1), 59–68.
Huber, P. J. (1967). The behavior of maximum likelihood esti-mates under non-standard conditions. In Proceedings of the
Fifth Berkeley Symposium in Mathematical Statistics and Probability (pp. 221–233). Berkeley: University of
Califor-nia Press.
Kane, T. J., & Rouse, C. E. (1995a). Labor market returns to two- and four-year college. American Economic Review, 85 (3), 600–614.
Kane, T. J., & Rouse, C. E. (1995b). Comment on W. Norton Grubb, “The varied economic returns to post-secondary edu-cation: new evidence from the class of 1972”. Journal of
Human Resources, 30 (1), 205–221.
Leigh, D., & Gill, A. (1997). Labor market returns to com-munity colleges: evidence for returning adults. Journal of
Human Resources, 32 (2), 334–353.
Manski, C., & Wise, D. (1983). College choice in America. Cambridge: Harvard University Press.
Mincer, J. (1974). Schooling, experience and earnings. New York: NBER.
Ordovensky, F. (1995). Effects of institutional attributes on enrollment choice: implications for postsecondary vocational education. Economics of Education Review, 14 (4), 335–350.
Rouse, C. (1995). Democratizing or diversion: the effect of community colleges on educational attainment. Journal of
Business and Economics Statistics, 13 (2), 217–224.
Surette, B. J. (1997). The effects of two-year college on the schooling and labor market experiences of young men. Fin-ance and Economics Discussion Series Working Paper 44. United States Department of Education. (1989). In: D. Good-win, The national assessment of vocational education:
post-secondary vocational education, vol. 4. Washington DC:
Government Printing Office.
United States Department of Education. (1996). The digest of
education statistics. Washington DC: Government Printing
Office.
White, H. (1980). A heteroskedasticity-consistent covariance matrix estimator and a direct test for heteroskedasticity.