and Earnings Information Transfers
Jerry C. Y. Han
SUNYATBUFFALO
John J. Wild
UNIVERSITY OFWISCONSIN
Prior evidence shows small firms experience greater stock price revalua- size, the information conveyed to the market by accounting
dis-tions to earnings reports than do large firms. This finding is attributed to closures (e.g., earnings reports) is inversely related to firm size.
different levels of predisclosure information production and dissemination. Empirical evidence supports this size-related information
Accordingly, because information search activities yield higher expected hypothesis. The magnitude of abnormal returns associated
trading profits for larger firms, prices are “more informative” for larger with both good and bad earnings information has been shown
firms and their earnings reports convey less information. This phenomenon to be inversely related to firm size. For example, Freeman,
is called the size-related differential information hypothesis. Moreover, (1987, Tables 6–8) finds cumulative abnormal returns of small
asset pricing theory views prices as a function of all information—including firms to exceed those of large firms by more than 40%. Also,
information about other firms. This multilateral perspective is consistent Atiase (1985) reports greater stock return variability for
earn-with earnings reports yielding price revaluations for other firms, called ings announcements of small firms. He finds announcement
earnings information transfers. This article hypothesizes that the size- week return variances of small firms to exceed those of large
related differential information hypothesis extends to earnings information firms by more than 200%. In both of these studies, this
size-transfers. It predict and shows that price revaluations to earnings are related phenomenon is attributed to different levels of
predis-inversely related to the size of both disclosing and non-disclosing firms. closure information production and dissemination by private
This evidence supports the multilateral price implications of earnings. parties for firms of different sizes.
J BUSN RES2000. 49.273–288. 2000 Elsevier Science Inc. All rights The implications of this differential information hypothesis
reserved. extend beyond the individual firm. For example, the widely
accepted conceptualization of asset pricing views firms’ stock prices as a function of the entire information available to
D
ifferent incentives for information search are asserted market participants—not just own-firm’s information setto systematically affect the informativeness of stock (Harris, 1987; Schipper, 1990). Such a representation suggests
prices for firms of different sizes (Atiase, 1985; Free- that a firm’s price is not only a function of its own disclosures
man, 1987; Collins, Kothari, and Rayburn, 1987). Larger firms but also of other firms’ disclosures (so-called information
are argued to possess more informed prices due to greater transfers). [Evidence of information transfers is considerable;
information production and dissemination by private parties. e.g., see Baginski (1987), Clinch and Sinclair (1987), Foster
This is because private parties are drawn to larger firms by (1981), Freeman and Tse (1992), Han and Wild (1990), Olsen
higher expected trading profits. An investor pursues informa- and Dietrich (1985), Pownall and Waymire (1989), and Pyo
tion search so long as its cost is less than its expected trading and Lustgarten (1990).] The size-related differential
informa-profit. This implies more informed prices for larger firms if tion hypothesis has obvious implications within this
multilat-marginal trading profits increase with firm size, and at a greater eral view of the determination of firms’ prices. That is, not
rate than marginal search costs. Trivially, if search is costless, only is the information content of a firm’s own disclosures
then trading profits vary in strict proportion to firm size (mar- inversely related to its size, but so to are its information
ket value). Hence, because information production and dis- transfers to other firms. Hence, accounting disclosures of
semination by private parties is an increasing function of firm smaller firms should yield greater price revaluations for its
own stock and stocks of other firms. From the perspective of private parties interested in firm valuation, the incentives for
Address correspondence to Dr. John J. Wild, Grainger School of Business,
University of Wisconsin, 975 University Avenue, Madison, WI 53706-1323. information search (i.e., to explore the information transfer
Journal of Business Research 49, 273–288 (2000)
2000 Elsevier Science Inc. All rights reserved. ISSN 0148-2963/00/$–see front matter
mechanism among firms) are greater for larger firms. This tests and results associated with the size-related differential information hypothesis. The analyses of information transfers not only implies more informed prices but also information
are extended to the size of the non-announcing firms and to transfers of lesser magnitude for larger firms’ earnings reports.
the variability of stock returns. The article then investigates No empirical evidence exists on the descriptive validity of
additional determinants of earnings informativeness, includ-the size-related information hypoinclud-thesis within this multilateral
ing the number of analysts’ forecasts and the number of lines view of the determination of firms’ prices. However, prior
of business. research does offer evidence of significant information
trans-fers associated with earnings announcements. That is, the
stock price behavior of non-announcing firms is positively
Hypothesis Formulation
related to the information (good or bad) conveyed in
announc-The relation between firm capitalization (size) and the amount ing firms’ earnings reports (Foster, 1981; Clinch and Sinclair,
of information produced and disseminated to the market is 1987; Han and Wild, 1990). This positive relation has been
the focus of considerable research. Atiase (1985) examined shown to exist in both the means and variances of
non-this relation and identified several determinants of the ex-announcing firms’ abnormal stock returns.
pected trading profits to information acquisition by private This article investigates the size-related hypothesis, as
reflec-parties. He concluded that: (1) firm size (capitalization) must tive of differential predisclosure information, for stock price
be sufficiently large to justify information acquisition costs, revaluations to earnings reports for announcing and
non-and (2) partial signaling reduces the potential return to invest-announcing firms. The primary sample consists of 1,021
firm-ors for information acquisition activities directed at smaller quarter earnings announcements and 2,585 non-announcing
firms (i.e., informed trading is more easily identified and firms from the same industries. This sample is then partitioned
signaled with smaller firms). Hence, Atiase hypothesized that on firm size as measured by the firms’ dollar market value of
the amount of predisclosure information production and dis-equity. Tests for differential stock price informativeness of
semination is an increasing function of firm size. This size-earnings reports are conducted across size partitions.
Further-related information hypothesis implies that: (1) the magnitude more, two additional determinants of the informativeness of
of abnormal returns to the disclosure of earnings information earnings to both announcing and non-announcing firms are
is inversely related to firm size, and (2) the variance of abnor-explored: the number of analysts’ forecasts and the extent of
mal returns to earnings announcements is inversely related to firm diversification as reflected in the number of lines of
firm size. Several studies provide empirical evidence consistent business in which the firm operates.
with these hypotheses (e.g., Freeman, 1987; Collins et al., The article’s primary results reveal significant systematic
1987; Atiase, 1985). cross-sectional differences in the price informativeness of
earn-The widely accepted conceptualization of asset pricing ings for firms of different sizes. As predicted, the magnitude of
views stock prices as a function of all available information.
both directional and non-directional stock price revaluations is This multilateral representation of asset pricing implies that:
inversely related to firm size. Specifically, the strength of the
(1) a specific firm’s information disclosures affect all other
relation between earnings information and both announcing firms’ prices, and (2) all other firms’ disclosures affect the
and non-announcing firms’ abnormal returns behavior is in- price of a specific firm. Hence, the joint consideration of a
versely related to firm size. This finding is robust to alternative multilateral representation of asset pricing and the size-related
specifications of the research design including: (1) measure- differential information hypothesis implies that the magnitude
ment of abnormal returns; (2) firm size classifications; (3) of stock price revaluations associated with earnings
announce-portfolio and individual firm-based tests; and (4) parametric ments is inversely related to the size of both announcing and
and non-parametric test statistics. These results are consistent non-announcing firms.
with the size-related differential information hypothesis and This article investigates the empirical validity of these
hy-its extension to a multilateral view of the determination of pothesized relations. Specifically, the article relies on this
mul-firms’ stock prices. This inference supports the widely ac- tilateral representation of asset pricing to hypothesize
size-cepted conceptualization of asset pricing and articulates with related differential price revaluations to the earnings reports
the differential information hypothesis. The article also shows of both the announcing and the non-announcing firms. The
that the size-related results are distinct from the number of hypothesized relations are tested through examination of both
analysts’ forecasts and firm diversification using the number directional and non-directional price revaluations conditional
of lines of business as a proxy variable; this is indicative of on the release of earnings reports. The analyses are extended
these determinants reflecting disparate economic phenomena. to explore two other potential determinants of the size-related
The following section presents the firm size-related differ- differential information hypothesis: analysts following and
ex-ential information hypothesis for information transfers associ- tent of firm diversification.
ated with earnings announcements. The sample selection
pro-cedures and some descriptive statistics are provided in the
Sample Selection
third section. The definitions for important variables,
includ-ing abnormal stock returns, unexpected earninclud-ings, and firm The experimental sample consists of companies’ quarterly
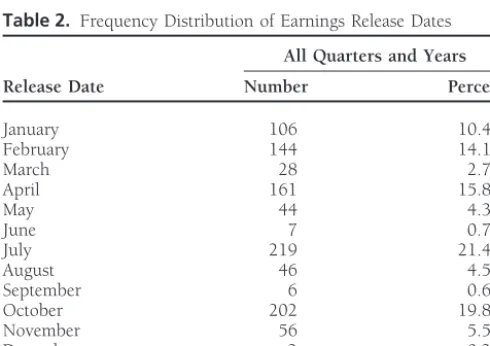
sample selection procedures are similar to those in Foster code 7213) has a non-calendar year-end. This industry com-prises 11 of the 1,021 announcing firm-quarter observations. (1981, pp. 204–205). Specifically, to be included in the
sam-ple, firms’ earnings announcements must meet the following As expected, a majority of releases occur within the first month
after the quarter’s end; the exception is the fourth quarter selection criteria:
where the releases are spread over the two months following 1. Firms are listed on both Standard & Poor’s Compustat
year-end. database, and the Center for Research in Security Prices
(CRSP) Daily Returns File;
2. There must be at least two firms in the same four-digit
Definitions of Variables
SIC code industry and their earnings announcement
Abnormal Stock Returns
dates must not be within two trading days of each other.Abnormal stock returns for announcing and non-announcing The minimum of two firms is imposed in order to
firms at earnings release dates are obtained from the market permit examination of information transfer, while the
model [Eq. (1)], restriction on use of simultaneous releases is to avoid
confounding information transfer tests;
ui,t5Ri,t2(aˆi1 bˆi· RM,t), (1)
3. All firms in the four-digit SIC code industry have
com-parable reporting periods; where Ri,t is the daily stock return for firm i on day t, and
RM,tis the return on a value-weighted market portfolio for day
4. Quarterly earnings release dates must be available from
t. The model’s parameters,aˆiandbˆi, are derived from ordinary Standard & Poor’s Compustat database for the fiscal
least-squares regression using the past returns of each firm. periods 1984 through 1986 inclusive;
The estimation period extends from the first trading-day of 5. Daily stock returns must be available from the CRSP
the previous fiscal year through six trading-days prior to the File for estimation of the stock return model’s
parame-earliest earnings release date in the sample of announcing ters and for computation of firms’ abnormal stock
re-firms. This rule is applied separately for estimation of the turns at the earnings release dates;
models’ parameters in each of the fiscal years of the sample. 6. Analysts’ consensus forecasts of quarterly earnings must
The estimation period is never less than 239 trading days for be available from the I/B/E/S database immediately prior
any year or any firm. to the earnings announcement (for computation of
un-Our measurement of announcing and non-announcing expected earnings). The I/B/E/S database also provides
firms’ abnormal stock return reactions to earnings reports the reported earnings figures. (We are grateful to I/B/E/S
entails cumulation of daily abnormal returns around release for providing the analyst forecast data.)
dates. The cumulative abnormal return (CAR) metric is
de-The imposition of these criteria yield 1,021 firm-quarter earn- fined as [Eq. (2)]
ings release observations (i.e., announcing firms). Panel A
of Table 1 provides additional details regarding the sample CARi5
o
0t521
ui,t, (2)
selection procedures for the announcing firms and the number of firms removed by each filter.
where ui,t is the daily abnormal stock return [see Equation
The contemporaneous (in event-time) sample of
non-(1)], and the cumulation period is from day {21} to day {0}
announcing firms is comprised of all firms in an industry inclusive. The earnings release date for each announcing firm
absent the announcing firm. When two or more firms from
is designated as event day {0}. the same industry release earnings within two trading days
of each other, they are not included in the non-announcing
Unexpected Earnings Information
firm sample for those specific earnings releases (see above).Unexpected earnings (UE) are defined as reported earnings This requirement is imposed so that a firm’s stock price
move-less analysts’ consensus earnings forecast, with the difference ment associated with its own earnings release (information
deflated by the absolute value of the analysts’ consensus fore-content) not confound information transfer tests. Subsequent
cast. The consensus forecast is the I/B/E/S consensus forecast analysis (not reported) suggests that the removal of both
earn-published immediately prior to the quarter’s earnings release. ings announcements and corresponding non-announcing firms
The article’s inferences are unchanged by use of the firm’s in cases of simultaneous releases does not affect the inferences
market value of equity as the deflator. from this study. Panel B of Table 1 presents the sample
selec-tion informaselec-tion for the 2,585 non-announcing firms.
Firm Capitalization
Four-digit SIC code industry classifications obtained fromthe CRSP File are used to categorize the firms. The final sample Firm capitalization (size) is defined in terms of the dollar
market value of the announcing firm’s common stock at the of 1,021 announcing firm-quarters consists of 45 different
four-digit SIC code industries. A frequency distribution of beginning of a period—later in the article the size of
non-announcing firms is also investigated. This measure is similar firms’ earnings release dates according to months is shown in
Table 2. This distribution reflects the high number of calendar- to that used in prior research (Atiase, 1985; Freeman, 1987).
Table 1. Sample Selection Procedures
Firm-Quarter Observations
A: Announcing Firms
All firm-quarter observations available from the Compustat and CRSP Files for 1984–1986 26,652 Less Firm-Quarter observations not meeting the following requirements:
At least one other firm in the same four-digit SIC code industry ,2,664. Equivalent quarterly reporting periods for all firms in the same four-digit SIC code industry ,21,224. Dates for which quarterly earnings per share are first publicly reported (from Compustat) ,1,016. Stock returns from CRSP for estimation of pricing models and computation of abnormal returns ,160. At least one firm in the industry not releasing earnings within two trading days of announcing firm ,170. Analysts’ forecasts of earnings from I/B/E/S immediately prior to the earnings announcement ,397.
Total Announcing Firms 1,021
B: Non-Announcing Firms
All contemporaneous non-announcing firms having (1) the same four-digit SIC code and fiscal reporting period as the announcing firm, and (2) stock returns available from the CRSP file for computation of abnormal returns at
the announcing firm’s release date 4,584
Less Firm-Quarter observations not meeting the following requirements:
Earnings releases are at least two days apart from the announcing firm’s earnings release ,882. Analysts’ forecasts available for the announcing firms (see panel A) ,1,117. Total Non-Announcing Firms available for information transfer tests 2,585
differences in industries, primarily because firms within indus-
Differential Information
tries are of similar size (Ball and Foster, 1982, p. 183), a
Hypothesis Tests
second measure of firm size is considered in order to capture
the relative sizes of firms within industries. Specifically, rela-
Descriptive Statistics
tive firm size is defined as the market value of the announcing
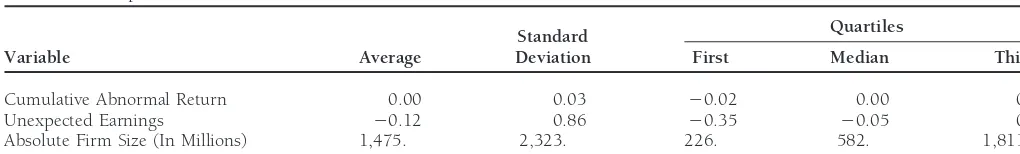
Descriptive statistics for abnormal returns, unexpected earn-firm deflated by the average market value of all earn-firms within
ings, and firm size are presented in Table 3. The statistics are that industry for each period. However, since our inferences
computed from the 1,021 firm-quarter earnings announce-are unchanged when using this alternative size measure, we
ment observations. The average, and median, cumulative ab-do not separately report those results.
normal returns is approximately zero (not significant at con-The firm size measure is then used to classify announcing
ventional levels), and the proportion of positive to negative firms as either large, medium, or small. In each case, firms
cumulative abnormal returns (50.34%) is not significantly are classified as large (small) if their size measure is in the
different from 50%. Both the Pearson and Spearman correla-largest (smallest) one-third of sample firms. Those firms in
tion coefficients between abnormal returns and unexpected the middle one-third of the size ranking are classified as
me-earnings, 0.16 and 0.19, respectively, are significantly greater dium size firms. Correspondingly, the non-announcing firms
than zero at the 0.01 level. Other parametric and non-paramet-are categorized into portfolios conditional on the size
classifi-ric tests using portfolio and individual observations yield simi-cation of announcing firms. Inferences are unchanged when
lar results. The average market value of firms in our sample using alternative size partitions (e.g., quartiles and quintiles).
is nearly $1.5 billion, and the median value is about $0.6 billion. Firm size ranges from a low of $9.7 million to over
Table 2. Frequency Distribution of Earnings Release Dates
$27 billion.
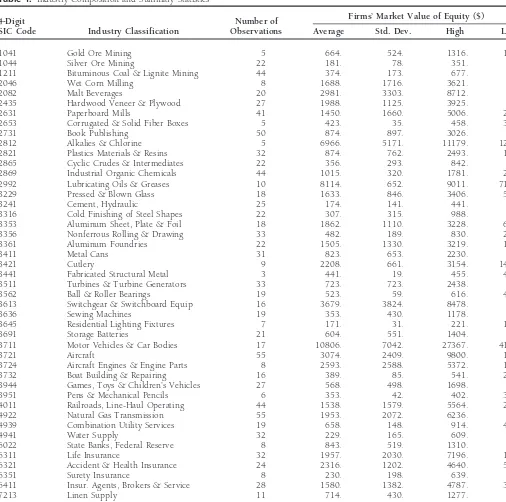
All Quarters and Years The industries that comprise the sample, along with infor-mation on their respective firms’ market value of equity, are
Release Date Number Percent
shown in Table 4. These data evidence a substantial diversity
January 106 10.4% in the size of firms comprising the experimental sample.
February 144 14.1
March 28 2.7
Earnings Information, Firm Size, and
April 161 15.8
May 44 4.3
Stock Prices
June 7 0.7
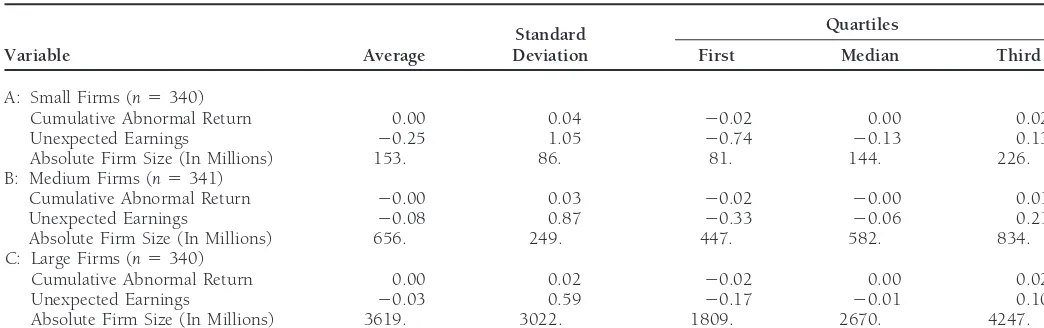
Descriptive statistics are presented in Table 5 for firms
parti-July 219 21.4
tioned by size. The average size of small, medium, and large
August 46 4.5
September 6 0.6 firms is $153 million, $656 million, and $3.619 billion, respec-October 202 19.8 tively. Notice that the size of large firms is nearly 25 times that
November 56 5.5 of small firms, but less than six times that of medium firms.
December 2 0.2
Our first set of tests regarding the differential earnings
infor-Total 1,021 100.0%
correla-Table 3. Descriptive Statisticsa
Quartiles Standard
Variable Average Deviation First Median Third
Cumulative Abnormal Return 0.00 0.03 20.02 0.00 0.02
Unexpected Earnings 20.12 0.86 20.35 20.05 0.13
Absolute Firm Size (In Millions) 1,475. 2,323. 226. 582. 1,811.
aCumulative abnormal returns, unexpected earnings, and firm size are defined in “Sample Selection.”
tions (see Beaver, Clarke and Wright, 1979; Hagerman, Zmi- firms’ positive price revaluations are 0.86 and 0.66,
respec-tively; each significant at the 0.05 level. This evidence is consis-jewski and Shah, 1984). Specifically, the 1,021 announcing
firms are separated into ten mutually exclusive portfolios con- tent with prior research on the information content of earnings
(Beaver et al., 1979; Hagerman et al., 1984). ditional on the magnitude of unexpected earnings. The first
portfolio comprises the 10% of firms with the most negative Columns five and six of panel A in Table 6 present evidence
consistent with earnings information transfers. (“bad news”) unexpected earnings, whereas the tenth portfolio
comprises the 10% of firms with the most positive (“good news”) Non-announcing firms’ portfolios are comprised of average
non-announcing firms’ reactions to each announcing firms’ unexpected earnings. The non-announcing firms in the same
industry are then assigned to a vector of 10 portfolios condi- earnings release. The use of average non-announcing firms’
reactions should alleviate the statistical problem associated tional on the cell assignment of their respective announcing
firm. For example, if announcing firm A has an unexpected with the aggregation of dependent observations (i.e., due to
positive covariation in firms’ returns within industries). Subse-earnings figure that places it in the first portfolio, then all
non-announcing firms in firm A’s industry are placed in the quent tests are also conducted with non-announcers’ returns
that are not averaged prior to computing portfolio returns. The first portfolio of the non-announcing firm vector. Correlations
are then computed between the announcing firms’ unexpected results of these alternative tests are similar to those reported.
The Spearman and Pearson correlations between unex-earnings portfolio vector and both announcing and
non-announcing firms’ stock return portfolio vectors. If larger firms pected earnings and non-announcing firms’ abnormal returns
are 0.64 and 0.42, respectively—only the former value is are associated with greater predisclosure information
produc-tion and disseminaproduc-tion by private parties, then correlaproduc-tions be- significantly greater than zero at the 0.05 level. However, the
same correlation tests between unexpected earnings and non-tween earnings and returns should be greater for smaller firms.
Panel A of Table 6 presents correlations between earnings announcing firms’ positive price revaluations yield values of
0.56 and 0.55, respectively—which are both significantly and returns for the total sample of announcing and
non-announcing firms (i.e., not conditional on size). The second, greater than zero at the 0.10 level. These latter results indicate
that the number of positive price revaluations for non-announc-third, and fourth columns of panel A show average unexpected
earnings, cumulative abnormal returns (CAR% 5 CAR 3 ing firms is greater the larger the announcing firms’ unexpected
earnings. Hence, this evidence is consistent with significantly 100), and the percent of positive price revaluations (%POS),
respectively, for announcing firms after being rank-ordered positive, albeit weak, earnings information transfers.
Evidence supportive of the size-related differential informa-and separated into ten equally-sized portfolios conditional on
unexpected earnings. (To mitigate the possible effect from tion hypothesis for earnings disclosures is presented in panels
B, C, and D of Table 6. First, notice that correlations between
extreme values, unexpected earnings are truncated at6200%.
Other truncation and deletion rules are used with no effect on unexpected earnings and both the abnormal returns and
posi-tive price revaluations of announcing firms’ are inversely re-the inferences drawn.) The positive price revaluations metric
(%POS) is defined as the number of announcing firms with lated to firm size. That is, while the correlations between
earnings and returns are positive and significantly greater than positive abnormal returns in a portfolio, and provides another
measure of association between earnings and returns (e.g., zero for small firms (at the 0.05 level), those for medium and
large firms are mixed. For example, the Pearson correlation see Foster, 1981; Han, Wild and Ramesh 1989). Because the
positive price revaluations metric is a tally of directional price between unexpected earnings and abnormal returns is 0.86
for small firms, but only 0.56 and 0.53 for medium and large responses for a portfolio it is not influenced by extreme values.
Evidence in panel A of Table 6 indicates that the returns of firms, respectively. Subsequent regression tests (see below)
show that these differences are statistically significant. both announcing and non-announcing firms are significantly
related to the information conveyed in earnings reports. The Second, and particularly relevant to this article’s primary
hypothesis, is the striking inverse relation between firm size Spearman and Pearson correlations between unexpected
earn-ings and announcing firms’ abnormal returns are 0.95 and and earnings information transfers. Specifically, small firms’
Spearman and Pearson correlations between unexpected earn-0.81, respectively. Both of these correlations are significantly
greater than zero at the 0.01 level. The Spearman and Pearson ings and non-announcing firms’ abnormal returns (0.82 and
Table 4. Industry Composition and Summary Statistics
Firms’ Market Value of Equity ($)
4-Digit Number of
SIC Code Industry Classification Observations Average Std. Dev. High Low
1041 Gold Ore Mining 5 664. 524. 1316. 175.
1044 Silver Ore Mining 22 181. 78. 351. 97.
1211 Bituminous Coal & Lignite Mining 44 374. 173. 677. 66.
2046 Wet Corn Milling 8 1688. 1716. 3621. 80.
2082 Malt Beverages 20 2981. 3303. 8712. 10.
2435 Hardwood Veneer & Plywood 27 1988. 1125. 3925. 91.
2631 Paperboard Mills 41 1450. 1660. 5006. 211.
2653 Corrugated & Solid Fiber Boxes 5 423. 35. 458. 380.
2731 Book Publishing 50 874. 897. 3026. 38.
2812 Alkalies & Chlorine 5 6966. 5171. 11179. 1279.
2821 Plastics Materials & Resins 32 874. 762. 2493. 122.
2865 Cyclic Crudes & Intermediates 22 356. 293. 842. 65.
2869 Industrial Organic Chemicals 44 1015. 320. 1781. 258.
2992 Lubricating Oils & Greases 10 8114. 652. 9011. 7158.
3229 Pressed & Blown Glass 18 1633. 846. 3406. 514.
3241 Cement, Hydraulic 25 174. 141. 441. 18.
3316 Cold Finishing of Steel Shapes 22 307. 315. 988. 56.
3353 Aluminum Sheet, Plate & Foil 18 1862. 1110. 3228. 600.
3356 Nonferrous Rolling & Drawing 33 482. 189. 830. 224.
3361 Aluminum Foundries 22 1505. 1330. 3219. 177.
3411 Metal Cans 31 823. 653. 2230. 88.
3421 Cutlery 9 2208. 661. 3154. 1438.
3441 Fabricated Structural Metal 3 441. 19. 455. 420.
3511 Turbines & Turbine Generators 33 723. 723. 2438. 38.
3562 Ball & Roller Bearings 19 523. 59. 616. 413.
3613 Switchgear & Switchboard Equip 16 3679. 3824. 8478. 33.
3636 Sewing Machines 19 353. 430. 1178. 22.
3645 Residential Lighting Fixtures 7 171. 31. 221. 139.
3691 Storage Batteries 21 604. 551. 1404. 37.
3711 Motor Vehicles & Car Bodies 17 10806. 7042. 27367. 4105.
3721 Aircraft 55 3074. 2409. 9800. 130.
3724 Aircraft Engines & Engine Parts 8 2593. 2588. 5372. 165.
3732 Boat Building & Repairing 16 389. 85. 541. 253.
3944 Games, Toys & Children’s Vehicles 27 568. 498. 1698. 33.
3951 Pens & Mechanical Pencils 6 353. 42. 402. 302.
4011 Railroads, Line-Haul Operating 44 1538. 1579. 5564. 291.
4922 Natural Gas Transmission 55 1953. 2072. 6236. 94.
4939 Combination Utility Services 19 658. 148. 914. 410.
4941 Water Supply 32 229. 165. 609. 49.
6022 State Banks, Federal Reserve 8 843. 519. 1310. 47.
6311 Life Insurance 32 1957. 2030. 7196. 120.
6321 Accident & Health Insurance 24 2316. 1202. 4640. 537.
6351 Surety Insurance 8 230. 198. 639. 55.
6411 Insur. Agents, Brokers & Service 28 1580. 1382. 4787. 300.
7213 Linen Supply 11 714. 430. 1277. 79.
Total 1021
0.77, respectively) are all significantly greater than zero at the the portfolio-based analysis in Table 6, we compute
correla-tions at the individual firm level following Beaver et al. (1979, 0.05 level. By the same token, not any of these same correlation
tests yield values which are significantly greater than zero for Table 8). Both Spearman and Pearson correlations between
unexpected earnings (UE) and the cumulative abnormal re-either medium or large size firms. These results are consistent
with this article’s size-related differential information hypothe- turns (CAR) of announcing (A) and non-announcing (NA)
firms are shown in Table 7 (categorized by size). sis for earnings information transfers. We attribute this
phe-nomenon to different levels of predisclosure information pro- First, notice that while the relation between earnings and
returns is significant (at the 0.01 level) for all size partitions, duction and dissemination for firms of different sizes.
This conclusion is reinforced by correlation analyses con- there exists an inverse relation between the magnitude of
Table 5. Descriptive Statistics By Firms’ Market Value of Equitya
Quartiles Standard
Variable Average Deviation First Median Third
A: Small Firms (n5340)
Cumulative Abnormal Return 0.00 0.04 20.02 0.00 0.02
Unexpected Earnings 20.25 1.05 20.74 20.13 0.13
Absolute Firm Size (In Millions) 153. 86. 81. 144. 226.
B: Medium Firms (n5341)
Cumulative Abnormal Return 20.00 0.03 20.02 20.00 0.01
Unexpected Earnings 20.08 0.87 20.33 20.06 0.21
Absolute Firm Size (In Millions) 656. 249. 447. 582. 834.
C: Large Firms (n5340)
Cumulative Abnormal Return 0.00 0.02 20.02 0.00 0.02
Unexpected Earnings 20.03 0.59 20.17 20.01 0.10
Absolute Firm Size (In Millions) 3619. 3022. 1809. 2670. 4247.
aCumulative abnormal returns, unexpected earnings, and firm size are defined in “Sample Selection.”
ings information transfers are evident for small firms only. value 0 otherwise. Cumulative abnormal returns (CAR) and
unexpected earnings (UE) are as defined earlier, and j repre-Hence, this evidence suggests a very pronounced relation
between earnings information transfers and firm size. sents the sample of non-announcing firms. Our size-related
information transfer hypothesis predicts that dˆ will be signifi-Next, we extend our tests to consider the behavior of
earn-ings response coefficients. The differential information hy- cantly greater than zero (i.e., earnings information transfers
of smaller firms are more price informative). pothesis implies that earnings of smaller firms are more
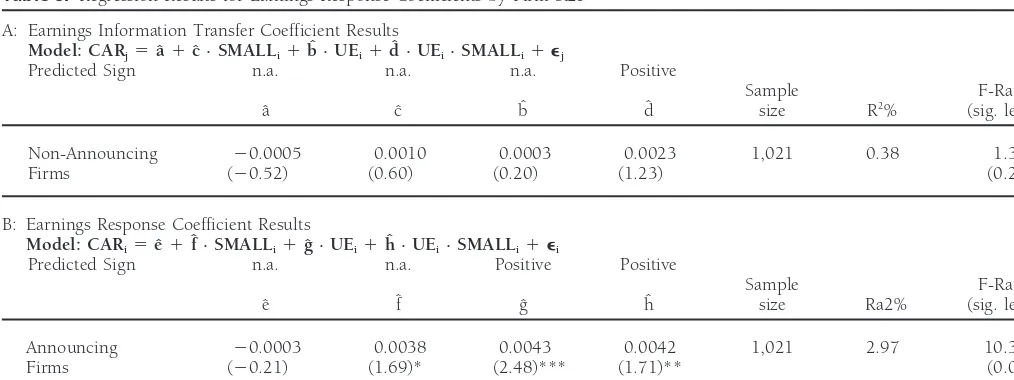
infor-mative—hence, prior analytical research (e.g., Holthausen and The results of this test, reported in panel A of Table 8,
Verrecchia, 1988) would predict that earnings response coeffi- indicate that earnings information transfers are greater for
cients are inversely related to firm size. That is, given investors small firms. The estimated earnings information transfer
coef-more diffuse priors for small firms (due to less predisclosure in- ficient for small firms, bˆ1 dˆ 5 .0026, represents a nearly
formation production and dissemination), a more pronounced nine-fold increase over the estimated information transfer
co-change in stock price is expected for a given level of earnings efficient of 0.0003 for medium and large firms. This difference
from these firms. We employ the following pooled cross- is significant at the 0.11 level. In addition, panel B of Table
sectional regression model to test this hypothesis [Eq. (3)]: 8 reports similar evidence for earnings response coefficients
of announcing firms. Specifically, the estimated earnings
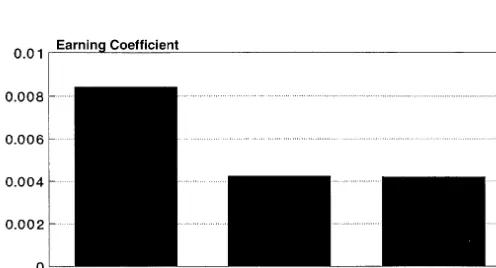
re-CARi(or CARj)5aˆ 1bˆ · UEi1 ei(or j) (3)
sponse coefficient for small firms, gˆ1hˆ50.0085, is about
where cumulative abnormal returns (CAR) and unexpected twice the estimated response coefficient of 0.0043 for medium
earnings (UE) are as defined earlier, and i (j) represents the and large firms. Hence, the evidence in Table 8 is consistent
sample of announcing (or non-announcing) firms. The magni- with a multilateral perspective on the differential size-related
tude of the announcing firms’ earnings response coefficients is information hypothesis, and with more price informative
earn-portrayed in Figure 1. Notice that the smaller firms’ coefficient ings reports from smaller firms (both for own-firm’s and other
(0.008) is about double that of both medium (0.004) and firms’ stock valuation).
large (0.004) firms. Hence, this result is consistent with the Overall, the results in Tables 6, 7, and 8 and Figures 1
differential information hypothesis. and 2, indicate that earnings reports of smaller firms elicit a
Estimates of the earnings (information transfer) response greater market reaction (and explain more than twice the
coefficient for the three size groups are portrayed in Figure cross-sectional variation in stock price reaction) than do
earn-2. Similar to that observed for announcing firms, the earnings ings reports from other than small firms. Hence, not only is
information transfer coefficient for small firms (0.0026) is the information content of a firm’s earnings report inversely
over four times that of medium (0.0001) and large (0.0006) related to its size, but so to are its earnings information
trans-firms. To test the significance of this differential earnings fers to other firms. These findings are consistent with different
reaction by smaller firms we employ the following regression levels of predisclosure information production and
dissemina-model [Eq. (4)]: tion by private parties for firms of different sizes.
CARj5aˆ 1cˆ · SMALLi1bˆ · UEi
Size of the Non-Announcing Firm
1 dˆ · UEi· SMALLi1 ej (4)
Consistent with prior research on the size-related differential
where SMALLiis an indicator variable that takes the value 1
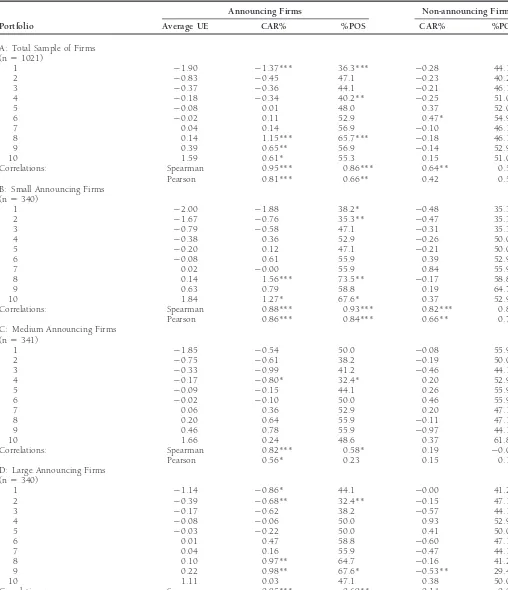
Table 6. Correlation between Unexpected Earnings and Abnormal Stock Returnsa
Announcing Firms Non-announcing Firms
Portfolio Average UE CAR% %POS CAR% %POS
A: Total Sample of Firms (n51021)
1 21.90 21.37*** 36.3*** 20.28 44.1
2 20.83 20.45 47.1 20.23 40.2*
3 20.37 20.36 44.1 20.21 46.1
4 20.18 20.34 40.2** 20.25 51.0
5 20.08 0.01 48.0 0.37 52.0
6 20.02 0.11 52.9 0.47* 54.9
7 0.04 0.14 56.9 20.10 46.1
8 0.14 1.15*** 65.7*** 20.18 46.1
9 0.39 0.65** 56.9 20.14 52.9
10 1.59 0.61* 55.3 0.15 51.0
Correlations: Spearman 0.95*** 0.86*** 0.64** 0.56*
Pearson 0.81*** 0.66** 0.42 0.55*
B: Small Announcing Firms (n5340)
1 22.00 21.88 38.2* 20.48 35.3
2 21.67 20.76 35.3** 20.47 35.3
3 20.79 20.58 47.1 20.31 35.3
4 20.38 0.36 52.9 20.26 50.0
5 20.20 0.12 47.1 20.21 50.0
6 20.08 0.61 55.9 0.39 52.9
7 0.02 20.00 55.9 0.84 55.9
8 0.14 1.56*** 73.5** 20.17 58.8
9 0.63 0.79 58.8 0.19 64.7*
10 1.84 1.27* 67.6* 0.37 52.9
Correlations: Spearman 0.88*** 0.93*** 0.82*** 0.89***
Pearson 0.86*** 0.84*** 0.66** 0.77***
C: Medium Announcing Firms (n5341)
1 21.85 20.54 50.0 20.08 55.9
2 20.75 20.61 38.2 20.19 50.0
3 20.33 20.99 41.2 20.46 44.1
4 20.17 20.80* 32.4* 0.20 52.9
5 20.09 20.15 44.1 0.26 55.9
6 20.02 20.10 50.0 0.46 55.9
7 0.06 0.36 52.9 0.20 47.1
8 0.20 0.64 55.9 20.11 47.1
9 0.46 0.78 55.9 20.97 44.1
10 1.66 0.24 48.6 0.37 61.8
Correlations: Spearman 0.82*** 0.58* 0.19 20.02
Pearson 0.56* 0.23 0.15 0.15
D: Large Announcing Firms (n5340)
1 21.14 20.86* 44.1 20.00 41.2
2 20.39 20.68** 32.4** 20.15 47.1
3 20.17 20.62 38.2 20.57 44.1
4 20.08 20.06 50.0 0.93 52.9
5 20.03 20.22 50.0 0.41 50.0
6 0.01 0.47 58.8 20.60 47.1
7 0.04 0.16 55.9 20.47 44.1
8 0.10 0.97** 64.7 20.16 41.2
9 0.22 0.98** 67.6* 20.53** 29.4*
10 1.11 0.03 47.1 0.38 50.0
Correlations: Spearman 0.85*** 0.69** 20.14 20.08
Pearson 0.53 0.33 0.12 0.14
aCumulative abnormal returns (CAR) and unexpected earnings (UE) are defined in Equations (2) and (3), respectively. The %POS is the percent of positive CAR in each portfolio.
At-test and binomial test is conducted on each portfolio for the null hypothesis of (1) CAR equal to zero, and (2) %POS equal to the firms’ %POS sample proportion, respectively. Spearman and Pearson correlations are computed between UE and (1) announcing firms’ CAR and %POS, and (2) non-announcing firms’ CAR and %POS.
Table 7. Individual Firm Correlations
Correlation Correlation (UE, CARA) (UE, CARNA)
Firm Size Spearman Pearson Spearman Pearson
Small 0.23*** 0.21*** 0.13*** 0.12**
Medium 0.14*** 0.12** 0.01 0.00
Large 0.21*** 0.10* 20.01 0.01
dollar market value of the firm which released the earnings report. Yet a multilateral view of stock price determination,
Figure 2. Non-Announcing firms’ transfer coefficient (multiplied in consideration of the size-related information hypothesis,
by 10). implies no preference to announcing firm’s size relative to
non-announcing firm’s size. Rather, information linkages, whether or not tied to a firm’s own disclosures or to those of
The regression results, presented in panel A of Table 9, other firms, will generate search activities by private parties
indicate that the size of the non-announcing firm is inversely based on expected trading profits. This implies that the
infor-related to the magnitude of earnings information transfers. mation conveyed to the market by accounting disclosures is
Specifically, the earnings information transfer coefficient for not related solely to announcing firm size but also to the size
small firms, bˆ1 dˆ 5 0.0033, represents a nearly four-fold
of the non-announcing firm. That is, an investor’s information
increase over the information transfer coefficient of 0.0009 search activities (including that of earnings information
trans-for other firms. This difference is significant at the 0.08 level. fers) are also dependent on non-announcing firm size, and
For the announcing firms, the earnings response coefficient are pursued so long as their costs do not exceed their expected
of small firms, 0.0046, is not significantly different from that trading profit.
for other firms (0.0053). To test this hypothesis we employ the following regression
Finally, the multilateral view of the information hypothesis model [Eq. (5)]:
predictably suggests that both announcer’s and
non-announc-CARj(or CARi)5aˆ 1cˆ · SMALLj1bˆ · UEi er’s size are important in predicting the level of predisclosure
information production and dissemination by private parties.
1 dˆ · UEi· SMALLj1 ej (or i) (5)
To address this hypothesis we examine the following
regres-where SMALLjis an indicator variable that takes the value 1 sion model [Eq. (6)]:
if the non-announcing firm is small, and the value 0 otherwise.
CARj(or CARi)5aˆ01aˆ1 · (SixMLj)
Small non-announcing firms are defined in the same manner
as small announcing firms (i.e., the smallest one-third of 1 aˆ2· (MLixSj)1 aˆ3· (SixSj)1bˆ0· UEi
firms). Cumulative abnormal returns (CAR) and unexpected
1 bˆ1 · UEi· (SixMLj)1bˆ2· UEi· (MLixSj) earnings (UE) are as defined earlier, and j represents the
non-announcing firm. Our size-related information hypothesis pre- 1 bˆ3 · UEi· (SixSj)1 ej (or i) (6)
dicts that dˆ will be significantly greater than zero (i.e., earnings
where (SixMLj) takes the value 1 if the announcing firm is
reports are more price informative for firm’s associated with
small and the non-announcing firm is either medium or large, small non-announcing firms).
and the value 0 otherwise; (MLixSj) takes the value 1 if the announcing firm is medium or large and the non-announcing firm is small, and the value 0 otherwise; and (SixSj) takes the value 1 if both announcing and non-announcing firms are small, and the value 0 otherwise. Small announcing and non-announcing firms are comprised of the smallest one-third of firms. Cumulative abnormal returns (CAR) and unexpected earnings (UE) are as defined earlier, and i (j) represents the announcing (non-announcing) firm. The size-related
informa-tion hypothesis predicts that b3 is significantly greater than
zero; i.e., earnings disclosures from small announcing firm’s, which are jointly associated with small non-announcing firms, are more price informative.
The regression results, shown in panel B of Table 9, support the hypothesis that joint consideration of announcing and
Table 8. Regression Results for Earnings Response Coefficients by Firm Sizea
A: Earnings Information Transfer Coefficient Results
Model: CARj5aˆ1cˆ · SMALLi1bˆ · UEi1dˆ · UEi· SMALLi1e
j
Predicted Sign n.a. n.a. n.a. Positive
Sample F-Ratio
aˆ cˆ bˆ dˆ size R2% (sig. level)
Non-Announcing 20.0005 0.0010 0.0003 0.0023 1,021 0.38 1.30
Firms (20.52) (0.60) (0.20) (1.23) (0.27)
B: Earnings Response Coefficient Results
Model: CARi5eˆ1fˆ · SMALLi1gˆ · UEi1hˆ · UEi· SMALLi1ei
Predicted Sign n.a. n.a. Positive Positive
Sample F-Ratio
eˆ fˆ gˆ hˆ size Ra2% (sig. level)
Announcing 20.0003 0.0038 0.0043 0.0042 1,021 2.97 10.37
Firms (20.21) (1.69)* (2.48)*** (1.71)** (0.01)
aCumulative abnormal returns (CAR) and unexpected earnings (UE) are defined in Equation (2) and section 3, respectively. SMALL is an indicator variable that takes the value 1
if the earnings announcement is from a small firm, and the value 0 otherwise. Parameter estimates andt-statistics (in parentheses) are presented for each regression. *(**/***) designates statistical significance at the 0.10 (0.05/0.01) level; significance levels are for two-tailed tests unless the parameter’s sign is predicted, then one-tailed.
non-announcing firm size is important for the informativeness where LCVi(LCVj) is the natural logarithm of the market value
of equity for announcing (non-announcing) firm i (j) at the of earnings disclosures. Specifically, the information transfer
coefficient for small non-announcing firms, bˆ01bˆ350.0042, beginning of the period. The size-related differential
informa-tion hypothesis predicts that both bˆ and cˆ are negative—sug-is more than twice the next largest information transfer
coeffi-cient (i.e., the relation between small announcer’s and me- gesting an inverse relation between firm size and the
multilat-eral price informativeness of earnings reports. The regression dium/large non-announcer’s yields the next largest transfer
coefficient of 0.0018). Similarly, the earnings response coeffi- results, shown in Table 10, generally support this hypothesis.
Specifically, announcing firms’ price revaluations are inversely
cient for small announcing firms, bˆ01bˆ350.0093, is 25%
larger than the next highest earnings response coefficient. In related to the size of both announcing and non-announcing
firms; i.e., the estimated coefficients for both bˆ and cˆ,20.2061 summary, the multilateral stock price informativeness of firms’
earnings reports is inversely related to the size of both an- and20.0455, respectively, are significantly less than zero at
the 0.10 level. Hence, this finding extends current evidence in nouncing and non-announcing firms.
this area to show that the magnitude of announcing firms’ stock price revaluations to earnings reports are dependent on the size
Stock Returns Variability
of both announcing and non-announcing firms. Prior researchhad not considered the size of the non-announcing firms for The variability of abnormal returns associated with earnings
the informativeness of the announcing firm’s earnings reports. releases offers an alternative measure for purposes of testing
The price revaluations for non-announcing firms, shown this article’s primary hypothesis. Specifically, we compute a
in the bottom half of Table 10, are mixed. Specifically, non-stock price Revaluation Index (RI) similar to that used by
announcing firms’ price revaluations are inversely related to Atiase (1985), Foster (1981), and others as follows [Eq. (7)]:
the size of non-announcing firms; i.e., the estimate of cˆ,
20.0259, is significantly less than zero at the 0.10 level.
RIi5(1/2)
o
0
t521 {[u2
i,t(Ti2 4)]/[s2i (Ti22)]} (7)
However, non-announcing firms’ price revaluations are not related to the size of announcing firms; i.e., the estimate of
where si2 is the variance of the market model’s residual ui
bˆ is not significantly different from zero at any conventional
during the estimation period, Ti is the number of available
level. Nevertheless, the overall tenor of the findings for firms’ returns in firm i’s estimation period, the cumulation period
price revaluations is consistent with the differential
informa-is {21,0}, and ui,tis as defined in Equation (1). Revaluation
tion hypothesis.
indexes are also computed for non-announcing firms (RIj) in
The analyses are extended to examine the price revaluations the same manner.
of the smaller one-third of firms vis-a-vis medium and large To test the general relation between price revaluations,
firms. A comparison of the price revaluations of small firms earnings reports, and firm size, we employ the following
re-with all other firms, portrayed in Figures 3 and 4, supports gression model [Eq. (8)]:
the differential information hypothesis. The results in Figure 3, where size is defined using non-announcing firms, indicate
283
and
Earnings
Information
J
Busn
Res
2000:49:273–288
Table 9. Earnings Response Coefficients by Size of Announcing and Non-Announcing Firmsa
A: Earnings Response Conditional on Size of Non-Announcing Firms
Model: CARj(or i)5aˆ1cˆ · SMALLj1bˆ · UEi1dˆ · UEi· SMALLj1ej (or i)
Predicted Sign n.a. n.a. n.a. Positive
Sample F-Ratio
aˆ cˆ bˆ dˆ size R2% (sig. level)
Non-Announcing 20.0006 0.0004 0.0009 0.0024 2,585 0.26 2.22
Firms (20.70) (0.29) (0.98) (1.41)* (0.08)
Announcing 0.0003 0.0024 0.0053 20.0007 2,585 1.90 16.67
Firms (0.34) (1.73)* (5.85)*** (20.44) (0.01)
B: Earnings Response Conditional on Size of Both Announcing and Non-Announcing Firms
Model: CARj (or i)5aˆo1aˆ1· (SixMLj)1aˆ2· (MLixSj)1aˆ3· (SixSj)1bˆo· UEi1bˆ1· UEi· (SixMLj)1bˆ2· UEi· (MLixSj)1bˆ3· UEi· (SixSj)1ej (or i)
Predicted Sign n.a. n.a. n.a. n.a. n.a. n.a. n.a. Positive
Sample F-Ratio
aˆ0 aˆ1 aˆ2 aˆ3 bˆ0 bˆ1 bˆ2 bˆ3 size R2% (sig. level)
Non-Announcing 20.0009 20.0001 0.0001 0.0031 0.0008 0.0010 0.0001 0.0034 2,585 0.35 1.28
Firms (20.76) (20.04) (0.08) (1.44) (0.51) (0.43) (0.05) (1.46)* (0.26)
Announcing 20.0011 0.0044 0.0008 0.0091 0.0034 0.0040 20.0010 0.0059 2,585 3.02 11.48
Firms (21.07) (2.29)** (0.53) (4.57)*** (2.36)** (1.92)* (20.48) (2.75)*** (0.01)
aCumulative abnormal returns (CAR) and unexpected earnings (UE) are defined in Equation (2) and section 3, respectively. SMALL takes the value 1 if the announcing firm is small, and zero otherwise; (SixMLj) takes the value
1 if the announcing firm is small and the non-announcing firm is either medium or large, and zero otherwise; (MLixSj) takes the value 1 if the announcing firm is medium or large and the non-announcing firm is small, and zero
otherwise; and (SixSj) takes the value 1 if both announcing and non-announcing firms are small, and zero otherwise. Parameter estimates andt-statistics (in parentheses) are presented for each regression.
Table 10. Regression of Price Revaluations on the Size of Announcing and Non-Announcing Firmsa
Model: RIi (or j)5aˆ1bˆ · LCVi1cˆ · LCVj1ei (or j)
Predicted Sign n.a. Negative Negative
Sample F-Ratio
aˆ bˆ cˆ size R2% (sig. level)
Announcing 3.9386 20.2061 20.0455 3,702 1.01 18.88
Firms (Ri) (9.78) (25.81)*** (21.28)* (0.01)
Non-Announcing 1.3490 0.0069 20.0259 3,702 0.06 1.10
Firms (Rj) (6.72) (0.39) (21.47)* (0.33)
aStock Price Revaluations (RI) are defined in Equation (7). LCV
i (or j)is the natural logarithm of the market value of equity for announcing (non-announcing) firm i (j) at the beginning
of the period. Parameter estimates andt-statistics (in parentheses) are presented for each regression.
*(**/***) designates statistical significance at the 0.10 (0.05/0.01) level; significance levels are for two-tailed tests unless the parameter’s sign is predicted, then one-tailed.
that: (1) price revaluations of small announcing firms (2.14) that the magnitude of non-announcing firms’ price
revalua-exceeds that of medium and large firms (1.70), and (2) price tions is not related to the size of announcing firms.
revaluations of small non-announcing firms (1.33) exceeds that of medium and large firms (1.12). The results in Figure
Additional Determinants of
4, dependent on announcing firm size, show that price
revalu-ations for small announcing firms (2.57) exceeds that of me-
Earnings Informativeness
dium and large firms (1.51); however, the price revaluations
Number of Analysts’ Forecasts
of small non-announcing firms (1.14) are similar to that forIn the analysis to this point, firm size is the only proxy used medium and large firms (1.18).
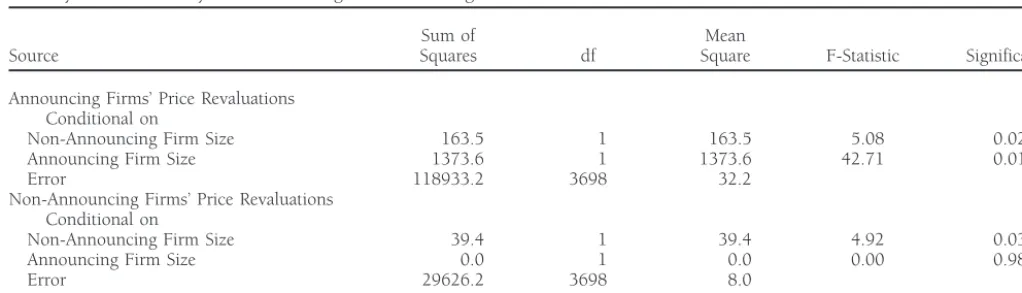
to reflect the amount of information production and dissemi-Test results of the statistical significance of the differences
nation directed at a firm by private parties. Another measure represented in Figures 3 and 4 are shown in Table 11. The
which has been examined, and found to be inversely related results of an ANOVA analysis, shown in panel A of Table 11,
to stock price revaluations to earnings reports, is the number
indicate that the size of both non-announcing (F55.08,p5
of analysts’ earnings forecasts for a specific firm.
0.02) and announcing (F542.71,p50.01) firms are related
Both Dempsey (1989) and Lobo and Mahmoud (1989) find to the magnitude of announcing firms’ price revaluations. The
that the price informativeness of earnings is inversely related lower half of panel A of Table 11 indicates that the size of
to the number of analysts following. Bhushan (1989) and
non-announcing firms (F54.92,p50.03), but not
announc-O’Brien and Bhushan (1990) report some evidence on the
deter-ing firms (F50.00,p50.98), is related to non-announcing
minants of analyst following. Schipper (1991) and Brown firms’ price revaluations. Hence, the size of non-announcing
(1993) provide an extensive review of analyst forecast research. firms, and to a lesser extent the size of announcing firms, is
Like firm size, the measure of the number of analysts’ a significant determinant of the multilateral price
informa-forecasts attempts to discriminate among firms on the basis tiveness of earnings reports.
of the number (proportion) of informed traders who actively
The multiple comparisont-tests, shown in panel B of Table
participate in the market for a particular stock (e.g., see Verrec-11, support the ANOVA results and are consistent with the
differential information hypothesis. That is, firm size is in- chia, 1982). Accordingly, we consider its implications for the
versely related to the magnitude of price revaluations for both empirical evidence in this article.
announcing and non-announcing firms. The one exception is The measure of the number of analysts’ forecasts is obtained
Figure 4. Price revaluations to earnings (based on announcing
Figure 3. Price revaluations to earnings (based on non-announcing
Table 11. Price Revaluations by Firm Size
A: Analysis of Variance by Non-Announcing and Announcing Firm Size
Sum of Mean
Source Squares df Square F-Statistic Significance
Announcing Firms’ Price Revaluations Conditional on
Non-Announcing Firm Size 163.5 1 163.5 5.08 0.02
Announcing Firm Size 1373.6 1 1373.6 42.71 0.01
Error 118933.2 3698 32.2
Non-Announcing Firms’ Price Revaluations Conditional on
Non-Announcing Firm Size 39.4 1 39.4 4.92 0.03
Announcing Firm Size 0.0 1 0.0 0.00 0.98
Error 29626.2 3698 8.0
B: Multiple Comparisont-Tests of Price Revaluations
Average Price Revaluation Medium &
Small Large t-Statistic Significance
Announcing Firms’ Price Revaluations Conditional on
Non-Announcing Firm Size 2.135 1.696 2.21 0.01
Announcing Firm Size 2.566 1.511 3.44 0.01
Non-Announcing Firms’ Price Revaluations Conditional on
Non-Announcing Firm Size 1.329 1.121 2.11 0.02
Announcing Firm Size 1.136 1.177 0.41 0.34
from the I/B/E/S database. Similar to our partitioning of the reflect distinct underlying economic forces in determining the
sample on firm size, we attempt to identify approximately informativeness of earnings reports.
one-third of firms with the fewest number of analysts’
fore-casts. Since the criterion that firms have either one or two
Number of Lines of Business
analysts’ forecasts (as representative of a set of firms which
In this article, earnings information transfers are examined had little information production and dissemination activities
for those firms which have common earnings determinants— directed at it from private parties) yields a sub-sample
com-where four-digit SIC codes serve as a proxy of this categoriza-prising 29% of the total firms, it is used to stratify the sample.
tion. [Brown, Richardson, and Schwager (1987) and Kross, We then replicate the earlier test procedures with the number
Ro, and Schroeder (1990) use the number of lines of business of analysts’ forecasts substituted for firm size. Moreover, the
to proxy for the correlation among information variables.] joint explanatory power of the two proxies is investigated.
Since small firms are likely less diversified in their operations, The results indicate that number of analysts’ forecasts for
earlier earnings information transfer results by firm size might announcing firms is inversely related to the stock price
revalu-reflect the greater commonalities among small firms (i.e., a ations of announcing firms, but it is not related to earnings
four-digit industry comprised of small firms has a higher information transfers. As representative of our findings, panel
likelihood of common earnings determinants than an industry A of Table 12 shows the analysis of variance for stock price
comprised of large diversified firms). To examine for this revaluations where both the number of analysts’ forecasts
possibility, we replicate earlier tests where firms are parti-and firm size are jointly considered. For announcers’ price
tioned by their number of lines of business; those firms listed revaluations (RIi), the number of analysts’ forecasts for the
in more than two industries (55% of the original sample) are
announcing firms is significant (F52.81,p5 0.09) in
ex-considered more diversified, whereas firms listed in one or plaining RIi, while the number of forecasts for non-announcers
two industries are considered less diversified. We use the
is not (F 5 1.24, p 5 0.27). On the other hand, neither
Compustat Industry Segment Fileto obtain these data. variable is significant at any conventional level in explaining
The results show that diversification of operations, as prox-non-announcers price revaluations (RIj). Hence, firm size and
Table 12. Price Revaluations by Firm Size, Analysts Following, and Line of Business
A: Analysis of Variance by Firm Size and the Number of Analysists Forecasts for the Firm
Sum of Mean
Source Squares df Square F-Statistic Significance
Announcing Firms’ Price Revaluations Conditional on
Analysts following Non-Announcers 39.9 1 39.9 1.24 0.27
Analysts following Announcers 90.4 1 90.4 2.81 0.09
Non-Announcing Firm Size 163.5 1 163.5 5.09 0.02
Announcing Firm Size 1373.6 1 1373.6 42.73 0.01
Error 118802.9 3696 32.1
Non-Announcing Firms’ Price Revaluations Conditional on
Analysists following Non-Announcers 0.2 1 0.2 0.03 0.87
Analysts following Announcers 1.8 1 1.8 0.23 0.64
Non-Announcing Firm Size 39.4 1 39.4 4.91 0.03
Announcing Firm Size 0.0 1 0.0 0.00 0.98
Error 29624.2 3696 8.0
B: Analysis of Variance by Firm Size and the Number of Lines of Business for the Firm
Announcing Firms’ Price Revaluations Conditional on
Non-Announcers’ Lines of Business 86.6 1 86.6 2.70 0.10
Announcers’ Lines of Business 94.0 1 94.0 2.92 0.09
Non-Announcing Firm Size 163.5 1 163.5 5.09 0.02
Announcing Firm Size 1373.6 1 1373.6 42.75 0.01
Error 118752.6 3696 32.1
Non-Announcing Firms’ Price Revaluations Conditional on
Non-Announcers’ Lines of Business 1.4 1 1.4 0.17 0.68
Announcers’ Lines of Business 2.5 1 2.5 0.31 0.58
Non-Announcing Firm Size 39.4 1 39.4 4.92 0.03
Announcing Firm Size 0.0 1 0.0 0.00 0.98
Error 29622.4 3696 8.0
determinant of the magnitude of earnings information trans- summary regression results are displayed in Table 13.
Specifi-cally, small firms continue to be associated with significantly fers. The results in panel B of Table 12 are representative of
our findings. Specifically, non-announcing firms’ price revalu- greater price informative earnings reports. That is, the earnings
transfer coefficient for small non-announcing and announcing ations are not related to either the number of announcers’
lines of business (F50.31,p50.58) or to the non-announc- firms, bˆ01 bˆ35 0.0048, is over 50% greater than the next
largest transfer coefficient; and the earnings response
coeffi-ers’ number of lines of business (F50.17,p50.68). Hence,
the differences in earnings information transfers across firm cient for small non-announcing and announcing firms, bˆ01
bˆ3 5 0.0057, is 10% greater than the next largest response
size are not explained by the number of lines of business in
which the firm operates. coefficient. Hence, the greater stock price informativeness of
earnings reports from small firms is unrelated to the earnings expectations model.
Random Walk Earnings Expectations
The earlier correlation analyses between cumulative abnormal
returns and unexpected earnings relied on analysts’ forecasts
Summary and Conclusions
as earnings expectations in computing unexpected earnings.
The widely accepted conceptualization of asset pricing views We examine the sensitivity of relying on analysts’ forecasts
firms’ stock prices as a function of all information available by replicating earlier tests using a random walk with drift
to market participants. Yet due to different incentives for earnings expectation in lieu of analysts’ forecasts.
information search, the level of predisclosure information pro-The results indicate that the inferences drawn from earlier
duction and dissemination by private parties is inversely re-tests are not sensitive to the use of analysts’ forecasts as
of firms’ stock prices is positively related to firm size, and the information conveyed to the market by accounting disclosures is inversely related to size. This phenomenon is referred to as the size-related differential information hypothesis. Prior research provides evidence consistent with this hypothesis in that a firm’s stock price reaction to its own earnings report is inversely related to its own size.
This article extends prior research and investigates the empirical validity of the size-related differential information hypothesis from a multilateral view of firms’ disclosures and the determination of stock prices. This multilateral view im-plies that the price informativeness of earnings reports is in-versely related to the size of the disclosing firm and to the size of other firms that possess common determinants of earn-ings (i.e., those firms with significant cross-sectional covaria-tion in returns). We hypothesize that the magnitude of stock price revaluations to earnings reports for both the disclosing firm (information content), and to other firms with common earnings determinants (information transfers), is inversely re-lated to firm size.
Market reactions to earnings reports are shown to be in-versely related to firm size. Unexpected earnings explain more than three times the cross-sectional variation in stock price reactions for small announcing and non-announcing firms relative to medium and large size firms. These findings are consistent with the stock price informativeness of earnings reports being inversely related to firm size. Moreover, the results are fairly consistent across alternative test procedures and statistics which employ both announcing and non-an-nouncing firm size. We interpret these results as reflective of differential predisclosure information production and dissem-ination by private parties, which is positively related to size, yielding earnings reports whose price informativeness is in-versely related to firm size.
Further tests indicate that the informativeness of earnings is jointly determined by both announcing and non-announcing firm size. This result is consistent with the multilateral view of the differential information hypothesis and the determina-tion of stock prices. In addidetermina-tion, while the primary emphasis was on (directional) abnormal return behavior, analyses of firms’ stock return variances are shown to yield similar results. Several different sensitivity checks of the analysis provide evidence consistent with the main test results and with our primary hypothesis.
Finally, this article, like its predecessors, is motivated by a desire to understand the fundamental firm characteristics that determine the usefulness of earnings. Contemporary port-folio theory emphasizes the resolution of investment decisions in terms of covariances among firms. Hence, the usefulness of earnings depends on its value for investors in estimating portfolio covariances and risk. Own-firm’s stock price infor-mativeness of earnings is only one factor in this multilateral approach to price determination. The multilateral approach
Table
Security Returns For Large and Small Firms.Journal of Accounting
identification of the determinants of earnings usefulness. This
and Economics9 (July 1987): 195–228.
article’s analysis of the informativeness of earnings is patterned
Freeman, R. N., and Tse, S.: An Earnings Prediction Approach to in this mold.
Examining Intercompany Information Transfer. Journal of
Ac-counting and Economics15 (December 1992): 509–523.
The helpful comments from Larry Brown, Larry Mohrweis, Jamie Pratt, Jerry
Hagerman, R. L., Zmijewski, M. E., and Shah, P.: The Association Salamon, and seminar participants at Indiana University, SUNY-Buffalo, and
between the Magnitude of Quarterly Earnings Forecast Errors The University of Wisconsin are gratefully acknowledged. Jerry Han
acknowl-and Risk-Adjusted Stock Returns.Journal of Accounting Research
edges financial support from Price Waterhouse, and John Wild acknowledges
22 (Autumn 1984): 526–540. financial support from the Vilas Research Program.
Han, J. C. Y., and Wild, J. J.: Unexpected Earnings and Intraindustry Information Transfers: Further Evidence. Journal of Accounting
References
Research28 (Spring 1990): 211–219.Atiase, R. K.: Predisclosure Information, Firm Capitalization and Han, J. C. Y., Wild, J. J., and Ramesh, K.: Managers’ Earnings Fore-Security Return Behavior Around Earnings Announcements.Jour- casts and Intra-Industry Information Transfers.Journal of
Account-nal of Accounting Research23 (Spring 1985): 21–36. ing and Economics11 (January 1989): 3–33.
Baginski, S. P.: Intraindustry Information Transfers Associated with Harris, M.:Dynamic Economic Analysis, Oxford University Press, New Management Forecasts of Earnings.Journal of Accounting Research York. 1987.
25 (Spring 1987): 196–216. Holthausen, R. W., and Verrecchia, R. E.: The Effect of Sequential Ball, R., and Foster, G.: Corporate Financial Reporting: A Method- Information Releases on the Variance of Price Changes in an ological Review of Empirical Research.Journal of Accounting Re- Intertemporal Multi-Asset Market.Journal of Accounting Research
search20 (Supplement 1982): 161–234. 26 (Spring 1988): 82–106.
Beaver, W. H., Clarke, R., and Wright, W. F.: The Association be- Kross, W., Ro, B., and Schroeder, D.: Earnings Expectations: The tween Unsystematic Security Returns and the Magnitude of Earn- Analysts’ Information Advantage. Accounting Review 65 (April ings Forecast Errors.Journal of Accounting Research17 (Autumn 1990): 461–476.
1979): 316–340. Lobo, G., and Mahmoud, A.: Relationship between Differential Bhushan, R.: Firm Characteristics and Analyst Following.Journal of Amounts of Prior Information and Security Return Variability.
Accounting and Economics11 (1989): 255–274. Journal of Accounting Research27 (Spring 1989): 116–134.
Brown, L. D.: Earnings Forecasting Research: Its Implications for O’Brien, P., and Bhushan, R.: Analyst Following and Institutional Capital Markets Research.International Journal of Forecasting 9 Ownership.Journal of Accounting Research28 (Supplement 1990):
(1993): 295–320. 55–76.
Brown, L. D., Richardson, G. D., and Schwager, S. J.: An Information Olsen, C., and Dietrich, R.: Vertical Information Transfers: The Asso-Interpretation of Financial Analyst Superiority in Forecasting ciation between Retailers’ Sales Announcements and Suppliers’ Earnings.Journal of Accounting Research25 (Spring 1987): 49–67. Security Returns. Journal of Accounting Research (Supplement
1985): 144–169. Clinch, G. J., and Sinclair, N. A.: Intra-Industry Information Releases:
A Recursive Systems Approach.Journal of Accounting and Econom- Pownall, G., and Waymire, G.: Voluntary Disclosure Choice and
ics9 (April 1987): 89–106. Earnings Information Transfer. Journal of Accounting Research
(Supplement 1989): 85–105. Collins, D. W., Kothari, S. P., and Rayburn, J. D.: Firm Size and the
Information Content of Prices with Respect to Earnings.Journal Pyo, Y., and Lustgarten, S.: Differential Intra-Industry Information
of Accounting and Economics9 (July 1987): 111–138. Transfer Associated with Management Earnings Forecasts.Journal
of Accounting and Economics13 (1990): 365–379.
Dempsey, S.: Predisclosure Information Search Incentives, Analyst
Following, and Earnings Announcement Price Response.Account- Schipper, K.: Information Transfers.Accounting Horizons4 (December
ing Review64 (October 1989): 748–757. 1990): 97–107.
Foster, G.: Intra-Industry Information Transfers Associated with Schipper, K.: Analysts’ Forecasts.Accounting Horizons5 (December Earnings Releases.Journal of Accounting and Economics3 (Decem- 1991): 105–121.
ber 1981): 201–232. Verrecchia, R.: Information Acquisition in a Noisy Rational Expecta-tions Economy.Econometrica50 (1982): 1415–1430.