Segmentation and Explain Switching Behavior
Antreas D. Athanassopoulos
WARWICKBUSINESSSCHOOL,COVENTRY,UKIn this paper, customer satisfaction cues in retail banking services in Greece to be positioned in view of existing literature but also to be are examined. The study proposes an instrument of customer satisfaction differentiated in order to be able to adapt to different business that contains service quality and such other attributes as price, conve- environments. This reflects the position of Brown, Churchill, nience, and innovation. The proposed framework of customer satisfaction and Peter (1993). In this paper, customer satisfaction cues in was verified empirically yielding four distinct facets for business customers retail and banking services in Greece are examined. Therefore, and five for individual customers. The performance implications of the the conceptual part of the study is customized in the context customer satisfaction instrument are also explored. What is shown is that of financial services as organized within the Greek national customer segments, in fact, yield statistically different satisfaction scores, framework.
which verifies the managerial value of customer segmentation practices. Apart from measurement issues, the real value of quality Finally, the facets of customer satisfaction as explanatory cues for the emanates from its decision-making implications. Service qual-switching behavior of individual and business customers were tested suc- ity can be used as a vehicle of strategic marketing as either cessfully. J BUSN RES2000. 47.191–207. 1999 Elsevier Science Inc. offensiveordefensivemarketing policies. The offensive scenario
closely resembles the long-standing connection between ad-vertising and sales. There are compelling arguments in the literature advocating the superiority of defensive strategies
T
he endeavor to establish service quality as a key compo- over offensive ones for particular types of organizations (Rust nent of the managerial agenda has been successful, and Zahorik, 1993). Furthermore, the strategic marketing ori-(Parasuraman, Zeithaml, and Berry, 1985; Reichheld entation of a service firm is mostly determined by the scale and Sasser, 1990). Research has given the business world of its operations, its intermediate goals, and life cycle of opera-many instruments to assess the effect of service quality both tion. An instance where defensive marketing strategy seems on customers and service providers. The establishment of this to be more attractive is that of the National Bank of Greece issue in services management has called for new research (40% of total deposits across the Greek banking industry) in regarding the intended and unintended consequences of ser- contrast to the strategy of the newer retail banks that began vice quality on the whole range of organizational behavior. operations in Greece 1991. Regardless of the specific tools and Latest research reports concentrate on the effect of service methods a firm adopts or what quality experts an organization quality on alternative performance dimensions of the organiza- follows, managing for quality and competitive advantage has tion (see Greising, 1994; Rust, Zahonik, and Keiningham, the adoption of customer orientation as a prerequisite (Leng-1995; Athanassopoulos, 1997). nick-Hall, 1996).The development of measurement instruments of service The present research seeks to contribute in several ways. quality and customer satisfaction and the subsequent research First, customer satisfaction has been adopted as the main dialogue regarding the appropriateness of these instruments dependent variable of the service encounter as opposed to is far from conclusive (Cronin and Taylor, 1992; Parasuraman, the more restrictive service quality instrument applied in retail Zeithaml, and Berry, 1992). The strong effect of context and banking institutions. In effect, all aspects of customer– content of application, however, leaves little leverage for uni- provider conduct, including service quality, convenience, and versal measures of service quality and satisfaction. What re- pricing, were considered as distinct dimensions of customer mains therefore, is not only for any measurement instrument satisfaction. The frame of reference is the banking industry of the country as a whole and not a single service provider within the industry, as is usual in many research studies.
Address correspondence to Antreas D. Athanassopoulos, 38 L. Ionias, 10446,
Athens, Greece. Facets of customer satisfaction are also used in two
perfor-Journal of Business Research 47, 191–207 (2000)
1999 Elsevier Science Inc. All rights reserved. ISSN 0148-2963/00/$–see front matter
mance-related roles. That is, there has been an attempt to ships, and second, their performance implications. One key investigate hypotheses concerning the differential satisfaction characteristic of this discussion has been expectancy-theoreti-profile of different customer segments. It was found that the cal models with the explicit recognition that service quality segmentation of the customer base revealed information about assessment should be considered to be a measure of the differ-the behavioral patterns of individual and business customers ence between customer expectations and customer percep-that would otherwise have been masked under a universal tions. The lively debate regarding the adequacy of assessing assessment of satisfaction scores. Because customer segmenta- service quality and customer satisfaction has led to the devel-tion is a focal point of research debate (Wensley, 1995; Saun- opment of such testing instruments as SERVQUAL by Parasur-ders, 1995), what this study brings to the debate is the external aman, Zeithame, and Berry (1985, 1988) and SERVPERF by validation offered by the statistical differences found in service Cronin and Taylor (1992). Another area of research has been satisfaction scores of different customer segments. The other identification of the antecedents of service quality and cus-important use of customer statistical measures concerns their tomer satisfaction. In that respect, the Parasuraman, Zeithaml, explanatory power in assessing switching behavior of individ- and Berry (1985) dimensions of service quality have been ual and business customers. The search of antecedents of thoroughly tested in different contextual environments across customer retention has revealed determinants related to both industries and national borders. Asubonteng, McCleary, and customer satisfaction and sociodemographic characteristics of Swan (1996) review empirical studies based upon the
SERV-customers. QUAL instrument and draw some more general conclusions
The paper is organized as follows. In the following section, about problem areas and managerial applications of the mea-the conceptual background of mea-the paper is discussed. The surement tool.
third section includes research propositions and hypotheses Empirical findings concerning facets of service quality indi-and information about the design of the empirical part of the cate acceptance of the SERVQUAL dimensions, subject to addi-paper. The fourth section discusses empirical results regarding tional dimensions that emanate from industry-specific contexts the antecedents of customer satisfaction in the Greek banking (Carman, 1990). Apart from studies adopting predetermined sector. In the fifth section, there is an attempt to segment the facets of service quality and customer satisfaction, the research samples of customers according to their behavioral patterns of Roth and Jackson (1995) and Ennew and Binks (1996) and then assess the mean satisfaction differences among these adopted tailor-made constructs of service quality and satisfac-segments. Furthermore, this section provides results regarding tion that applied to the retail banking industry. Furthermore, the predictive ability of the service satisfaction scores with Blanchard and Galloway (1994) developed a 31-item instru-respect to customer switching behavior. This is followed by ment for assessing quality in retail banking, emphasizing its
the conclusion. congruence with known constructs of quality measurement.
Akviran (1994), starting from PZB contentions, identified four key quality dimensions in banking—staff conduct, credibility,
Conceptual Background and
communication, and access to teller services. Four dimensions
Research Hypotheses
were also identified (physical features and facilities, reliability,conduct staff characteristics, and responsiveness) in a survey Management of customer orientation and service quality is
conducted in 31 major British organizations in the fields of commonly identified as one of the most effective means of
banking, building societies, and retail. building a competitive position in service industries, as well
Customer satisfaction is recognized as being highly associ-as improving organizational performance (Lewis, 1993). The
ated with “value,” and hence on “price”; whereas service qual-transition from transaction- to relationship-based marketing
ity is not generally considered to be dependent upon price (as recognized by Berry, 1995 and Gummeson, 1993) is
inex-tricably linked with the increased role of quality and satisfac- (Anderson, Fornell, and Lehmann, 1994). The more satisfied tion given in services. Relationship marketing requires the the customers the more tolerant to price increases (reduced integration of marketing, quality, and customer service (Chris- price elasticities) they are likely to be, thus resulting in greater topher, Payne, and Ballantyne, 1991). The apparent distinc- profits (Garvin, 1988). Customer satisfaction is based, concep-tion between core and over-all product is widely used in tually, on the amalgamation of service quality attributes with services to differentiate the outcome of the service (technical such attributes as price (Fornell, 1992; Lewis, 1993) and conve-quality) from the process of service delivery (functional qual- nience (Cronin and Taylor, 1992). This debate also draws on ity) (Bowen and Schneider, 1988, 1995; Lehtinen and Lehti- the five-dimensional instrument of Parasuraman, Zeithame, and
nen, 1991). Berry (1985) which evidently needs verification when applied
to particular industries (Schneider, 1990). Banking-specific
Content Effects
research by Laroshe, Rosenblatt and Manning (1986) revealed speed service, convenient location, staff competence, and bank The conceptual framework relating to the elements ofrelation-friendliness as important determinants of customer satisfac-ship marketing in services has been followed by intensive
a five-dimensional framework of customer satisfaction in the of service quality constructs as proposed by Babakus and Canadian credit sector, including such as factors corporate Bollen (1992) and Davis (1991). The latter is in contrast with image, internal organization, physical environment, staff ser- the research framework proposed by Parasuraman, Zeithamal, vice, and customer–personnel interaction. Finally, Rust and and Berry (1988), and it is supportive of a multidimensional Zahorick (1993) identified factors related to convenience, nature of service quality. We adopt here the contention of warmth, and easy checking as determinants of retail banking Babakus and Bollen by means ofH1d.
customer satisfaction. Notwithstanding the debate about the
H1d: In the context of the Greek retail banking environ-attributes (dimensions) of customer satisfaction, the follow
ment, service quality characteristics will be a simple proposition puts forward the idea of multidimensional
under-unidemensional construct in contrast to popular standing of service experience.
multidimensional constructs. P1: Customer satisfaction is a multidimensional construct
that is a direct result of the multiplicity and divergence
Contextual Effects
of customer expectations.There are advantages for marketers in understanding customer behavior, as Gilmour (1977), Webster (1989), and Pitt et al. The contention of the Nordic School (Lehtinen and
Lehti-(1992) pointed out; that is, certain customer groups may have nen, 1991) about “physical,” “interactive,” and “corporate”
quality seems to be flexible enough to allow for the accommo- different expectations and/or perceptions of service providers. dation of different perceptions. Corporate quality is considered Appreciation of segment-specific focus in satisfaction-related to be the global measure of quality offered by the bank and subjects can be found in the Ennew and Binks (1996) study, the way this is perceived by the customer. At this point, it is which focused on the behavioral intentions of particular busi-important to distinguish between controllable and uncontrol- ness segments of commercial banking customers. The segmen-lable components of service quality, bearing in mind the indi- tation question has also been raised indirectly by Pinson and cation of expected quality prior to purchase. Based on the Malholta (1987), and Turnbull and Gibbs (1987), who stressed previous proposition and the subsequent discussion, the fol- distinctive employee competencies as essential for the market-lowing research hypotheses can be stated concerning individ- ing of financial services to business customers. The segmenta-ual customers. tion question, thus, has two-way effects, because it affects both the product/service differentiation to fit different segment H1a: The satisfaction of individual customers is
encapsu-needs and also affects the selection of firm resources and lated in such dimensions as staff and physical service,
competencies to meet these requirements. corporate-, price-, convenience-, and
product-spe-The concern for services marketing and customer satisfac-cific characteristics (innovativeness).
tion has expanded in regulated or quasiregulated industries, And the following can be posited for business customers. where competition does not have the qualitative features we would expect in terms of full customer information and com-H1b: The satisfaction of business customers is
encapsu-petitive pricing. Financial services in Greece are typical; a lated in such dimensions as staff and physical service,
former oligopoly (e.g. three out of 21 commercial banks hold corporate-, price-, and product-specific
characteris-75% of total deposits) with increasing growth in competition tics (innovativeness).
and product variety. The dynamic character of services with The difference between individual and business customers is subsequent implications to marketing research has long being expressed as follows. recognized by such scholars as Lehtinen and Lehtinen (1991) and Gummesson (1993). They emphasize that, at different H1c: There are differences between the scores of each
cus-stages of the service process, different factors or even types tomer satisfaction facet, either within the same sample
of quality come into play. or of similar facets across different samples.
P2: In noncompetitive market conditions, custom loyalty H1aandbare in response to previous research arguments
conveys artificial information that relates merely to the wherein the measure of customer satisfaction and service
qual-limited choice available to customers. In such condi-ity should be sensitive to different industry and market
envi-tions, customer loyalty can be approximated by means ronments (Schneider and Bowen, 1990). The latter was also
of assessing satisfaction differences among groups of emphasized by Webster (1989) and Pitt et al. (1992), who
customers. pointed out that certain groups of customers may differ in
their perceptions of provided services.H1c seeks to qualify The propositions listed above are operationalized with the the previous two hypotheses by opening a research framework hypothesis regarding differences among customer segments. wherein the relative merits of each facet of customer
satisfac-H2: Distinct customer segments exhibit different service tion will be assessed. A by-product of the proposed structure
The dynamic relationship between customer satisfaction, profiles and also the way customers perceive the service offered.
service quality, and customer behavior (loyalty, switching, repurchasing) constitutes the second research area of
particu-The association between customer satisfaction and customer lar interest. Conceptual propositions regarding customer
loy-intention is as follows. alty and its antecedents can be found in Dick and Basu (1994).
The effect of quality on purchasing intentions is an issue H3a: Customer satisfaction attributes are associated with associated mainly with goods (Sambandam and Lord, 1995; customer decisions to remain loyal to their bank or Chang and Wildt, 1994) and less with service industries. to switch to the competing ones.
These types of models are appropriate for low-frequency
pur-H3b: Customers’ sociodemographic profile can be used to chasing but need refinements to explain the transition
behav-explain customers’ retention and switching behavior. ior in service situations where there are frequent
customer-service transactions.
Rust and Zahorick (1993), researching in a service context,
Empirical Results
emphasize the negative effects of customer switching onmar-Sample Selection and Respondents’ Profile
ket share and profitability. Losing customers not only leadsThe sample of customer responses was drawn from the general to opportunity costs because of lack of sales revenue, but also
area of Athens, the Greek capital. The localization of this to the cost of attracting new customers (offensive marketing),
sample permitted adequate representation of many new banks which includes promotion, discounts, effort to know customer
that are poorly represented in the rest of the country. The needs, and time to build sustainable relationships. The
reason-questionnaire included 26 question items (see Appendix) that ing behind customer switching behavior has been related to
sought to evaluate different aspects of the service encounter. perceptions of quality in the banking industry (Rust and
Za-The form of assessment adopted a disconfirmation paradigm horick, 1993), over-all dissatisfaction in the insurance industry
similar to that of Cronin and Taylor (1992, 1994) where the (Crosby and Stephens, 1987), and service encounter failures
primary concern is to avoid the separation between expecta-in retail expecta-industries (Kelley, Hoffman, and Davis, 1993).
tions and perceptions and instead to address the problem of Although service quality failures and dissatisfaction are
satisfaction with a single response. The question items were some reasons that motivate customers to switch services, they
phrased with the following expression, “From your experience do not encapsulate all of them. Bitner (1990) advocates the
with your primary bank, how do you rate the level of the effects of time, money constraints, access to information, lack
services provided as compared to your expectations?” A five-of credible alternatives, switching costs, and habit that might
point scale was used for measurement, with 1 “very dissatis-affect service loyalty. Along similar lines, Cronin and Taylor
fied” and 5 “very satisfied.” Additional questions were also (1992) suggest that convenience, price, and availability might
included to obtain information concerning the respondents’ enhance customer satisfaction and subsequent behavior.
Kea-veney (1995) developed a grounded model of customer characteristics.
switching behavior. In the latter model of customer switching General questions about the respondents’ profile differed behavior, eight main causal variables were proposed: price, for business and individual customers, because the nature inconvenience, core service failures, service encounter failures, of the questions was different. To increase the validity and competitive issues, ethical problems, and involuntary factors. reliability of the responses, all questionnaires were filled in Selnes (1993) explored the relationship between satisfac- by trained personnel. From each bank included in the assess-tion, brand reputaassess-tion, and loyalty. Brand reputation is consid- ment, we selected a proportion of its branches, using as criteria ered to be the perception of quality associated with the name the bank’s relative size and the geographical dispersion of its of the product or the firm that provides a service. In financial branches to avoid local bias. The survey team selected re-services, brand reputation is mainly associated with the cus- sponses from 600 business customers and 1,200 individual tomer satisfaction dimension often termed as “corporate qual- customers in total. The samples were taken on different days ity.” One key function of brand name is that it can facilitate and at uniformly distributed time intervals to reduce time-choice when the customer cannot distinguish any differentiat- and date-related response bias.
ing features among the provided services/products. In services,
the brand name is more often associated with company reputa-
Measurement Model
tion rather than individual products or services. Zeithaml,Confirmatory factor analysis (CFA) was used to examine the Berry, and Parasuraman (1996) argue that if service quality
presence of underlying customer satisfaction dimensions (an-relates to retention of customers at the aggregate level, then
tecedents) for each group of responses; that is, individual and this should be detectable from individual customers’
behav-business customers. The two factor analysis results confirmed ioral responses.
H1and2regarding the multidimensional nature of customer satisfaction in financial services and also the differences be-P3: Switching as a direct response to customer
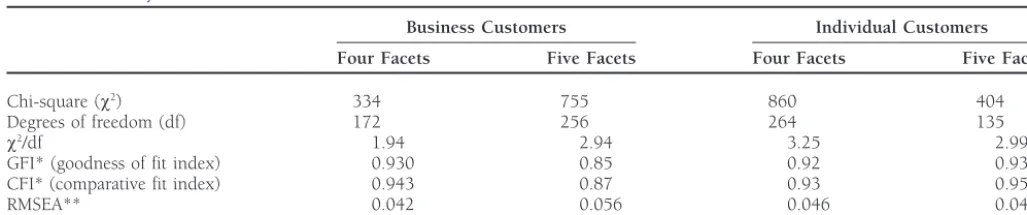
Table 1. Summary Statistics of Model Fit
Business Customers Individual Customers
Four Facets Five Facets Four Facets Five Facets
Chi-square (v2) 334 755 860 404
Degrees of freedom (df) 172 256 264 135
v2/df 1.94 2.94 3.25 2.99
GFI* (goodness of fit index) 0.930 0.85 0.92 0.93
CFI* (comparative fit index) 0.943 0.87 0.93 0.95
RMSEA** 0.042 0.056 0.046 0.042
* CFI and GFI values close to 1 indicate a good fit.
** The lower the RMSEA values, the better the model is considered. Values below 0.1 suggest adequate fit.
and business banking customers. The results in Table 1 pro- case in the models selected. More reliable test statistics have been proposed in literature; that is the GFI and the CFI where vide information regarding the five-factor assumed model for
the individual customers, and the five- and four-factor solution both models yield adequate estimates. The adequacy of the model estimates was also confirmed by the small (less than is compared in the case of the business customers.
The CFA hypothesized model was tested using the EQS 5 0.1) RMSEA values.
The results concerning the factor structure of business and model developed by Bentler and Bonnet (1980) using the
maximum likelihood estimation procedure. The basis of the individual customers indicate the presence of four- and five-factor model, respectively. Before discussing the interpretation statistical analysis was the covariance matrix of the observed
responses. Over-all fit and the significance of the loading of of item loading on each factor, it is worth exploring a series of diagnostic tests concerning the validity and reliability of the individual variables on the hypothesized factors were
consid-ered. Table 1 shows the fit indices for the two sample models proposed tests based on the empirical results shown in Table 2. The results in Table 2 confirm the reliability and validity of using the chi-square test, Bentler’s (1990) comparative fit
index and the root mean square of approximation (RMSEA). the five satisfaction dimensions, because all indices concerned exhibited high values on their corresponding scales. The next The RMSEA measures the lack of fit and takes parsimony into
account by assessing the discrepancy per degree of freedom item on the agenda concerns the discriminant validity of the facets of customer satisfaction associated with the two samples between the population covariance matrix and the fitted
ma-trix. That is, it penalizes for overfitting. and was estimated with the factor-correlation indices shown in Table 3, as indicated by Venkatraman (1989).
The measurement model was first tested for the adequacy
of a five or four facets’ solution, using the presence of conve- The factor correlations in Table 4 indicate that the two samples exhibit statistically significant but also correlated fac-nience as a facet of customer satisfaction as point of reference.
The results listed in Table 1 are in favor of a four-factor tor structures. The correlation of the antecedents of customer satisfaction is a well-established phenomenon in both theoreti-structure for business customers and five-factor theoreti-structure for
individual customers. This was confirmed by the series statis- cal and empirical terms, Parasuraman, Zeithaml, and Berry (1988) and Cronin and Taylor (1992). The finding of this tics that were employed to test the measurement models. Using
the Bentler and Bonnet (1980) and Byrne (1989) criterion of research is also in line with the recent work by Taylor (1997) concerning the second-order and interactive effects between ratio x2/df, we can conclude that an inadequate fit occurs
when values greater than 3 are obtained, which was not the customer satisfaction and service quality as predictive
indica-Table 2. Construct Reliability and Validity of the Proposed Factor Structures
Business Customers Individual Customers
Cronbarch’s Construct % Variance Cronbarch’s Construct % Variance
Alpha Reliabilitya Explainedb Alpha Reliability Explained
Corporate 0.78 0.91 95 0.84 0.86 85
Innovativeness 0.82 0.88 90 0.88 0.88 86
Physical and staff service 0.74 0.89 90 0.87 0.91 91
Pricing 0.77 0.79 82 0.89 0.86 92
Convenience 0.82 0.88 92
aConstruct reliability: (R
jlj)2/(Rjlj)21Rjej), whereljis standardized ML parameter estimate, andejis the error term about the estimated parameter. bVariance explained:R
Table 3. Correlation Coefficients Among the Customer Satisfaction Factors (Discriminant Validity)
Individual Customers
F1 F2 F3 F4 F5
Corporate (F1) 0.59* 0.64* 0.54* 0.52*
Innovativeness (F2) 0.48* 0.79* 0.79* 0.76*
Physical and staff service (F3) 0.49* 0.56* 0.70* 0.65*
Pricing (F4) 0.51* 0.72* 0.70* 0.73*
Convenience (F5)
F1 F2 F3
Business Customers
* Indicate significant coefficients at the 5% level.
tors of customer loyalty. The correlation estimates of the factor estimation of the factor model assuming a single-factor solu-tion that gave very poor fit indices for both the business solutions prompted further testing of the hypothesis of having
better underlying factor structures. This particular issue was (GFI50.71) and individual (GFI50.69) customer models. The second step included iterative re-estimation of the factor tested in two alternative ways. The first step included
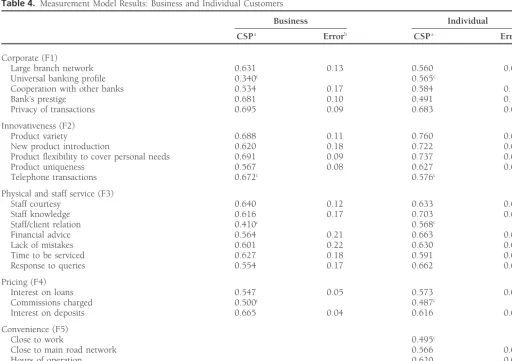
re-Table 4. Measurement Model Results: Business and Individual Customers
Business Individual
CSPa Errorb CSPa Errorb
Corporate (F1)
Large branch network 0.631 0.13 0.560 0.08
Universal banking profile 0.340c 0.565c
Cooperation with other banks 0.534 0.17 0.584 0.16
Bank’s prestige 0.681 0.10 0.491 0.10
Privacy of transactions 0.695 0.09 0.683 0.05
Innovativeness (F2)
Product variety 0.688 0.11 0.760 0.05
New product introduction 0.620 0.18 0.722 0.04
Product flexibility to cover personal needs 0.691 0.09 0.737 0.06
Product uniqueness 0.567 0.08 0.627 0.06
Telephone transactions 0.672c 0.576c
Physical and staff service (F3)
Staff courtesy 0.640 0.12 0.633 0.06
Staff knowledge 0.616 0.17 0.703 0.06
Staff/client relation 0.410c 0.568c
Financial advice 0.564 0.21 0.663 0.07
Lack of mistakes 0.601 0.22 0.630 0.05
Time to be serviced 0.627 0.18 0.591 0.08
Response to queries 0.554 0.17 0.662 0.06
Pricing (F4)
Interest on loans 0.547 0.05 0.573 0.03
Commissions charged 0.500c 0.487c
Interest on deposits 0.665 0.04 0.616 0.06
Convenience (F5)
Close to work 0.495c
Close to main road network 0.566 0.06
Hours of operation 0.620 0.05
Presence of ATMs 0.642 0.04
aCompletely standardized parameter (CSP). bAll coefficients are significant at a 1% level.
model eliminating one factor at a time and assigning its items vice environments. This is in line withH1dconcerning the presence of a simple and unidimensional structure to one of the remaining factors. The fit indices obtained were
again inferior to the solution reported in Table 3, and thus of service quality. The rationale behind such a finding should be attributed at both the level of service provided the four- and five-factor structures are deemed to have passed
the discriminant validity tests. The standardized coefficients by the retail banking sector in Greece and also the ability of individual and business customers to differentiate and the estimated errors of the factor components of the two
sample sets are summarized in Table 4. between detailed attributes of service provision. 4. Price is given relatively low coefficients for its items The estimated coefficients associated with the factor
struc-tures of the two samples are all accompanied with statistical (max: 0.66, min: 0.49), with the interest on deposits being given the highest coefficient. Once again, the lack significance of 1%. Despite the relatively satisfactory over-all
fit of the CFA models, some question items have relatively of fully competitive financial markets is deducible from the low standardized scores given to price-related ques-small factor coefficients. In particular, advertising campaign
(corporate quality) and proximity to home (convenience) have tion items.
5. Convenience was only present in the individual custom-factor coefficients below 0.4, and thus the model was
re-estimated giving marginal improvements to the model’s over- ers’ model and has yielded the lowest standardized scores (max: 0.64, min: 0.49), the presence of an ATM all fit and improving the factor coefficients of the remaining
question items. The final model presented in Table 4 contains machine being given the highest score, reflecting per-haps the way that individual customers value conve-some question items with rather low standardized coefficients
that were retained in the model for two reasons. First, they nience from their bank branches. The question item concerning the proximity of the bank branch to the indicate managerial relevance with the construct that is sought
to be measured, and second, a reassessment of the model in homes of individuals was removed from the final solu-tion because of its very low standardized coefficient. their absence did not significantly alter the over-all fit of the
model and the coefficients of the remaining question items. The questions related to convenience should be read as elements of the service delivery, after the decision to The standardized coefficients of the two models are
compa-rable in terms of their magnitude, which indicates some simi- have business with a particular bank. Therefore, the evaluation concerning convenience is processed bearing larity in the direction of customer behavior. It is worth
observ-ing, however, that the individual customers’ model yields in mind that some selection criteria were met at the first place, and thus customer focus is given on elements systematically higher values than those from the
correspond-ing model of business customers. (This observation can be of convenience not related to location (i.e., presence of ATM and working hours).
tested statistically by means of multisampling confirmatory factor analysis, but was left for future research.)
The confirmatory factor analysis results advocate the pres-Focusing on the standardized coefficients of individual
ence of five dimensions of customer satisfaction, which draw items, the following observations can be made.
upon the coexistence of staff service, business profile, innova-tiveness (product), convenience, and price characteristics. The 1. Corporate quality includes items with moderately high
coefficients (max: 0.69, min: 0.34), with the universal sample of business customers did not support convenience as a facet of customer satisfaction, indicating perhaps, the different banking profile and the bank’s prestige being the least
important items on business and individual customer type of customer-service conduct that applies for business customers. The presence of innovativeness is a relatively new samples, respectively.
2. Product-related items (innovativeness) exhibit the high- factor that leads to customer satisfaction, which deserves more attention in customer-satisfaction literature.
est standardized coefficients (max: 0.76, min: 0.56),
with the notable case of the item regarding product On comparing these empirical results with those from other national environments of retail banking, there are similarities uniqueness, which has the smallest coefficient. It seems
that no banking institutions have managed to encapsu- with the studies of Laroshe, Rosenblatt, and Manning (1986), LeBlanc and Nguyen (1988), and Blanchard and Galloway late distinctive features in their products.
3. Physical and staff service items exhibit high standard- (1994), where customer satisfaction was not assessed solely on the basis of service quality. Finally, the unidimensional ized coefficients (max: 0.703, min: 0.41), with the staff/
client relationship being the weakest item on the scale. nature of service quality characteristics is another issue that should be examined in the context of inconclusive previous At the same time, staff knowledge and staff courtesy
were given the highest scores within the particular facet, findings (Babakus and Boller, 1992; Davis, 1991; Parasura-man, Zeilthaml, and Berry, 1988).
indicating the importance given to these basic elements
of service provision. The loading of the particular items As a source of conceptual deviation, the presence of product innovativeness as an element of customer satisfaction is re-on a single factor favor previous findings by Babakus
ser-the highest standardized coefficients among ser-the remaining Greece because of the limited competition that banks exhibit criteria of service satisfaction in the confirmatory measurement in their pricing practices.
model. Finally, the appearance of price as a facet of satisfaction, and its subsequent correlation with the satisfaction
dimen-Satisfaction Cues for Customer
sions, enforces the linkage between price charges and the
bundle of service offerings that accompany these services. The
Segmentation and Switching Behavior
overwhelming evidence of the empirical results of the studyAssessment of the antecedents of customer satisfaction has favor the joint determination of the antecedents of customer
shed some light on the way customers assess their encounters satisfaction and, furthermore, the benefit from mixing service
with financial institutions. It is important, however, to note quality with other characteristics of the service encounter.
that these are not homogeneous entities at either the individual or business levels. This implies that it is important to examine
Assessing Differences Between Facets of
how different customer segments perceive their service
en-Customer Satisfaction: Hypothesis 1c
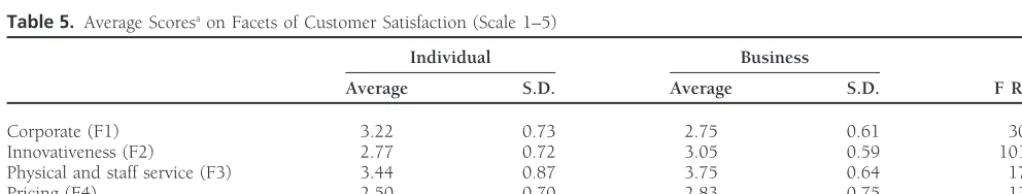
counter in line with P3 and subsequent H3. This task was Apart from the identification of the antecedents of customer pursued by segmenting the customers into clusters of similar-satisfaction, there is strong interest in identifying the aggregate ity, not only in terms of socioeconomic profiles, but also in scores that each factor takes from the two types of customers. terms of type of financial transactions undertaken with their This will yield information regarding the relative importance corresponding banks. For these clusters, a number of statistical of each factor in the bank selection process. This information hypotheses were tested concerning the presence of significant is provided in Table 5. customer satisfaction differences.The scores in Table 5 correspond to the average raw scores from the question items loaded on each facet listed in Table 2.
Customer Segments and Satisfaction
The aggregate customer satisfaction scores reveal, first, theDifferentials: H3
differential importance of the antecedents of customersatisfac-Cluster analysis methods were used as a means of segmenting tion, and second, the different profile attributed to individual
customers into homogeneous groups. The cluster membership and business customers, as indicated by the analysis of
vari-was derived from variables that reflected socioeconomic status ance results in Table 2. The latter empirically confirmsH1c.
and form of relationship with the banking institutions. The Although the differential importance given to customer
latter variables have Boolean (0,1) measurement type, and satisfaction dimensions it is not overly emphasized, it was
thus it was necessary to convert all our measures on qualitative previously mentioned by Parasuraman, Zeithaml, and Berry
scales using the quartiles of each scale as a point of reference (1988), when they found that reliability is the predominant
(thus, a variable scaled from 1 to 7 was created for each factor of service quality, as compared to empathy, assurance,
continuous measured cluster criterion). The cluster analysis and tangibles. The differential is undoubtedly context specific
was processed after an initial scanning, where correlated vari-(see Schneider, 1990), and it also has a comparative base. In
ables were removed from the cluster analysis. (As one of this study, individual customers give highest scores to the
the anonymous referees pointed out, an alternative approach facets of service offering (physical and staff service) and the
would have been to use factor scores instead of eliminating corporatequality. In the case of business customers, the factors
correlated variables.) As clustering methodology, similarity concerning staff and physical service received the highest
rat-measures among the cluster variables were used to derive ings, a result that gives an undisputed important role to
cus-distances, and the Ward clustering method was used to classify tomer service (part of the service encounter) and is compatible
the observations into groups. The over-all variance explained to prior research findings. The low scores of the price factor
(Wilks MANOVA test) by the clustering variables was used should be read in line with the limited variation that is
cur-rently available to the customers of the banking sector in as the criterion for selecting the number of clusters. Table 6
Table 5. Average Scoresaon Facets of Customer Satisfaction (Scale 1–5)
Individual Business
Average S.D. Average S.D. F Ratio
Corporate (F1) 3.22 0.73 2.75 0.61 30.5b
Innovativeness (F2) 2.77 0.72 3.05 0.59 101.0b
Physical and staff service (F3) 3.44 0.87 3.75 0.64 17.0b
Pricing (F4) 2.50 0.70 2.83 0.75 13.6b
Convenience (F5) 3.29 0.61 N/A N/A
Table 6. Business and Individual Customer Cluster Profilesa
Large–Sized Large and Medium–Sized
Small–Sized Medium–Sized with Loan International and Own
Firms Firms Obligations Orientation Capital
Cluster 1c Cluster 2c Cluster 3c Cluster 4c Cluster 5c
Business Customers 238 Obs. 65 Obs. 176 Obs. 81 Obs. 40 Obs.
Staff sizeb 1.9 2.5 4.8 3.5 2.8
Assetsb 3.6 4.6 4.7 5.9 5.4
Own capitalb 3.4 4.7 5.2 4.2 5.6
Years of operationb 4.7 3.7 4.5 3.8 2.9
Salesb 4.0 5.0 5.2 6.1 5.3
Use of ATMs 18% 29% 11% 6% 5%
Loan transactions 38% 60% 86% 63% 50%
Imports/exports 40% 78% 88% 64% 60%
Foreign transactions 45% 52% 59% 71% 42%
Small
Young Account
Professional Professional Holders Innovator Traditional
Cluster 1l Cluster 2l Cluster 3i Cluster 4l Cluster 5i
Individual Customers 280 Obs. 320 Obs. 345 Obs. 55 Obs. 90 Obs.
Use of ATMs 40% 39% 24% 52% 18%
Foreign currency 18% 29% 15% 40% 21%
Loan transactions 6% 9% 2% 40% 3%
Direct debits 3% 6% 1% 37% 1%
Business account 30% 32% 10% 85% 30%
Bond holders 8% 6% 8% 3% 15%
Age Young Middle Young and old Middle Middle
Education High school Higher ed. Mixed Primary and Primary and high school high school
Mobile phone owner 5% 16% 4% 44% 5%
Car owner 70% 84% 70% 91% 71%
aThe reported variables have exhibited statistically significant differences by means of a MANOVA test, which was expected as a result of the clustering algorithm. bEach firm was given a rating from 1 to 7 (in ascending order) obtained from the quartile assessment of its values obtained from the corresponding quartiles of its values.
lists the profile of the clusters derived from individual and tor” type of customers, because they exhibit a very high type of business customers. consumerism, have business accounts, and have been granted The information in Table 6 concerns the profile of the loans by their bank; finally, the most notable characteristic of customer clustering in views of variables where some notice- cluster 5 is the customer who uses investments in governmen-able differences among the derived clusters were detected. tal bonds as a means of utilizing savings, which advocates For the business customers, cluster 1 corresponds to firms their characterization as “traditionalist” customers.
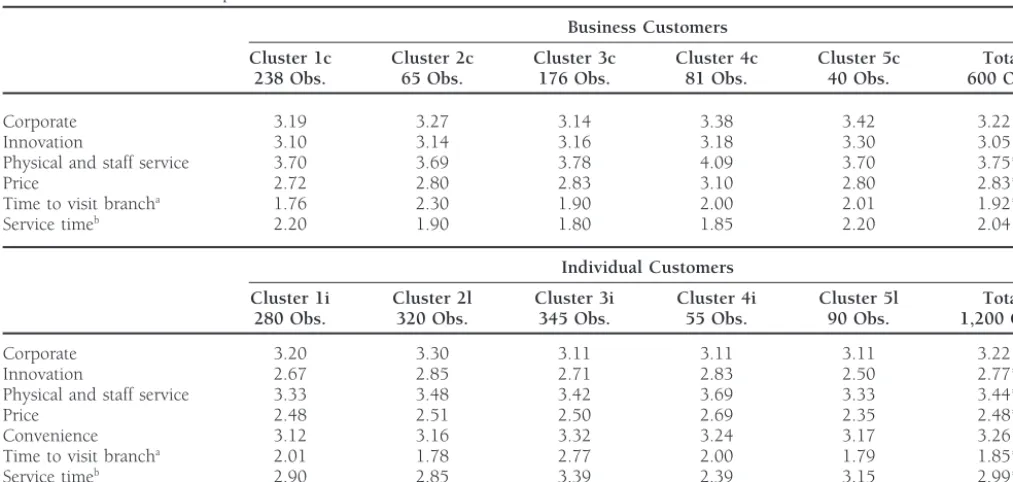
with relatively small activities and size that have, however, On the basis of the particular cluster profiles discussed many years of operation; cluster 3, on the other hand, seems the multivariate analysis of variance was pursued to examine to be the cluster of firms with the most notable size and customer satisfaction differences between the clusters of busi-magnitude of bank transactions; cluster 4 is that of enterprises, ness and individual customers. Table 7 contains all relevant in relative terms, with the most notable size in terms of asset information.
base and scales; cluster 5 corresponds to firms relatively small Assessment of customer satisfaction differences between in size and not many years of operation. For the individual the clusters of customer behavior was made to examine the customers, the following cluster interpretation can be given: presence of the statistical differences that emanate from the cluster 1 corresponds to “young professionals” whose main customer profile of each cluster. For the business customers occupation is in the service sector; cluster 2 is made up of the following observations can be made.
“professionals” with a very high level of education, most
mem-1. Significant differences among the price dimension of bers having received higher education and/or postgraduate
customer satisfaction emanate from cluster 4 (high sales degrees; cluster 3 includes extreme customer profiles, notably
and assets), which includes the most price conscious very young and very old who, however, share a relatively
customers and cluster 1 (firms of small size and activi-small intensity of transactions with their banks and hold
Table 7. Cluster Membership and Customer Satisfaction Differential (Scales 1–5)
Business Customers
Cluster 1c Cluster 2c Cluster 3c Cluster 4c Cluster 5c Total
238 Obs. 65 Obs. 176 Obs. 81 Obs. 40 Obs. 600 Obs.
Corporate 3.19 3.27 3.14 3.38 3.42 3.22
Innovation 3.10 3.14 3.16 3.18 3.30 3.05
Physical and staff service 3.70 3.69 3.78 4.09 3.70 3.75**
Price 2.72 2.80 2.83 3.10 2.80 2.83**
Time to visit brancha 1.76 2.30 1.90 2.00 2.01 1.92**
Service timeb 2.20 1.90 1.80 1.85 2.20 2.04
Individual Customers
Cluster 1i Cluster 2l Cluster 3i Cluster 4i Cluster 5l Total
280 Obs. 320 Obs. 345 Obs. 55 Obs. 90 Obs. 1,200 Obs.
Corporate 3.20 3.30 3.11 3.11 3.11 3.22
Innovation 2.67 2.85 2.71 2.83 2.50 2.77**
Physical and staff service 3.33 3.48 3.42 3.69 3.33 3.44**
Price 2.48 2.51 2.50 2.69 2.35 2.48**
Convenience 3.12 3.16 3.32 3.24 3.17 3.26
Time to visit brancha 2.01 1.78 2.77 2.00 1.79 1.85**
Service timeb 2.90 2.85 3.39 2.39 3.15 2.99**
** Indicates multivariate significant differences at 1% level.
aFirm-specific rating concerning the time taken to reach the branch: 1 very low–5 very high. bFirm-specific rating concerning the time taken to be serviced: 1 very low–5 very high.
2. Significant differences were exhibited among the physi- cluster 5 (traditionals). That is to say, traditionalists are cal service dimension of customer satisfaction with nota- engaged in nonvalue-added transactions, where compe-ble cases, cluster 4 (high sales and assets) with the tition is limited on pure price terms. On the other hand, highest scores and cluster 1 (firms of small size and innovators seek value (value5price-quality) rather than activities), again, with the lowest scores. price and thus price is not their main objective in bank-3. Significant differences were finally exhibited on an extra ing transactions.
qualitative criterion that concerns the time taken to visit 4. Time to visit the branch is an area of statistical differ-branches with, most notable, the cases of cluster 1 (firms ences with cluster 3, which exhibits the worse score of small size and activities) with the lowest scores (ema- (highest traveling time), because the particular custom-nating from the many years of operation of these firms, ers tend to visit the branches without using cars or which are located closer to the branches of their banks). other means of transport. The customers included in Also, their small size indicates that these firms do not cluster 2, on the other hand, spend the least time on use their employees to visit their branches, and thus reaching their branch, which is partly related to the use the owner, who is also manager, chooses banks closer of their cars. A similar argument does not hold for the
to the firm. innovator customers of cluster 4, because they seek the
innovative services offered from the newer banks and For individual customers, similar observations can be made
thus those with the fewest branches. regarding the statistical differences among the five clusters.
5. The case of the innovator cluster is further elaborated 1. The customer satisfaction dimension concerning staff on with respect to the criterion of service time; that is, and physical service exhibit statistical differences, with they spend the least time on their bank transactions. The cluster 4 (innovators) giving the highest scores, and customers in cluster 3 are by far the least advantaged, clusters 1 and 5 with the lowest scores. because they must wait a relatively longer time before 2. On the innovativeness of the services/products pro- being served. The traditionalist customers of cluster 5 vided, cluster 2 (high levels of education) and cluster are also engaged in long waiting times, which is partly 4 (innovators) give very high scores, and cluster 5 (tradi- related to the complex type of transactions that they tionalists) gives the smallest scores. have with their banks (bond holders).
3. Price is, once again, a differentiating factor among
indi-In conclusion, it can be argued that the division of customers vidual customers, with the most notable differences
Table 8. Reasons for Switching Banking Institution
variables have been employed, notably satisfaction indices,
that exhibited significant mean differences across the market Business Private segments (clusters). Furthermore, this information indicates Reason Customers Customers
the service provision that must be differentiated across each
Inadequate level of services 78% 75%
segment so customer demands are met.
Inconvenient location 8% 15%
Customer relocation 15% 30%
Antecedents of Customer Switching Behavior:
Poor pricing conditions 20% 40%Small branch network —— 10%
Hypothesis 4
Automatic salary payment
The assessment of customer switching behavior constitutes a to a new bank —— 5% very important question for banking institutions. The implica- No reason stated 25% 15% tions are significant for both market leaders who seek to Total switching 78 (out of 600) 216 (out of 1200)
implement effective defensive policies and also for smaller players who seek to expand their market shares (offensive policies). Customer retention is advocated as a difficult but,
dealing with business customers anticipating the associated at the same time, unfolding business strategy in services (Rust
risks, which is a potential source of switching by necessity and Zahorik, 1993). It is argued that there is a high premium
for business customers. The case of private customers seems cost for service firms to gain and sustain new customers as
to be different, because the vast majority of customer switching opposed to retaining the existing customer base. Undoubtedly,
takes place from public sector to private sector banking institu-the problem of switching behavior draws heavily upon institu-the
tions. The largest public bank (National Bank of Greece) and adoption of particular service strategy by individual firms,
the Ionian Bank were those with the widest customers losses. and this was to be assessed empirically. A logistic regression
It is notable that the pricing conditions were identified as a model to identify factors that could explain the switching
primary cause of switching among the individual customers, behavior of retail banking customers was used following a
which shows the effect of growing competition among the similar pattern of analysis to that of Rust and Zahorik (1993).
retail banking industry in Greece. The behavioral pattern of retail banking customers in
The relocation of business and individual customers as a Greece is far from being mature, because this industry is at
criterion of bank switching is a factor not directly under the an evolutionary stage. Country-specific statistics regarding the
control of the banks. It is evident, however, that the limited switching behavior of retail banking services is not sufficiently
electronic money transfer that is currently in place in Greece represented. The contention made in this study, however, is
creates dependencies between the exact location of the bank to adopt a very strict and unidimensional view of customer
branches and the individual or business customers. Overall, retention by means of the proportion of those customers that
it is important to note that the staff service has been stated realized their intention to switch retail banking institutions.
as the main switching reason for both types of customers, and A more thorough investigation of the loyalty issue would require
the remaining reasons have had complementary significance. appreciation of the multidimensional nature of consumer
behav-One way forward regarding the switching behavior of indi-ior in line with Fornell, Johnson, Anderson, Cha, and Bryant
vidual customers is to examine the potential statistical associa-(1996) and Zeithaml, Berry, and Parasuraman associa-(1996).
tion between the decision to switch and various explanatory The sample used in the present study yielded a 13%
switch-factors related to the service satisfaction scores and the socio-ing of business customers (78 out of 600) and 18% switchsocio-ing
demographic profile of the customers. Two logistic regression of individual (216 out of 1,200) customers who had switched
models were used, and the results are listed in Table 9. bank in the last 2 years. It must be noted that no cases were
The results presented in Table 9 concern the logistic regres-reported wherein more than one bank switching had occurred
sions derived from the samples of business and individual in any customer within the time span of 2 years. These figures
customers. A Boolean variable was used as dependent variable were complied from the customer responses that included
taking the value of 1 had a customer changed bank in the qualitative questions concerning the occurrence of a switching
last 2 years, and 0 otherwise. Thus, negative coefficients indi-decision and also the two most important reasons that led to
cate the tendency to remain loyal (0 response value), and their decision. The qualitative responses were left open, and
positive coefficients indicate the tendency to switch to another thus a variety of reasons were selected and subsequently
bank (1 response value). The pool of independent variables coded, as presented in Table 8.
In the case of business customers, the switching has taken included the average customer responses of the question items that loaded on the customer satisfaction factors. The moderat-place primarily among the private sector banking institutions.
By virtue, the customers concerned are more volatile, because ing effects of the independent variables were also explored in line with Taylor’s (1997) line of enquiry. An additional pool they seek to optimize the terms and conditions in banking
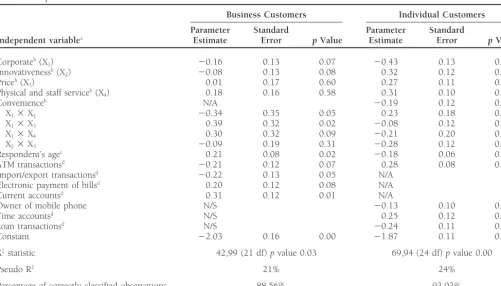
Table 9. Impact of Customer Satisfaction and Profile on Retention Rate
Business Customers Individual Customers
Parameter Standard Parameter Standard
Independent variablea Estimate Error pValue Estimate Error pValue
Corporateb(X1) 20.16 0.13 0.07 20.43 0.13 0.00
Innovativenessb(X2) 20.08 0.13 0.08 0.32 0.12 0.05
Priceb(X3) 0.01 0.17 0.60 0.27 0.11 0.04
Physical and staff serviceb(X4) 0.18 0.16 0.58 0.31 0.10 0.01
Convenienceb N/A 20.19 0.12 0.09
X13X2 20.34 0.35 0.05 0.23 0.18 0.03
X13X3 0.39 0.32 0.02 20.08 0.12 0.22
X13X4 0.30 0.32 0.09 20.21 0.20 0.05
X23X3 20.09 0.19 0.31 20.28 0.12 0.04
Respondent’s agec 0.21 0.08 0.02 20.18 0.06 0.08
ATM transactionsd 20.21 0.12 0.07 0.28 0.08 0.00
Import/export transactionsd 20.22 0.13 0.05 N/A
Electronic payment of billsd 0.20 0.12 0.08 N/A
Current accountsd 0.31 0.12 0.01 N/A
Owner of mobile phone N/S 20.13 0.10 0.08
Time accountsd N/S 0.25 0.12 0.00
Loan transactionsd N/S 20.24 0.11 0.02
Constant 22.03 0.16 0.00 21.87 0.11 0.00
X2statistic 42,99 (21 df)pvalue 0.03 69,94 (24 df)pvalue 0.00
Pseudo R2 21% 24%
Percentage of correctly classified observations 88.56% 93.03%
aAll independent variables have been standardized.
bOriginal scale: average raw scores of question items of each factor. cOriginal scale: raw variable score.
dOriginal scale: Boolean variable indicating 1 for “yes” response and 0 for “no” response.
N/A: variable was not applicable; N/S: variable was not found significant.
cluded. All independent variables were standardized, thus ior can be explained by means of the sign of the regression reducing possible multicollinearity effects. (The multicollin- coefficients included in the regression model. The sign and earity effects were further diagnosed using ordinary regression magnitude of the regression coefficients have not been affected analysis to fit the same model and thus estimating the magni- by multicollinearity problems, since their correlation coeffi-tude of variance inflation factor (VIF) that took values that cients did not exceed 0.50 in all cases.
did not exceed 1.4.) In Table 9, the coefficients of those The business customers seem to have positive views about variables that were found statistically significant are reported. the banks with high corporate image; these were primarily (A full set of variables can be obtained from the author upon the largest public sector and the very successful private banks. request.) The explanatory power of the logistic regression Similar argument can be made for those banks recognized for models is comparable with previous attempts by Rust and their innovative behavior in terms of products and services. Zahorik (1993) and Taylor and Baker (1994). The remaining two factor scores concerning price and staff The significant negative intercept exhibited in both regres- service do not have statistically significant direct effects on sion models indicates that business and individual customers business customers’ loyalty. The insignificant direct effect of are, in principal, loyal and only after a series of negative effects pricing may reflect the fact that pricing is considered very (independent variables with positive sign) consider moving seriously by business customers when the initial selection of competing banks.
their banking supplier is considered and thus it does not show up as a stimulus for switching. Additional insights were given, BUSINESS CUSTOMERS. The logistic model has given a
rela-however, by the moderating variables concerning corporate tively good fit, with 89% of the cases being correctly classified,
quality and its interactive terms. The negative interaction be-and with a pseudo R2 on the order of 21%. Cases with no
tween corporate quality and innovativeness indicate the incre-correct classification lie in the category of the switched
custom-mental loyalty effect for customers that recognize simultaneous ers, which implies the presence of “latent” factors not included
high scores for both dimensions of satisfaction. The positive in the present study that could explain the switching behavior
respectively, indicate that these satisfaction dimensions are with their bank are less likely to switch to another bank. not compatible (according to customer perceptions), and thus The latter is expected, because the loan contracts quite often high corporate quality and staff service are not met in banks prompt individual customers to retain all their bank transac-with high corporate quality. tions with the bank concerned as a means of cross-selling
A series of complementary independent variables in the activities.
regression equation were also found significant. Higher busi- The Rust and Zahorik (1993) loyalty assessment is the only ness customers’ age and current account holders are associated similar study that can be contrasted with the current study. with less loyal customer behavior. Firms involved in import/ This earlier study, however, identified a single factor with export transactions and use of ATMs are associated with higher significant and positive effects on the loyalty of bank custom-loyalty. Because the handling of imports and exports is a ers. This factor, labeled as “warmth” in their study, bears a banking transaction that requires some degree of knowledge strong resemblance to the staff service factor of the current and specialization, it seems that business customers are reluc- study. The Rust and Zahorik study, however, had access to tant to move to another bank when this type of transaction additional information that enabled empirical investigation of is performed successfully. the effects of customer service improvements on the market
share of individual banks. INDIVIDUAL CUSTOMERS. The logistic model has given a
rela-tively good fit, with 93% of the cases being correctly classified, and with a pseudo R2 on the order of 24%. Cases with no
Discussion and Strategic Implications
correct classification lie in the category of the switched
custom-ers, which implies the presence of “latent” factors not included The important issue from the whole of the research assessment in the present study that could give more insights about the concerns the strategic implications of the results for those behavior of business customers. involved in the service chain of financial services. Research Corporate quality and convenience exhibit direct positive in services marketing has brought forward issues related to effects on customer loyalty. On the contrary, innovativeness, the importance of customer-focused strategies as a means of price, and staff service have, in principle, a negative effect on firm competitive advantage. The most typical example is the individual customer loyalty. The three interactive effects that contrast between defensive and offensive marketing that char-were found significant have given different interpretation. Cor- acterize strategies adopted by market leaders and new entrants, porate quality and innovativeness seem to be contradictory, respectively. The conclusions drawn from the empirical results and, bearing in mind that in the individual customers’ case, of this study are informative for both types of service strategies. the switching has occurred from public to private sector banks, That is, market share leaders would be prepared to identify it seems that: (1) individual customers do not value product
their strong points and improve on their weaker ones. In innovation as much as business customers; and (2) corporate
financial markets with emerging competitive trends, however, quality and product innovation lie at different banking
institu-the identification of antecedents of customer satisfaction does tions. Staff service has negative interaction with corporate
not assurede facto use of the particular criteria in selecting quality, indicating that banks with high corporate quality that
service providers. The empirical basis of the present paper offer adequate staff service should expect higher customer
has shown very conservative estimates regarding the switching loyalty. The interaction between innovativeness and price is
intentions of business and individual customers (only 16% of supportive to customer loyalty but also yields an important
the respondents had switched banking institutions over the message that customers associate their bank’s innovative
be-last 2 years). The expected increase in customer awareness havior with the price they are expected to pay.
and access to full information will bring strong incentives The age of individual customers has positive contribution
toward the development of multibanking customer behavior, on their loyalty, which is contrary to the case of the business
where customers will sample test the services offered by indi-customers. It reflects, however, the expectation that older
vidual banks prior to their final choice. individual customers are less aggressive on the behavior
re-For new market entrants, our empirical results have shown garding their banks. Individual customers involved in ATM
that they may expect considerable customer switching if they transactions and having time accounts exhibit less loyalty,
provide superior scores on the identified facets of customer reflecting perhaps two distinct behaviors.
satisfaction. Empirical results from the logistic regression Those customers using ATMs are less worried about the
model have shown that there are specific parameters that service they get, as long as their electronic transactions can
influence particular customers to remain loyal to their current be handled reliably. The same type of customers, however,
service providers. Although this is vital information for market are less committed to any bank and are more likely to switch
leaders, it also highlights the mileage that new entrants need to another bank for relatively minor reasons. For customers
to cover in order to increase their market shares. The customer with time accounts, their switching behavior indicates a
bene-satisfaction function, as obtained from the empirical results fit maximization tendency concerning the price they get for
Anderson, E. W., Fornell, C., and Lehmann, D.: Customer
Satisfac-that can be used as drivers of increased market share and thus
tion, Market Share, and Profitability: Findings from Sweden. Jour-profitability.
nal of Marketing58 (July 1994): 53–66.
The missing link of this assessment is the estimation of the
Asubonteng, P., McCleary, K., and Swan, J.: SERVQUAL Revisited: A
effort, namely investment, that is required to increase the
Critical Review of Service Quality.The Journal of Services Marketing standards of the service offered by individual banks. In this 10(6) (1996): 62–81.
race, the newer banks have the advantage of their newness Athanassopoulos, A.: An Optimization Framework of the Triad: and having relatively more innovative approaches; whereas, Capabilities, Service Quality, and Performance, in Efficiency of older banks have a cultural advantage in terms of public Financial Institutions (Special Issue), P. Harker and S. Zenios,
eds., Cambridge University Press, Cambridge, UK. 1997.
prestige, and also internal organization that may be valued by
Babakus, E., and Boller, G. W.: An Empirical Assessment of the
their customers. Future research should expand the research
SERVQUAL Scale.Journal of Business Research24(3) (1992): 253–
agenda in the direction of linking the marketing effort to
268.
individual branch returns in terms of customer retention and
Bentler, P., and Bonnet, D.: Significance Tests and Goodness of Fit
market share. This will seek to assess the differential bank
in the Analysis of Covariance Structures.Psychological Bulletin88
utility of different customer segments that will enable the bank
(1980): 588–606.
to assess the cost of penetrating different customer segments
Berry, L.: Relationship Marketing of Services—Growing Interest,
against the expected bank rewards. Emerging Perspectives.Journal of the Academy of Marketing Science
23(4) (1995): 236–245.
Brown, T., Churchill, G., and Peter, P.: Research Note: Improving
Conclusions
the Measurement of Service Quality.Journal of Retailing69 (1993):
This research represents an attempt to assess the antecedent 127–139.
of customer satisfaction in the context of the emerging compet- Byrne, B.:A primer of LISREL, Basic assumptions and Programming for confirmatory factor analysis models, Springer-Verlag, New York.
itive financial market of Greece. The purpose was twofold.
1989.
First, to identify the factors upon which customers base their
Carman, J.: Consumer Perceptions of Service Quality: An Assessment
assessment of the provided services. This assessment was
real-of the SERVQUAL Dimensions.Journal of Retailing 66 (1990):
ized by means of an individual and business customer survey
33–55.
that helped investigate the whole issue from two different
Chang, T., and Wildt, A.: Price, Product Information and Purchase
perspectives. Customer separation proved to be profitable,
Intention: An Empirical Study.Journal of the Academy of Marketing because a number of customized hypotheses were empirically Science22 (1994): 16–27.
explored. The empirical results of the study have confirmed
Christopher, M., Payne, A. F., and Ballantyne, D.:Relationship Market-previous research contentions that customer satisfaction is a ing: Bring Quality, Customer Service, and Marketing Together, Butter-function of service quality (staff service and corporate image), worth-Heinemman, Oxford, UK. 1991.
price, innovativeness, and convenience. This five-dimensional Cronin, J., and Taylor, S.: Measuring Service Quality: A Re-examina-framework is comparable to previous empirical research, yet tion and Extension.Journal of Marketing56 (1992): 55–68.
deviates from typical service quality assessments that ignore Cronin, J., and Taylor, S.: SERVPERF versus SERVQUAL: Reconciling the remaining aspects of customer satisfaction. Performance Based and Perceptions Minus Expectations Measure-ment of Service Quality.Journal of Marketing58 (1994): 125–131.
The second objective of the paper was to detect possible
Crosby, L., and Stephens, N.: Effects of Relationship Marketing on
patterns between customer segments and their preferences
Satisfaction, Retention, and Prices in the Life Insurance Industry.
regarding particular aspects of service. In this respect, the
Journal of Marketing Research24 (1987): 404–411.
study was informative, because five groups of business
cus-Davis, M.: How Long Should a Customer Wait for Service?Decision tomers and another five groups of individual customers were
Science22(2) (1991): 421–434.
detected. In brief, the segments of business and individual
Dick, A., and Basu, K.: Customer Loyalty: Toward an Integrated
customers exhibited statistically significant differences in
Conceptual Framework.Journal of the Academy of Marketing Sci-terms of the satisfaction scores. These differences reflect the ence22 (1994): 99–113.
different stages of service focus that are exhibited at present
Ennew, C., and Binks, M.: The Impact of Service Quality and Service
alongside with the emerging competitive terms of financial Characteristics on Customer Retention: Small Businesses and services in Greece. Research into the measurement of customer Their Banks in the UK.British Journal of Management7 (1996): perceptions concerning the service experience should expand 219–230.
and take a longitudinal nature in order to assess the extent Fornell, C.: A National Customer Satisfaction Barometer. The Swed-ish Experience.Journal of Marketing56 (1991): 6–21.
to which individual banks bear the burden of customer
satis-faction and the way customers perceive the efforts made by Fornell, C., Johnson, M., Anderson, E., Cha, J., and Bryant, B.: The American Customer Satisfaction Index: Nature, Purpose, and
their banks to supply adequate services.
Findings.Journal of Marketing60 (1996): 7–18.
Garvin, D.:Managing Quality: The Strategic and Competitive Edge, The
References
Free Press, New York. 1988. Akviran, N. K.: Developing an Instrument To Measure Customer
Gilmore, P.: Customer Service: Differentiating by Market Segment. Service Quality in Branch Banking.International Journal of Bank