Effects of moderate drought conditions on green leaf
number, stem height, leaf length and tuber yield of potato
cultivars
P.M.K. Deblonde *, J.F. Ledent
Laboratoire d’Ecologie des Grandes Cultures,Faculte des Sciences Agronomiques,Uni6ersite´ Catholique de Lou6ain, Place Croix du Sud,2bte11,1348Lou6ain-la-Neu6e,Belgium
Received 6 August 1999; received in revised form 9 May 2000; accepted 30 June 2000
Abstract
Our objective was to define sensitive morphological indicators that could be used to discriminate between drought sensitive and drought tolerant potato cultivars before final tuber yield is reached. A total of six potato cultivars contrasting for drought tolerance and earliness were subjected to three levels of water supply in two field trials in 1995 and 1996. We examined which parameter among stem height, number of green leaves and leaf length (the two latter parameters were only measured on two cultivars) was most sensitive to moderate drought conditions and responded similarly to water shortage regarding tuber yield, tuber number and average tuber dry weight. Drought reduced the number of green leaves in cultivars Krostar and De´sire´e, respectively, up to 22 and 25% 124 days after planting during the season but this effect levelled off towards the end of the season. Drought also induced significant length reductions (29, 43 and 53%, respectively, for the leaf numbers 17, 18 and 19) but there were no differences among the two cultivars examined. Stem height was sensitive to drought and the effect was stronger on later cultivars especially when water shortage started early as in 1996. In 1996, stem height ratios were negatively related (R2=0.80) to TDWS
(tuber yield ratio indicative of drought tolerance) whereas they were positively related in 1995 (R2=0.21). However,
care is needed as the negative relationship of 1996 was associated to earliness of cultivars. Indeed, stem height was less reduced in early cultivars (13 and 14% for Eersteling and Jaerla, respectively) than in mid-late cultivars (25 and 29% for De´sire´e and Nicola, respectively). In the drought treatment, no supernumerary tuber was observed across the season contrary to the irrigated treatment. According to the year, final tuber number or average tuber dry weight was reduced by the drought treatment. Reduction in tuber number (17%) in the drought treatment was not associated to lower tuber yields due to compensation by average tuber dry weight (6%). Different growth strategies can be followed by the potato plant to adapt to different drought conditions without tuber yield being significantly affected. © 2001 Elsevier Science B.V. All rights reserved.
Keywords:Solanum tuberosumL.; Morphology
www.elsevier.com/locate/eja
* Corresponding author. Tel.: +32-10-478-665; fax: +32-10-472-021.
P.M.K.Deblonde,J.F.Ledent/Europ.J.Agronomy14 (2001) 31 – 41
32
1. Introduction
Compared to other crops the potato crop is considered drought sensitive (Salter and Goode, 1967; van Loon, 1981). Drought stress influences the development and growth of potato shoots, roots and tubers. Drought stress also induces reduced leaf area and, in the long term, stem height and ground coverage are lower (Ojala et al., 1990). The effects of drought on a plant depends on the timing, duration and severity of the stress (Jefferies, 1995). Cavagnaro et al. (1971) showed that drought stress at the beginning of the tuberisation stage induced a longer period of tu-ber formation but decreased tutu-ber numtu-ber, growth and yield. This effect on tuber number has been confirmed by several authors (MacKerron and Jefferies, 1986; Haverkort et al., 1991). Stud-ies on the effect of drought on leaf senescence are scarce. In pot experiments, leaf senescence was found to be somewhat delayed by nitrogen (Vos and Biemond, 1992). Higher nitrogen supply in-creased by 3 weeks the life spans of leaves in comparison with the control. In field trials, the longevity of the canopy was found to be more strongly influenced by the continuation of new leaf production than by differences in leaf longevity between cultivars, or levels of nitrogen supply (Firman et al., 1995). Individual leaf longevity can be influenced by cultivar and by nitrogen but this seems mainly due to the effect on shading. Indeed, the interception of light by the upper leaves alters the quality of the light penetrating to deeper levels (Thomas and Stod-dart, 1980). The photosynthetic activity of the lower leaves lasted longer in the absence of nitro-gen than in the case of nitronitro-gen application (Fir-man and Allen, 1988). Thus, the light regime experienced by the leaf has more effect on the duration of the photosynthetic capacity than leaf age. The increase in tuber dry matter weight due to nitrogen application was achieved through ef-fects on leaf area duration rather than on effi-ciency of conversion of incident radiation (Firman and Allen, 1988). However in the case of drought appearing around the middle of the season the efficiency of conversion of incident radiation can be significantly reduced without affecting the
cu-mulated intercepted radiation (Deblonde and Ledent, 2000).
2. Material and methods
Field trials were conducted on potato crops grown on fine silt in Nodebais (Belgium) in 1995 and 1996, full details of which are given in De-blonde et al. (1999). Briefly, the trials comprised six contrasting European cultivars (five of which were common) reported to differ in drought resis-tance and earliness. We used two early cultivars (Eersteling, sensitive; and Jaerla, tolerant), two mid-early cultivars (Krostar Eersteling, sensitive, both years; Claustar, intermediate, in 1995; and Bintje, tolerant, in 1996) and two mid-late culti-vars (Nicola and De´sire´e, both tolerant). A strip-plot design with two factors (cultivar and water status) and four replicates was used in both years. Plot size was 3×9 m and three water supply treatments were applied (irrigated, rainfed and drought). Row distance was 75 cm, and the dis-tance between plants was 32 cm. Field trials were planted on the 15th and the 12th of April in 1995 and 1996, respectively. The irrigated treatment received water from rainfall plus a limited amount of irrigation (37 and 35 mm, respectively, in 1995 and 1996). The rainfed treatment received water from rainfall only. The drought treatment was imposed by placing a strong plastic sheet on the soil surface of the plots from 50% emergence to 8 weeks after thereby excluding 85 mm (1995) and 57 mm (1996) of rainfall. The irrigated, rain-fed and drought correspond to treatments 1, 2 and 3 in Deblonde et al. (1999).
3. Measurements
The number of green leaves was measured at 108, 124 and 157 days after planting in 1996 on three consecutive plants in each plot for Krostar and De´sire´e. When a leaf could not be considered as completely green, visual estimates of green leaf area were made on a scale of 25, 50, 75 and 100%. A yellow leaf was counted as fully senescent. Only leaves on the main stem were recorded.
Leaf lengths, from the 14th to the 19th leaf on the main axis, were measured in 1996 on two cultivars (Krostar and De´sire´e) 133 days after planting. According to Vos and Biemond (1992)
leaf numbers 10 – 18 on the main stem correspond to the leaves of larger size.
Stem height (distance from the soil surface up to the insertion of the petiole of ‘uppermost’ leaf)) was measured twice in 1995 (101 and 115 days after planting) and once in 1996 (109 days after planting) on all cultivars. We define the ‘upper-most’ leaf as the leaf attached on the top of the uppermost internode characterised by a length superior to 3 mm. Stems were upheld vertically during the measurements. Statistical analysis was based on F-test and contrast tested according to Scheffe’s test.
Tuber dry weight was determined on two plants lifted fortnightly from the central ridges in each plot with the aid of a spade. The first harvest started 60 and 67 days after planting in 1995 and 1996, respectively. Thus a total of 14 (early culti-vars) or 16 (late culticulti-vars) plants altogether were harvested to assess the evolution of tuber weight. Four plants per plot were lifted at final harvest. Tubers were separated from the rest of the plant and weighed in the field. The number of tubers per plot was determined (tubers smaller than 10 mm were not considered). Other details of tuber sampling and harvest are given in Deblonde et al. (1999).
We investigated if a relationship could be estab-lished between stem height and final tuber dry weight across cultivars.
4. Results
4.1. Stem height
P
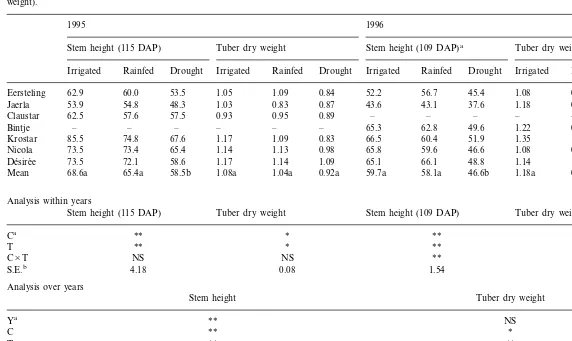
Stem height (in cm) and final tuber dry weight (in kg m−2) measured in 1995 and 1996 for three water treatments (n=8 for stem height andn=16 for tuber dry weight).
1995 1996
Tuber dry weight Stem height (109 DAP)a
Stem height (115 DAP) Tuber dry weight
Irrigated Rainfed Drought Irrigated Rainfed Drought Irrigated Rainfed Drought Irrigated Rainfed Drought
0.84 52.2 56.7 45.4 1.08
1.05 1.09 0.83 0.78
53.5 60.0
62.9 Eersteling
1.03 0.83 0.87 43.6 43.1 37.6 1.18 0.93 0.82
Jaerla 53.9 54.8 48.3
0.89 – – – – –
0.95 –
0.93 Claustar 62.5 57.6 57.5
– 65.3 62.8 49.6 1.22 0.99
Bintje – – – – – 0.96
0.83 66.5 60.4 51.9 1.35 1.05
1.09 0.99
Krostar 85.5 74.8 67.6 1.17
0.98 65.8 59.6 46.6
Nicola 73.5 73.4 65.4 1.14 1.13 1.08 0.88 0.97
1.09 65.1 66.1 48.8 1.14 1.16
1.14 0.98
73.5
De´sire´e 72.1 58.6 1.17
1.04a
68.6a 65.4a 58.5b 1.08a 0.92a 59.7a 58.1a 46.6b 1.18a 0.97a 0.92a
Mean
Analysis within years
Tuber dry weight Stem height (109 DAP)
Tuber dry weight Stem height (115 DAP)
*
aC, cultivar; T, treatment; Y, year; DAP, days after planting.
bS.E., standard error of cultivar×treatment interactions. * Significant at thePB0.05 level.
Fig. 1. Evolution of the soil water potential (absolute values) at the depth of 20 – 40 cm under the mother tuber, Treatment 1, 2 and 3 (respectively): irrigated, rainfed and drought.
treatment (PB0.01) and two mid-late cultivars (Nicola and De´sire´e) showed a stronger stem height reduction in the drought treatment than the other cultivars (PB0.01). Analysis over years indicated that stems were significantly shorter in 1996 than in 1995 and confirmed the presence of main effects but the presence of cultivar by treat-ment interactions was not established across years. This may be due to the drier season start of 1996 in comparison with 1995. In the drought treatment the growth of the plants depended on the water stored in the soil and was related to rainfall before plastic placing and this was much higher in 1995 than in 1996 (111 and 61 mm, respectively). The reduction of stem heights in the mid-late cultivars was therefore smaller in that treatment in 1995. The lowest soil water potential values measured at the depth of 20 – 40 cm reached −0.3 and −0.5 MPa in 1995 and 1996,
respectively (Fig. 1). Lower soil water potential values were undoubtedly reached in the drought treatment.
4.2. Relationship between stem height ratios and TDWS
Stem remained until 136 days after planting in 1995 and 122 days after planting in 1996. The relationship between stem height ratios and TDWS was positive in 1995 (R2
=0.21) and nega-tive in 1996 (R2
=0.80; Fig. 2). The lower deter-mination coefficient in 1995 was essentially due to cultivar De´sire´e which is at the upper left of the graph in Fig. 2 (R2 rose to 0.90 when cultivar
De´sire´e was omitted in the regression). This culti-var reduced strongly (20%) its stem height in the drought treatment in comparison with the irri-gated treatment but the reduction in tuber dry
P.M.K.Deblonde,J.F.Ledent/Europ.J.Agronomy14 (2001) 31 – 41
36
Table 2
Results of the linear regression for the relationship between stem height (cm) measured in the middle of the season and tuber dry weight (g m−2) at final harvest
Slope R2
Intercept n
1995
Irrigated 630.7 6.57 0.58 6
11.26 0.68*
Rainfed 300.5 6
2.26 0.03a
782.7 6
Drought
1996
2.89 0.07
Irrigated 1003.3 6
7.88 0.27
513.8 6
Rainfed
Drought 291.4 13.43 0.53** 6
aThe determination coefficient rose to 0.33 when cultivar Krostar was omitted in the regression but the slope remained non-significant.
* Significant at thePB0.05 level.
** Significant only atPB0.1.
tionship observed in 1996. Indeed, the drought stress started earlier that year which explains the lower stem height ratios in comparison with 1995. Also the drought stress ended earlier which al-lowed cultivars which had not finished their life cycle to recuperate a part of their tuber produc-tion at that time. This might explain the presence of early cultivars (Eersteling and Jaerla) at the right bottom side of the graph (slight stem height reduction of 13 – 14%) with strong tuber yield reduction (28 – 30%) whereas the mid-late cultivars (De´sire´e and Nicola) were at the opposite left corner (strong stem height reduction (21 – 24%) with only a slight tuber dry weight reduction (10 – 14%)).
4.3. Relationship between stem height and tuber dry weight
In the irrigated treatment, the slope of the linear relation between stem height and final tuber dry weight was not significantly different from zero (Table 2) although early cultivars had gener-ally lower stem height and yields than late culti-vars. We obtained a significant relationship between stem height and tuber yield for the rain-fed treatment in 1995. For the drought treatment in 1996 the relation was significant only at PB 0.1. In the other cases (the drought treatment, 1995; the rainfed treatment, 1996) the relationship between stem height and final tuber dry weight was not significant.
4.4. Leaf length
Leaf length (for each leaf number separately; data not presented) did not significantly differ among cultivars (absence of cultivar effects and cultivar by treatment interactions). Fig. 3 presents the leaf lengths (mean over cultivars) for the three water regimes for the leaf numbers 14 – 19. Al-though a tendency toward shorter leaf length was observed for the drought treatment for each leaf number it became only significant above the 16th leaf. Leaf lengths in the rainfed treatment were never significantly different from those in the irrigated treatment. The statistical analysis of the weight (7%) was slighter. All other cultivars
showed a good agreement between these two criteria that year. A first possible explanation is that stem height is not related to tuber yield but this does not explain the good relationship found for the other cultivars. A second more likely explanation is that drought was not terminal and De´sire´e, the latest cultivar of our set of cultivars, could recuperate a part of the tuber production at the end of the season. This was not or less possi-ble for earlier cultivars because they had finished or were ending their life cycle. This second expla-nation allows understanding of the negative
leaf lengths of different leaf numbers within a cultivar showed that leaves inserted higher had shorter lengths than leaves of lower ranks whatever the water regime. This reduction of lengths of the upper leaves was higher in the case of the drought treatment (significant leaf number by treatment interactions;F-test). This was observed in cultivar Krostar as well as in cultivar De´sire´e.
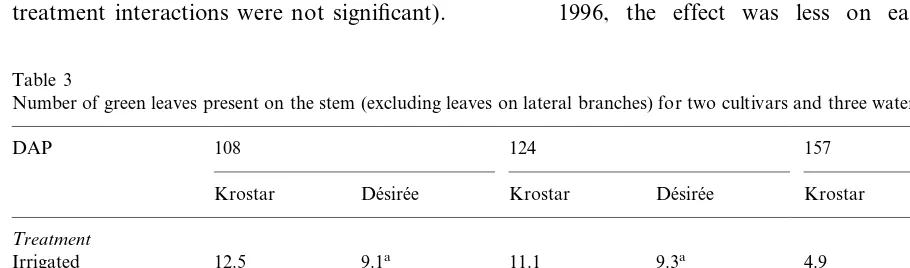
4.5. Number of green lea6es
The number of green leaves present on the main stem decreased through dates of measurements (from 108 days after planting to 157 days after planting; Table 3). Cultivar Krostar showed a significantly higher number of green leaves than De´sire´e only for one date (108 days after planting; PB0.01), afterwards differences between the two cultivars were not significant. The drought treat-ment reduced significantly the number of green leaves at two dates (108 and 124 days after planting; PB0.01) as did also the rainfed treatment for one date (124 days after planting) in comparison with the irrigated treatment. However, at the end of the season, differences between the three treatments levelled off with a tendency of the drought treat-ment to show a higher number of green leaves. This was especially so in cultivar Krostar. Cultivars behaved similarly across treatments (cultivar by treatment interactions were not significant).
4.6. Tuber number
The statistical analysis of tuber number mea-sured at final harvest and the corresponding aver-age tuber dry weight are shown in Table 4. Cultivar differences were observed for both parameters both years. Treatments differences were observed in 1995 for tuber number and for average tuber dry weight in 1996. In 1996, the average tuber number was significantly (PB0.05) lower than in 1995 (14.1 instead of 15.3, analysis over years) whereas the average tuber dry weight was significantly (PB 0.01) higher (20.5 instead of 17.2 g). The higher average tuber dry weight compensated largely the tuber number reduction observed that year. Fi-nally, the average total dry weights per plant were similar (264.1 and 288.4 g per plant in 1995 and 1996, respectively). The statistical analysis indi-cated for both parameters that one or several cultivars behaved differently across years. More-over, the effects of treatments on tuber number were also different between years. Differences in the fore-season may account for these results as indi-cated above.
5. Discussion
Stem height was sensitive to water supply, the drought treatment significantly reducing height. In 1996, the effect was less on earlier cultivars
Table 3
Number of green leaves present on the stem (excluding leaves on lateral branches) for two cultivars and three water regimes in 1996a
DAP 108 124 157
Krostar De´sire´e Krostar De´sire´e Krostar De´sire´e
Treatment
12.5 9.1a 11.1
Irrigated 9.3a 4.9 5.5a
Rainfed 11.0 8.5a 9.3 7.8b 5.3 4.9a
7.5b 8.7 7.0b
Drought 10.7 5.8 5.6a
Cultivar ** NS NS
NS **
Treatment **
NS NS NS
Cult.×treat.
S.E.b 0.47 0.25 1.06
P
Tuber number per plant and average tuber dry weight (g m−2) measured at final harvest (average of 16 plants) in 1995 and 1996 for the three water treatments
1996 1995
Cultivars
Average tuber dry weight Tuber number
Tuber number Average tuber dry weight
Irrigated Rainfed Drought Irrigated Rainfed Drought Irrigated Rainfed Drought Irrigated Rainfed Drought
12.0 16.2 14.1 14.7 16.3
15.1 13.4 14.2 12.9
16.9 19.7
16.6 Eersteling
22.9 18.5 22.7 6.8 5.9 6.0 42.1 38.0 34.0
Jaerla 11.2 10.8 9.2
25.2 – – – – –
17.7 –
17.0 Claustar 13.1 13.0 8.6
– 16.6 16.8 18.1 17.9 14.2
Bintje – – – – – 13.2
13.1 19.8 16.9 15.6 16.7 15.2
12.9 15.6
Krostar 20.0 20.3 15.4 14.2
14.2 14.5 15.1 21.1 17.3 20.4 12.5 12.4 11.4
Nicola 19.3 18.6 16.1
25.0 11.1 13.8 11.9 25.4 20.4
21.4 19.9
23.6 De´sire´e 12.1 13.1 10.6
Mean 15.4a 15.9a 12.8b 17.8a 16.4a 18.9a 15.3a 14.1a 14.5a 21.8a 19.1b 17.9b
Analysis within years
Average tuber dry weight Average tuber dry weight
Tuber number Tuber number
Ca ** ** ** **
Average tuber dry weight Tuber number
aC, cultivar; T, treatment; Y, year.
(reduction) than on later cultivars. Indeed the reduction was 13 and 14% for Eersteling and Jaerla, respectively, and 25 and 29% for De´sire´e and Nicola, respectively. This may be due to the shorter vegetative cycle of the early cultivars and thus to the shorter duration of the possible limitation by water shortage. This escape mechanism was not observed in 1995. Indeed, smaller stem height reductions were not observed in earlier cultivars that year because of the water stored under the plastic sheet and the later start of the drought conditions. The cultivar by drought interactions were mainly due to the cultivars of the two extreme earliness groups. Within an earliness group, such an interaction was not found probably because of a lack of cultivars contrasted for drought tolerance. Future studies should concentrate on that aspect to ensure the usefulness of such parameter in breeding programmes.
The relationship between stem height ratios and TDWS (drought tolerance index) was positive in 1995 and negative in 1996. Stem height ratios accounted for 80 and 20% of the variation of TDWS in the two cases, respectively. In 1996, the determination coefficient increased up to 90% when cultivar De´sire´e was omitted. We believe that the timing of the drought stress and the absence of terminal drought were the main factors explaining the inconsistent relationships over years between these two criteria. The earlier drought of 1996 had more effects on stem height than in 1995 but the stress was relieved 14 days earlier in 1996. This allowed more recuperation in tuber dry weight production for later cultivars at the end of the season as all necessary nutrients had not been used or washed off earlier and more especially nitrogen was still available. The negative relationship found in 1996 between stem height ratios and TDWS was strongly related to the earliness of cultivars as early and late cultivars were grouped at the two extremities of the regression line (Fig. 2). This was not the case with the positive relationship observed in 1995. Further research should focus on one group of earliness with more cultivars to ascertain the existence of such either positive or negative relationship between stem height ratios and TDWS and avoid
the effects of differences in earliness. The high determination coefficients emphasise the potential interest of stem height measurements for drought tolerance assessment in early stages of the breeding process.
R2 corresponding to the relationship between
ob-P.M.K.Deblonde,J.F.Ledent/Europ.J.Agronomy14 (2001) 31 – 41
40
tained with different stem heights as was shown in 1996 and to a lesser extent in 1995 and no rela-tionship was observed between the two characters. In drought conditions, a significant relationship between stem height and tuber dry weight was observed especially when drought appeared early in the season and lasted long enough to affect also tuber production. Stem growth was more affected when drought appeared early.
Leaf lengths in the two cultivars measured in 1996 were significantly reduced by drought from the 17th leaf number upwards (29, 43 and 53% reductions for the leaves 17, 18 and 19, respec-tively) whereas lengths of leaves of lower number were not significantly affected. The absence of cultivar differences and cultivar by treatment in-teractions for leaf length might indicate that leaf length was not a suitable discriminant parameter for water stress tolerance but care is needed as this was based on two cultivars and 1 year only. The number of green leaves present on the main stem was reduced up to 22 and 25% in cultivars Krostar and De´sire´e, respectively, 124 days after planting by our drought treatment during the season whereas towards the end of the season plots affected by drought had a tendency to show similar or even higher numbers of green leaves than in the irrigated treatment. This confirms the higher ground cover values observed in 1996 in the drought treatment at the end of the season (Deblonde and Ledent, 2000) and shows the ca-pacity of potato plants to compensate at the end of the season for radiation which was not inter-cepted during the early part of the season. The available nitrogen which was not consumed dur-ing the drought stress due to the dry conditions became again available when rainfall resumed which in turn may have favoured the maintenance of green leaves at the end of the season. In the 1996 field trial and for cultivar Krostar only, leaves on lateral branches appeared at the basis of the stem at the end of the season (visual observa-tion) and participated in the maintenance of ground cover. Future studies on this aspect should be considered.
All three morphological parameters were sensi-tive to drought and participated to the reduction of intercepted radiation at the crop level. The
cultivar×treatment interaction observed for in-tercepted radiation (Deblonde and Ledent, 2000) might be partly related to the significant culti-var×treatment interactions found for stem height in 1996 (no interactions was observed in 1995 for stem height). There was however no significant interaction for the number of green leaves and leaf lengths, but this was measured on only two cultivars in 1996 which does not allow to draw a clear conclusion. In 1996, a stronger reduction in stem height was observed in later cultivars, than in earlier cultivars. However, it was essentially in the early cultivars (Eersteling, Jaerla and Krostar) that intercepted radiation was reduced (Deblonde and Ledent, 2000). Strong reductions of inter-cepted radiation seem therefore not to be neces-sarily related to strong stem height reductions. Further research should concentrate on leaf length and leaf senescence.
6. Conclusion
All measured parameters (number of green leaves, stem height, leaf length) were sensitive to moderate water shortage in the field. Among the three parameters measured, only stem height showed a different response according to cultivars when water shortage was applied early in the season and maintained sufficiently to affect also tuber production. Drought later in the season could not sufficiently affect enough stem height to allow discrimination among cultivars.
Stem height ratio seems to be a very promising character to discriminate for drought tolerance as the relationships between stem height ratios and TDWS were good and these measurements were performed before final yield was reached which could shorten the screening process. Further re-search is however needed to clarify the impor-tance of earliness in this relationship.
References
Cavagnaro, J.B., De Lis, B.R., Tizio, R.M., 1971. Drought hardening of the potato plant as an after-effect of soil drought conditions at planting. Potato Res. 14, 181 – 192. Clarke, J.M., Romanagosa, I., Delauw, R.M., 1991. Screening
durum wheat germoplasm for dry growing conditions: morphological and physiological criteria. Crop Sci. 31, 770 – 775.
Deblonde, P.M.K., Ledent, J.F., 2000. Effects of moderate drought conditions on crop growth parameters and earli-ness of six potato cultivars under field conditions. Agronomie (in press).
Deblonde, P.M.K., Haverkort, A.J., Ledent, J.F., 1999. Re-sponses of early and late potato cultivars to moderate
drought conditions: agronomic parameters and carbon isotope discrimination. Eur. J. Agron. 11, 91 – 105. Firman, D.M., Allen, E.J., 1988. Field measurements of the
photosynthetic rate of potatoes with different amounts of nitrogen fertiliser. J. Agric. Sci, Cambridge 111, 85 – 90. Firman, D.M., O’Brien, P.J., Allen, E.J., 1995. Appearance
and growth of individual leaves in the canopies of sev-eral potato cultivars. J. Agric. Sci., Cambridge 125, 379 – 394.
Haverkort, A.J., Van de Waart, M., Bodlaeander, K.B.A., 1991. The effect of early drought stress on numbers of tubers and stolons of potato in controlled and field con-ditions. Potato Res. 33, 89 – 96.
Jefferies, R.A., 1995. Physiology of crop response to drought. In: Haverkort, A.J., MacKerron, D.K.L. (Eds.), Potato Ecology and Modelling of Crops under Condi-tions Limiting Growth. Kluwer Academic Publishers, Dordrecht, pp. 61 – 74.
MacKerron, D.K.L., Jefferies, R.A., 1986. The influence of early soil moisture stress on tuber numbers in potato. Potato Res. 29, 299 – 312.
Ojala, J.C., Stark, J.C., Kleinkopf, G.E., 1990. Influence of irrigation and nitrogen management on potato yield and quality. Am. Potato J. 67, 29 – 43.
Salter, P.J., Goode, J.E., 1967. Crop responses to water at different stages of growth. Res. Rev. Commonwealth Bu-reau Hortic. East Malling 2, 93 – 97.
Thomas, H., Stoddart, J.L., 1980. Leaf senescence. Ann. Rev. Plant Physiol. 31, 83 – 111.
van Loon, C.D., 1981. The effect of water stress on potato growth, development, and yield. Am. Potato J. 58, 51 – 69.
Vos, J., Biemond, H., 1992. Effects of nitrogen on the devel-opment and growth of the potato plant. 1. Leaf appear-ance, expansion growth, life spans of leaves and stem branching. Ann. Botany 70, 27 – 35.
Weber, W.E., 1984. Selection in early generations. In: Lange, W., Zeven, A.C., Hogenboom, N.G. (Eds.), Effi-ciency in Plant Breeding. Proceedings of the 10th Con-gress of the European Association for Research on Plant Breeding, EUCARPIA, Wageningen, The Netherlands, 19 – 24 June 1983. Pudoc, Wageningen, pp. 72 – 81.