The production planning process for a network of
"
rms in the
textile-apparel industry
Alberto De Toni!,
*, Antonella Meneghetti"
!DIEGM - Dipartimento di Ingegneria Elettrica, Gestionale e Meccanica, University of Udine, Via delle Scienze, 208, Udine, Italy "DiEM - Dipartimento di Energetica e Macchine, University of Udine, Via delle Scienze, 208, Udine, Italy
Abstract
The paper investigates how the decision variables of the production planning process for a network of"rms in the textile-apparel industry, i.e. planning period length, material availability, the link between production orders and customer orders as regards colour mix, can a!ect the system's time performance, whose measurement has involved the creation of two new indicators. To adhere to reality, we studied and collected actual data from one of the most important Italian companies, the Benetton Group SpA and using these observations as a basis, a simulation model was built. Only the production planning period compression has been recognised as yielding a signi"cant improvement in the external time performance. A relation between the external time performance and the internal time performance of the network is recognised. The cash#ows associated with di!erent lengths of the production planning period are analysed. ( 2000 Elsevier Science B.V. All rights reserved.
Keywords: Production planning; Network of"rms; Time-based competition; Textile-apparel industry
1. Introduction
There is ample literature regarding investigations on time-based competition issues involving single enterprises. Based on the distinction between the
external and the internal con"guration of a "rm,
two types of time performances have been identi-"ed: the external, visible to clients, and the internal, measurable by the company but not manifest to customers [1]. The former can be related to the frequency at which new products are introduced into the market, thus measuring the innovativeness
*Corresponding author. Tel.:#39-0432-558330; fax# 39-0432-558251.
E-mail address:[email protected] (A. De Toni)
of supply, and to delivery time, which describes
the ability to quickly satisfy clients'needs. As they
can positively modify the customers' perception
[2,3], they have to be regarded as the source of competitive advantages in a time-based phil-osophy.
The paths which can be followed by an enterprise to improve its external time performances have been reduced to two alternatives [4]: a traditional approach, based on applying over-resources (per-sonnel, inventory, etc.) and increasing costs, and an innovative one, based on sped-up processes leading to a structurally faster company without additional costs. The latter approach deals with internal time performances as the means by which the external ones are improved; shorter time-to-market and lead times in the productive-logistics phases, in fact,
describe an agile enterprise which can pro"t from its quickness [5].
Practices that lead to reducing the time needed at the product development stage have been generally related to Concurrent Engineering, as analysed by
many authors [6}10]. In regard to the contraction
of lead times along the operative chain, the
litera-ture has identi"ed successful practices with the JIT
core ones in the area of procurement [11,12],
manu-facturing [2,3,13}17] and distribution [18,19].
Very little, instead, is known about the relation between practices and time performances for new
forms of organisation such as networks of "rms.
These systems can be placed between the two
ex-tremes represented by fully independent "rms,
linked only by market laws, on one hand and
hier-archical enterprises on the other. Network con"
g-urations allow small and medium sized "rms to
better face the new challenges from world-wide competition and the great Ford age companies to
achieve the#exibility and responsiveness required
by a turbulent market [20,21]. Therefore, as
time-based concepts are extended to networks of"rms,
areas for improvement and successful actions must
be identi"ed.
It has been suggested that a crucial aspect of networks is the coordination of its units, making, in
fact, the system a`purposeful con"gurationa[22].
Therefore many authors have highlighted the role of the enterprise that manages the whole network,
which has been called the hub "rm [23], spider's
web [24], strategic centre [25]. We have been
won-dering what behaviour this main "rm should
undertake to transform the network into a time-based competitor.
If the focus is set on productive-logistics phases, coordination is performed by production planning. Consequently, it can be reasonably expected to represent the process by which time-based concepts are introduced into the system. Production plann-ing, in fact, determines the rate at which materials enter the operative chain and manages their
progress. Thus, it can a!ect the rapidity and the
punctuality provided to clients and therefore the
system's ability to attract more customers and
strengthen their loyalty. Our attention has so been focused on the production planning process of net-works as the main area for improvements.
Since the Italian textile-apparel industry is re-nowned throughout the world and excellent cases are available for investigation, we decided to direct our analysis to it. On the one hand, in fact, its customers are strongly sensitive to external time performances. The fashion market could probably
be considered one of the most turbulent and"ckle,
requiring a quick response to fashion changes whose rhythms are becoming more and more
accel-erated to satisfy customers'propensity for anything
modern and unusual. Therefore time-based com-petition has been for many years a coherent stra-tegic orientation for this industry. On the other hand, a characteristic of the Italian industrial sys-tem is the great number of small and medium sized enterprises, that have fostered the spread of
net-works of "rms and particularly in the
textile-ap-parel industry the creation of successful systems like the Benetton Group.
In the following sections, the network model we
developed by analysing Benetton's production
sys-tem is described and constraints to the production
planning process clari"ed.
The actions that are supposed to lead to time performance improvement are established and then veri"ed by simulation. Finally, the results are ex-plained and paths leading towards time-based
competition identi"ed.
2. The system model and the production planning process
After collecting and studying actual data from
Benetton's production system, a logic model of a
knitwear network was built. The main"rm
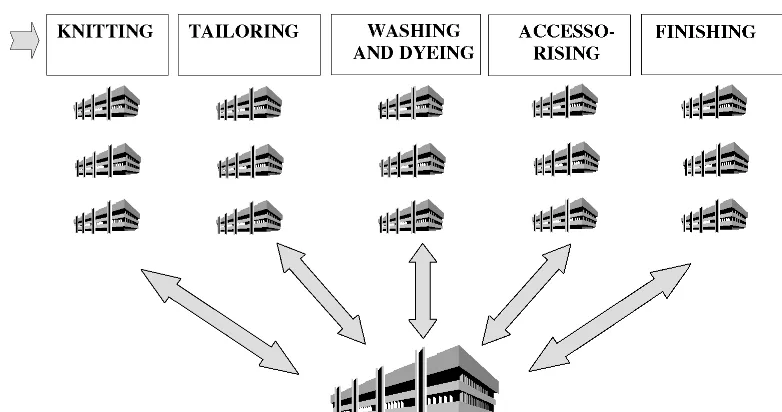
respon-sible for the strategic orientation and coordination of the network is recognised; it entrusts each phase of the production process to a certain number of"rms (see Fig. 1).
The system works by successive productive cam-paigns, that are related to seasonal collections, with a make-to-order approach. Due to the high varia-bility of the market and the aggressiveness of com-petitors, all client orders are not received before the associated campaign begins, but are continuously
collected during its ful"lment. For each collection
Fig. 1. The operative chain of a knitwear system.
the system promises to release products to its cli-ents. The system is not provided with a picking area where client deliveries can be reshaped and there-fore production launches are directly related to customer orders and have to comply, in particular, with the colour mix.
From a production planning point of view, the
critical phase is the knitting one, where speci"c
machines are needed depending on product charac-teristics, in contrast to the downstream stages where more generic machinery is required. Once
products are assigned to knitting "rms and
pro-cessed, they can proceed in cascades along the operative chain towards successive stages. Clothes coming from the knitting phase are sewn in the tailoring stage, then washed to remove impurities and dyed if necessary; successively products are submitted to the accessorising phase, which
in-volves embroidering, appliqueHing, sewing on
buttons and zips, and then to the "nishing
one, where they are pressed, labelled, folded and enveloped.
In comparison to what commonly occurs in
manufacturing "rms, in the textile-apparel system
described above job size is not a pre-de"ned
char-acteristic, deriving from a previous production de-cision, but is a short-term contextual decision.
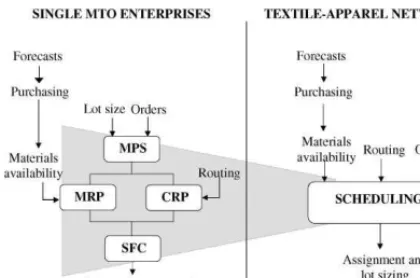
In a single make-to-order organisation, in fact, usually a master production schedule (MPS) is computed on the basis of client orders and a pre-viously established economic lot size, then its
feasi-bility is checked by materials requirements
planning (MRP) and capacity requirements
plan-ning (CRP) and "nally in the shop #oor control
(SFC) jobs are assigned to available work centers and sequenced (see the left side of Fig. 2).
In a network of di!erent"rms, instead, the
tradi-tional lot size concept is replaced by one closer related to a time period rather than to a certain quantity of pieces to be processed. A production
order released by the main"rm is associated with
the duration of the knitting capacity loading; the length of time of a production order is theoretically
equal to the planning period. Due to the di!erent
production capacity of"rms in the knitting phase,
job size depends on the"rm it is assigned to, i.e. on
the number of machines available in each knitting unit of the network.
Therefore the process of production order de"
Fig. 2. The production planning process in single make-to-or-der enterprises and in textile-apparel networks.
to process among those already ordered by clients,
to which knitting "rms to assign them and what
quantities to produce.
3. The production planning areas of analysis
The main objective of this study was to analyse
how the production planning process could a!ect
the network performance from a time-based point of view. Observations of the actual system in-dicated two important steps.
First of all, develop a rational method for generating production orders, by which the whole network could be oriented to the achievement of external time-based performances, such as respect-ing the promised delivery date for each collection. A computerised procedure to establish, in each planning period, which items to produce, which "rms they should be assigned to and how many units to manufacture, observing the proper con-straints, was not recognised in the actual system, where such decisions were personally taken by an experienced planner.
The second step involved the analysis of those
variables that can a!ect solutions calculated by the
algorithm developed in the "rst stage. Three
fac-tors, in our opinion, could alter production launches and very likely the time-based perfor-mance of the network:
f the length of the production planning period that
in#uences job sizing and the timing with which
products are introduced into the system;
f yarn availability, that limits quantities to be
assigned to knitting "rms in each planning
period;
f the link between production orders and client
orders regarding the colour mix, that represents a constraint when determining which products can be processed in each planning period.
The time duration of a production order, which in theory is equal to the planning period, is a crucial element in the system, as the size of jobs assigned to each unit depends on it. The queuing theory has suggested how the internal performance of lead time is related to the variability between process times due to lot size and set-ups, to the variability
of arrivals at the work centre, a!ected by order
release policies, to the tra$c intensity directly
in-#uenced by the number of set-ups and by lot size,
and to a scale e!ect associated with the average
process time of each job, again a!ected by lot sizing
[26,27]. Since in the analysed network lot size is replaced conceptually by the length of the planning period, it is reasonable to suppose that it could
a!ect time performances. In particular, shortening
the planning period and consequently increasing its frequency may allow the system greater responsive-ness to client order receipts and quite likely an improved capability in assigning jobs to the
net-work's production units. Nevertheless, increasing
the number of production launches and therefore of set-ups could be expected to decrease the
produc-tivity of the knitting "rms and create congestion
downstream, thus prolonging the duration of the productive campaign and impeding observance of the promised delivery date.
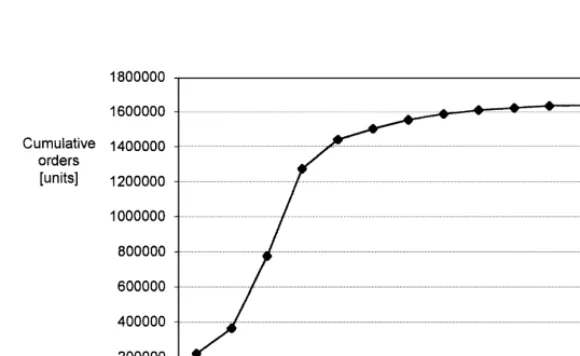
Fig. 3. Client orders arrivals during the productive campaign. capacity of assigning products to the knitwear
fac-tories, especially at the beginning of the campaign, would be enhanced, but the improvement must be compared to the risk of overstocks.
In an attempt to lighten the constraint of colour mix in the scheduling process and achieve a better performance, colour incomplete assignments could be tolerated, when needed to saturate knitting "rms, by creating a small picking area where only jobs not completely conforming to client orders could wait until rejoining the coloured units that are lacking before delivery. Costs related to keeping such an inventory must be compared to the real improvement in the external time performance ob-served by customers.
To avoid the development of models and methods that oversimplify the complex reality they have to represent and, therefore, lead to results not truly applicable, we used the data collected from
Benetton's production system. In particular we
analysed the wool production division and here singled out a portion of an autumn/winter collec-tion, composed of 149 articles, for a sales amount of 1 640 000 units, to be processed in 39 small knit-wear factories. The behaviour of client order arri-vals is shown in Fig. 3.
As regards the"rst step, the scheduling problem
was faced by both linear programming and
heuris-tics (Section 4), while in the second step the e!ects
of planning factors on network time performance were, instead, analysed by simulation (Section 5).
4. Production planning methods
The actual system has revealed a type of inertia
in the"rst periods of the productive campaign. In
those moments the assignment process is limited by the few client orders present in the portfolio. The availability of coloured yarn is another constraint: due to long replenishment lead times purchase or-ders for materials to be delivered at the beginning
of the campaign are set, in fact, when customers'
reaction to fashion models are not yet known and therefore they are formulated with prudence. The capacity of the knitting factories is poorly loaded in the early periods of the productive campaign. Since they are capital-intensive, this phenomenon can
a!ect the return on investments; moreover, it
be-comes unfeasible to provide the network with a greater over-capacity to be used later, when the system might reach higher levels of productivity, to avoid postponing the end of the campaign. Thus, it
appears that saturation of knitting"rms and
to yarn availability has suggested the adoption of a very dynamic approach to production, where the planning horizon is maintained equal to a single planning period to prevent any resistance to
cha-nges. This re#ects the low predictability and
turbu-lence of the market and can be faced only by a very
#exible organisation like the network of small
inde-pendent"rms built by the Benetton Group.
While the production planning process of such a textile-apparel network is naturally oriented to the short term, performance has to be analysed, instead, in relation to a whole collection and the associated productive campaign. Thus the problem arose of setting the objective function for such a limited time period, while results will be evaluated over a longer horizon. We chose to maximise the
capacity loading of the knitting"rms, because
re-source saturation and network punctuality ap-peared to be related in some way in the actual system. Moreover it appeared as a compromise between minimising the number of articles not de-livered on time and avoiding the forced assignment of models with a lower process time but very likely with a lower market value.
As regards the classi"cation of the model on the
basis of the production system typology [28], it can
be regarded as a single-stage (only the"rst knitting
phase is submitted to the planning process ana-lysed) with parallel uniform machines, because
every knitting"rm can be identi"ed with a
proces-sor characterised by a di!erent production rate that
depends on its actual capacity (number and type of
machines in the "rm), but not on products to be
made.
The problem can be solved by integer program-ming as follows.
Letx
ij be the number of units of product j
as-signed to "rm i, with j"1,2,J and i"1,2,I.
j is the process rate for productj(unit/h);
r
ij is a large positive number that can force theproduction of those particular itemsjexpressly requiring the high technology machinery
pos-sessed by "rm i, which can be present in the
network in a limited portion due to the high investments needed;
a
ij is a Boolean parameter equal to 1 only if ma-chines in
"rm i have proper tools to process
productj(e.g. the guides needed to knit wool
and rubber);
jis the present ordered quantity of article
j;
2. Materials availability constraint:
J
jnkhis the amount of yarnk,h-coloured,
needed to make a typen(n"1,2,N
j) coloured
unit of product j, c
jn is the portion of product
junits of colour typenandd
khis the stock level
of yarnk, colourh;
3. Capacity loading constraint:
J
ij is the set-up time for product j to be
made in"rmiandy
ijis a boolean variable that
is equal to 1 only if productjis assigned to"rmi;
4. The Boolean variabley
ij must be null if xij is
null, i.e. if productjis not assigned to"rmi:
y
ij)xij ∀(i,j);
5. The Boolean variabley
ij must be equal to 1 if
x
ijis not null, i.e. if productjis assigned to"rmi:
x
ij)Mijyij ∀(i,j)
whereMis a large positive number;
6. Realistic size of assignment constraint:
x
iis the minimum portion of the capacity
b
i to be loaded, established for each knitting
7. Sign restriction:
The problem is a mixed integer programming in-stance and therefore is NP complete [29]; thus, solution time grows exponentially with the size of
the problem (I)Jreal variables#I)Jinteger
vari-ables; for actual system dataI"39,J"149,I)J"
5811) towards unacceptably large values. This led us to develop heuristics, in order to obtain a more
#exible and faster method for building production
plans and running simulations. We were inspired
by the "nite loading approach [30] to create a
vertical logic procedure, which assigns the best
available product to each knitting "rm, and an
horizontal logic one, which instead tries to
associ-ate each product with the best knitting "rm for
making it. Both the heuristics proceed by creating
for each"rm or each article a set of possible
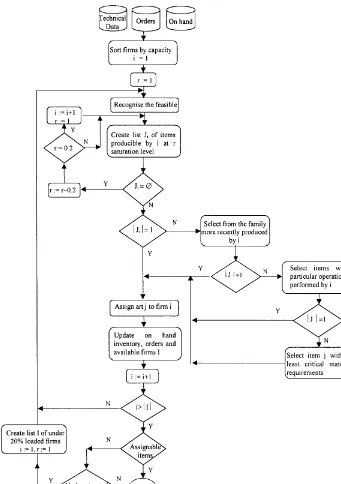
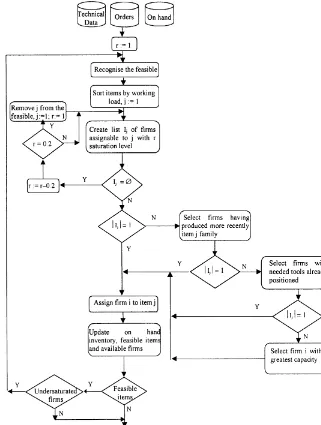
assign-ment alternatives and by shortening this set on the basis of several criteria applied in sequence, such as ensured capacity occupation, set-up time and re-quired machine characteristics, until a single car-dinality is reached. Flow diagrams of the vertical and horizontal logic procedures are shown in Figs. 4 and 5, respectively.
The procedures were compared with the mixed integer programming model coded by Cplex; the vertical heuristic was found to behave better than the horizontal one, with an average error relative to the optimal solution given by the mixed integer programming model equal to 4.4% and 10% re-spectively. Both the greedy procedures showed an extremely improved resolution time due to an O(nlogn) computational complexity, particularly relevant as the size of the problem increased during the analysis. Hence, the production plan for each period, i.e. the input for simulation runs, was built by using the vertical logic procedure.
5. Analysis of production planning variables
To study how production planning period length, yarn availability and colour assortment can
modify the time-related performance of the system and consequently, from a time-based competition point of view, enhance its ability to satisfy
cus-tomers'needs, simulation experiments were carried
out [31].
5.1. Simulation model development
To build a simulation model that is more adher-ent to reality, we used the actual data collected and
opinions and suggestions o!ered by Benetton
per-sonnel.
The simulation model was built using the
Simple##software package, which is object
oriented and consequently has a greater capacity to represent complex systems with various hierarchi-cal levels. It was, in fact, possible to assume a top-down approach to establish the main links between each phase along the supply chain and then detail each component, avoiding possible dis-tortions of interactions at the upper levels.
In each period, jobs enter the system as planned by the vertical heuristic. After being knitted in one of the 39 small factories, when the right quantity of items is reached, they are loaded into trucks and then moved on to the next phase in the operative chain. The transport times through the network are set according to the average values recorded in the actual system.
The assignment of each job to the proper"rm in
the tailoring, accessorising and "nishing stages is
performed by choosing the least loaded factory. As happens in the actual system, the washing and dyeing phase, considered to be a core competence of the main enterprise, is centralised. Here machin-es are loaded to the permitted weight merging items
of di!erent jobs on the basis of yarn type and
colour. Attention is paid to the rotation of dark and light colours in dyeing machines to reduce set-up times.
To maintain productivity aligned with the ob-served values, breakdowns have been introduced into every shop.
5.2. Experimental design
A whole seven-month production campaign
Fig. 4. Flow diagram of the vertical logic heuristic. factorial design, where each of the three production
planning variables described above was studied at
two di!erent levels (see Table 1).
The length of the planning period was set equal to respectively 3 weeks and 1 week.
Fig. 5. Flow diagram of the horizontal logic heuristic.
especially at the beginning of the campaign, we tried to anticipate on-hand inventory, by increasing
the coe$cient used to space out purchase orders,
equal to the portion of forecast requirements that has to be provided in each period. So we studied the behaviour of the simulated system with values of
purchasing coe$cients equal to those used by the
actual system and those with a 50% increase. For
example, for a material whose purchase order quantity was normally set at 10% of the entire forecasted requirements, a purchase order quantity of 15% of forecasted requirements was considered as the second level.
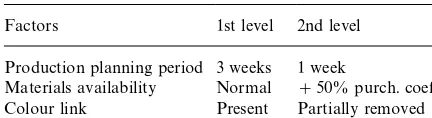
Table 1
Factors and relative levels considered in the 23factorial design of simulation experiments
Factors 1st level 2nd level Production planning period 3 weeks 1 week
Materials availability Normal #50% purch. coe!. Colour link Present Partially removed
removed. We allowed, in fact, the heuristic to gener-ate colour-incomplete production orders when needed to saturate factories, providing the simula-tion model with an area where jobs could wait until rejoining the lacking coloured units before leaving the system.
5.3. The responsevariable
Since in the textile-apparel industry production
is ful"lled by successive campaigns, performances
have to be evaluated in relation to the whole collec-tion; consequently, global measures are required. For each collection, the analysed network presents a single date promised to all its clients, before which it commits itself to carry out all the orders received. Delivery punctuality is particularly important for network customers, who are retailers, since it
af-fects their ability to"ll their shelves with new
prod-ucts on time with fashion changes and therefore
capture"ckler and"ckler consumers.
As an appropriate measure to evaluate system time performances appreciable by clients with
re-gard to a whole collection we propose theweighted
average delivery anticipation (DA), which we have de"ned as follows:
DA"+Ni/1QiAi
+Ni/1Q
i
(2)
whereQ
iis the number of units of thei-th job, with
Nthe total number of jobs processed by the system
andA
iis the anticipation of thei-th job, de"ned as
the elapsed period (days) between the promised delivery date and the moment each job exits the system and products can be sent to clients (see Fig. 6).
Fig. 6. AnticipationA
iof theith job composed byQiunits.
DA provides an estimate of the system capacity to anticipate product realisation, i.e. to react quickly to sales orders that accumulate during the productive campaign. If DA were improved, the productive campaign could start later, when the demand is better known, assuring clients the same punctuality. In this way, the yarn purchasing pro-cess would be more easily managed and conse-quently left-over stocks reduced. Conversely, the promised date could be brought nearer to the beginning of production, without deteriorating the capacity of the system to deliver on time. Such an action would be convenient if the system wanted to accelerate the frequency of introducing new products into the market by launching more collec-tions in fast succession during the same season, as
happens in the`#ash collectionaphenomena. The
capability of sequencing productive campaigns without overlapping them, thanks to an improved DA, would lead to more linear processes and easier coordination between network units.
6. Simulation results
The main e!ects of the three factors, de"ned as
the di!erence between the average response of the
system when a factor moves from its 1st to its 2nd level, are shown in Table 2.
Only the length of the production planning
peri-od strongly a!ects time performance achieved by
the system and measured by the delivery anticipa-tion.
Therefore, only the action of shortening the
Table 2
Main e!ects on delivery anticipation of the three analysed factors
Factors Main e!ects on delivery anticipation DA (d) Production planning period length 14.052
Materials availability 0.564 Colours assortment link 1.024
the external time-based performance of the net-work and must be considered by management. So the availability of materials and colour link were no longer investigated, but analysis was directed at the
e!ect of changing the production planning period.
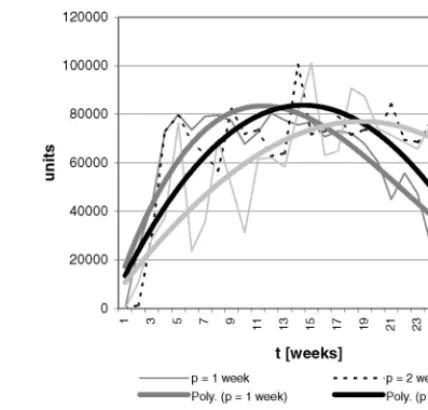
By compressing the production planning period from 3 to 1 week, we can see how the asymmetry of the curves, which interpolate products exits from the system during the production campaign, is
positively modi"ed (see Fig. 7); consequently the
weighted average delivery anticipation DA is in-creased.
The planning period a!ects the internal time
performance, recognisable only by the system itself and not by its clients, along two directions.
As its length is decreased, the average lead time is reduced (see Table 3), because of a shorter job processing time; this is due to a smaller job size,
which derives, in fact, from the attempt to "ll the
knitwear factories to capacity during a shorter planning period.
The contraction of lead times is not proportional to the related reduction in the planning period, because as job size is decreased a higher number of jobs is generated during a campaign, leading to increased set-up (see Table 4) and queue times, which counteract advantages arising from shorter processing times.
The reduction in the planning period also
enhan-ces the ability to assign jobs to the knitting "rms
especially in the early periods of the productive campaign, when the constraints related to
avail-ability of materials and customers'orders strongly
condition the planning process.
The reaction to customers' orders is better with
a shorter planning period but the number of set-ups is increased and consequently the set-up time, the
Fig. 7. Products exits from the system during the production campaign; actual data and polynomial interpolation.
Table 3
Average lead times and Work-In-Process in relation to di!erent production planning period lengths
Production planning
e!ect becoming more evident as the campaign
ad-vances and the constraints become less intense. In
Fig. 8 average saturation of the knitting"rms
dur-ing the productive campaign is showed. Observdur-ing the interpolation curves, it can be seen how a
com-pression of the planning period modi"es their
asymmetry, moving their median towards the be-ginning of the campaign. Thus, a 1 week planning period leads to a higher level of saturation in the "rst production periods, but to a longer duration of the campaign due to increasing set-ups.
These e!ects can be summarised by theweighted
average anticipation of saturation(SA), that we have de"ned as follows:
Table 4
Jobs characteristics and total set-up times during a campaign due to di!erent production planning period length Prod. planning
period length (weeks)
Number of jobs Average job size (units)
Fig. 8. Average saturation of the knitting "rms during the production campaign; actual data and polynomial interpola-tion.
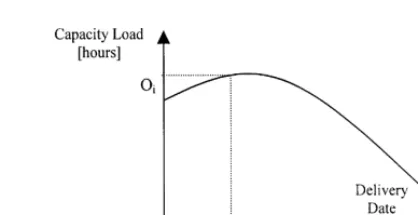
whereO
iis the actual knitting hours assigned in the
ith planning period,Nthe total number of planning
periods and A
i the anticipation of the ith period,
de"ned as the period (days) elapsed between the promised delivery date and the moment jobs of each period enter the system (see Fig. 9).
The increase in the average anticipation of
satu-ration could provide the "rms of the system with
a greater chance of loading their available capacity
by o!ering it to other subjects not belonging to the
network, during the periods of structural decline of the campaign. If the asymmetry of the saturation
curve were modi"ed so that only two consecutive
periods of high and low saturation levels were re-cognised, each production unit could rely, in fact,
on an uninterrupted time interval with su$cient
Fig. 9. AnticipationA
iof theith period of capacity loading.
resources to be dedicated to other signi"cant
com-mitments. On the other hand, if the network were
used to launch#ash collections, i.e. mini collections
added to the usual winter and summer ones to improve the frequency of introducing new products to the market, then a greater anticipation of satura-tion could allow the campaigns to be sequenced instead of overlapped, reducing the complexity of the production system.
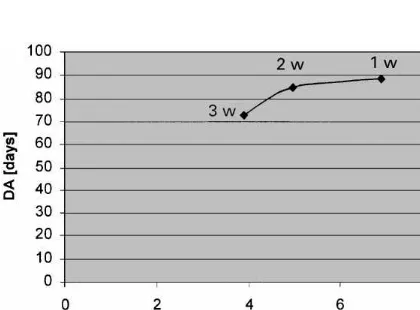
Table 5 shows the external time performance, measured by DA, and the internal ones, represent-ed by the average lead time LT and SA gainrepresent-ed in the simulated system, when a delivery date is set at the 168th day from the beginning of the campaign. Moving from a 3 to a 1 week planning period, the delivery anticipation is improved by 22%, lead time is reduced by 44%, while the anticipation of satura-tion is shortened by 1.5%.
The ratio SA/LT summarises in a single
indi-cator the e!ects of the planning period length on
Table 5
Internal and external time performance measures
Time performance measures 3 week prod. planning period
2 week prod. planning period
1 week prod. planning period
Delivery Anticipation (DA) (days) 72.69 84.78 88.61
Anticipation of Saturation (SA) (days) 106.26 110.19 104.69
Lead Time (LT) (days) 27.08 22.13 15.19
DA/LT 2.68 3.83 5.83
SA/LT 3.92 4.98 6.89
Fig. 10. Relation between the internal time performance mea-sured by the ratio SA/LT and the external one meamea-sured by the average delivery anticipation DA.
anticipation depends on the planner's ability to
lead the system to saturation as soon as possible, so that products are introduced into the system and processed early. With the same anticipation of satu-ration, however, products exit from the system as fast as their lead time is shortened.
7. Time performance of the network and cash6ows
A system that provides a quick response to
cus-tomers'needs can not only attract more clients and
encourage brand loyalty, increasing its market share, but also win a price premium for the speed and punctuality of its deliveries.
A client that is very sensitive to time perfor-mance, in fact, might be inclined to pay a price that is a nondecreasing function of the delivery
anticipa-Fig. 11. Price behaviour as a function of delivery anticipation. tion with which products are provided. On the other hand, the same client could reasonably cline paying the full price if products are not de-livered on time (see Fig. 11). The following
behaviour of the unit pricepcan be considered:
p6(1#m
a is the delivery anticipation of the unit;
a
.!9 the greatest value of anticipation recognisableby clients for a price premium;
a
.*/ the (negative) anticipation for which productshave still a market value;
p6 the full price set for products delivered on the
promised date;
m
1 the relative increase in the full pricep6 for an
anticipation equal toa
.!9;
m
2 the relative decrease in the full pricep6 for an
anticipation equal toa
Fig. 12. Cash in#ows for a planning period of 3, 2 and 1 week's length.
Fig. 13. Set-up costs for a 3, 2 and 1 week planning period length.
Cash in#ows gained by applying the above price
relation to products managed with a planning peri-od of 3, 2 and 1 week are shown in Fig. 12, setting
p6"35000 Italian Lire (18 Euro), a
.!9"72 days,
a
.*/"120 days,m1"0.2,m2"0.5.
Shortening the planning period length leads to
increased cash in#ows, but a growth in cash
out-#ows has also to be considered. This results from
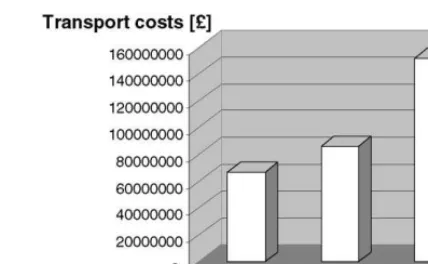
more numerous set-ups and transports inside the network due to the greater number of jobs gener-ated; Figs. 13 and 14 show their behaviour based on data from the Benetton system.
As the external time improvement gained by modifying the production planning period can
in-crease both cash in#ows and out#ows, its entity
must be established so that advantages can be maximised. Curves describing the behaviour of
in-#ows and out#ows as a function of external time
performance have to be plotted, so that the
Fig. 14. Transport costs for a 3, 2 and 1 week planning period length.
Fig. 15. Relative increase in returns (*R) and costs (*C) when moving from a 3 to a 2 and 1 week planning period.
network could choose the service level which best realises a compromise between customer
satisfac-tion and pro"t.
For the analysed network, the relative increase in
returns*Rand costs*Cby moving from an initial
3 week period to 2 and 1 week is shown in Fig. 15, where the advantages of reducing the planning pe-riod length are evident. Fig. 16 represents the
in-crease in income*Iassociated with a 2 and 1 week
reduction and the associated improvement in
deliv-ery anticipation*DA. The ratio*I/*DA describes
the increase in income (relative to the initial condi-tion) which can be gained for each unit improve-ment in the external time performance appreciable by clients; it is graphically represented by the
Fig. 16. Relative income increase when moving from a 3 to a 2 and 1 week planning period.
reduction in the production planning period. Thus, for the analysed network and the given data, the ratio is more favourable for a movement from a 3 to a 2 week planning period rather than a more dras-tic change.
8. Conclusions
Simulations show how even from a systemic as
well as from a single"rm point of view, achieving
a favourable internal time performance is a means of gaining an external time performance, recognis-able by customers.
The production planning process was found to be an important area of improvement for a network in a time-based logic; shortening the production
planning period, in fact, signi"cantly a!ects the
weighted average delivery anticipation. It leads, however, to increase set-up and transportation costs due to the greater number of jobs generated during a campaign.
The path of the network towards time-based competition consequently appears traditional, where an improved customer service level, mea-sured by DA, is accompanied by higher costs (see
Fig. 17): the network is moved from point A to
pointBalong its costs}service curve.
A new capability for managing the costs}
perfor-mance trade-o! could be reached by shifting the
competition towards more advanced frontiers than
Fig. 17. Traditional and innovative path of the network to-wards time-based competition.
its competitors' curves. In this way the network
would be moved from pointAto pointCthrough
an innovative path, where the advantage of better delivery anticipation is gained without increasing costs.
To obtain such a result, the planning period compression must be matched with system process reengineering: actions which are able to modify the technological means and managerial techniques of each"rm in the network have to be undertaken so that the whole system becomes intrinsically faster as the time-based competition philosophy suggests. For example, if a reduction in set-up time were gained at each step in the chain, a greater number of jobs during a single campaign would not lead to higher costs. The behaviour described in Figs. 15 and 16 could be changed in favour of a more drastic contraction of the planning period length, so that
the customer's sensitiveness to external time
perfor-mance could be fully exploited.
Thus, while the production planning process is shown to be an important area for improvement in
a time-based logic, its results can be ampli"ed by
involving the other processes performed in the net-work.
References
of Operations and Production Management 11 (3) (1991) 77}85.
[2] G. Stalk Jr., T.H. Hout, Competing Against Time: How Time-Based Competition Is Reshaping Global Markets, The Free Press, New York, 1990.
[3] J.D. Blackburn, Time-Based Competition. The Next Battle Ground in American Manufacturing, Business One Irwin, Homewood, IL, 1991.
[4] A. De Toni, A. Meneghetti, Traditional and innovative paths towards time-based competition, Technical Report of DIEGM, University of Udine (1999), International Journal of Production Economics, submitted for publication. [5] R.J. Tersine, E.A. Hummingbird, Lead-time reduction: The search for competitive advantage, International Jour-nal of Operations and Production Management 15 (2) (1995) 8}18.
[6] K.B Clark, T. Fujimoto, Product Development Perfor-mance. Strategy, Organization and Management in the World Auto Industry, HBS Press, Boston, 1991. [7] P.R. Nayak, Planning speeds technological development,
Planning Review 18 (6) (1990) 14}19.
[8] M.A. Youssef, Design for manufacturability and time-to-market. Part 1: Theoretical foundations, International Journal of Operations and Production Management 14 (12) (1994) 6}21.
[9] R. McKenna, Real time marketing, Harvard Business Re-view, July}August (1995) 87}95.
[10] A. Ward, J.K. Liker, J.J. Cristiano, D.K. Sobek, The sec-ond Toyota paradox: How delaying decisions can make better cars faster, Sloan Management Review (1995) 43}61. [11] D.N. Burt, Managing suppliers up to speed, Harvard
Business Review, July}August (1989) 127}135.
[12] R.A. Inman, Time-based competition: Challenges for in-dustrial purchasing, Inin-dustrial Management 34 (2) (1992) 31}32.
[13] R.J. Schonberger, World Class Manufacturing: The Lessons of Simplicity Applied, The Free Press, New York, 1986.
[14] R.W. Schmenner, The merit of making things fast, Sloan Management Review (1988) 11}17.
[15] R.W. Hall, Catching up with the times, Business Horizons 35 (4) (1992) 6}14.
[16] R.R. Gehani, Time-based management of technology. A taxonomic integration of tactical and strategic roles, International Journal of Operations and Production Man-agement 15 (2) (1995) 19}35.
[17] A. Kumar, J. Motwani, A methodology for assessing time-based competitive advantage of manufacturing"rms,
International Journal of Operations and Production Management 15 (2) (1995) 36}53.
[18] R. Millen, Time-based logistics, in: J.D. Blackburn (Ed.), Time-Based Competition. The Next Battle Ground in American Manufacturing, Business One Irwin, Home-wood, IL, 1991, pp. 211}225.
[19] P.J. Daugherty, P.H. Pittman, Utilization of time-based strategies. Creating distribution#exibility/responsiveness, International Journal of Operations and Production Management 15 (2) (1995) 54}60.
[20] M.J. Piore, C.F. Sabel, in: The Second Industrial Divide: Possibilities for Prosperity, Basic Books, New York, 1984. [21] R. Miles, C. Snow, Organization: New concepts for new
forms, California Management Review 3 (1986). [22] J. Jarrillo, On strategic networks, Strategic Management
Journal 9 (1988) 31}41.
[23] S. Ghoshal, C.A. Bartlett, The multinational corpora-tion as an inter-organizacorpora-tional network, in: S. Ghoshal, D.E. Whestney (Eds.), Organization Theory and The Multinational Corporation, St. Martin Press, New York, 1993.
[24] J.B. Quinn, in: The Intelligent Enterprise. A Knowledge and Service Based Paradigm for Industry, The Free Press, New York, 1992.
[25] G. Lorenzoni, C. Baden Fuller, Creating a strategic center to manage a web of partners, California Management Review 3 (1995) 146}163.
[26] U.S. Karmarkar, S. Kekre, S. Kekre, S. Freeman, Lot-sizing and lead-time performance in a manufacturing cell, Interface 15 (1985) 1}9.
[27] U.S. Karmarkar, Lot sizes, Lead times and in-process inventories, Management Science 33 (3) (1987) 409}418. [28] E.L. Lawler, J.K. Lenstra, A.H.G. Rinnooy Kan,
D.B. Shmoys, Sequencing and scheduling: Algorithms and complexity, in: S.C. Graves, A.H.G. Rinnooy Kan, P.H. Zipkin (Eds.), Handbooks in Operations Research and Management Science, Vol. 4, North-Holland, Amsterdam, 1993, pp. 445}522.
[29] C.H. Papadimitriou, K. Steiglitz, Combinatorial Optim-ization } Algorithms and Complexity, Prentice-Hall, Englewood Cli!s, NJ, 1982.
[30] T.E. Volman, W.L. Berry, D.C. Whybark, Manufacturing Planning and Control Systems, Business One Irwin, Homewood, IL, 1992.