THE IMPACT OF CORPORATE GOVERNANCE ON EARNINGS
MANAGEMENT: EVIDENCE FROM MALAYSIA
SKRIPSI
Submitted As Partial Fulfillment Of Requirement For The Degree of Sarjana
Ekonomi (SE) at the Sebelas Maret University
By:
MUHAMMAD ANDI D.H.B.A
F0308067
FACULTY OF ECONOMICS
SEBELAS MARET UNIVERSITY
SURAKARTA
MOTTO
· “May the Force be with you” (Star Wars)
· “When you do something for the right reasons, nothing can stop you”
(We Bought A Zoo)
· “Hope for the best, plan for the worst” (The Bourne Ultimatum)
· “Life is made from the choices that we make” (Back To The Future)
· “You have to do the best with what God give you” (Forrest Gump)
· “Happiness only real when shared” (Into The Wild)
· “Money is not the prime asset in life, time is” (Wall Street: Money
Never Sleeps)
· “Yesterday is history, tomorrow is mystery, today is a gift” (Kung Fu
Panda)
DEDICATION
This skripsi and whatsoever success
that I could achieve is dedicated to
MY LOVED FAMILY
There is no kindness love like your truly love
Thanks for all the support and pray all the time.
ACKNOWLEDGEMENT
Assalamu’alaikum Wr. Wb.
Researcher will be grateful to Allah SWT for all the mercy and bless so
that I were able to finish this research well. This Skripsi is proposed to complete
all the requirements of achieves the degree of Sarjana Ekonomi of Accounting
Department, Sebelas Maret University, Surakarta.
Researcher realizes that he could not have finished this skripsi without the
supports and involvement of many parties both directly and indirectly. I owe a
very great debt and thanks to:
1. Dr. Wisnu Untoro, M.S., as the Dean of Economics Department, Sebelas
Maret University, Surakarta.
2. Drs. Santoso Tri Hananto M.Si., Ak., as the Head of Accounting Department,
Sebelas Maret University, Surakarta.
3. Drs. Muh Agung Prabowo, M.Si., Ph.D, Ak., as my supervisor. I wish to
express my deepest thanks to Mr. Agung for his considerable help to give
advices and a very closely improved result.
4. Prof. Dr. Rachmawati, M.Si., Ak., as my academic advisor, thanks for all
your support and advices.
5. My mother, my father, and all my sister. Ibu, all this perspiration is dedicated
to you, the smartest, most beautiful and wisest woman i have ever known.
Bapak, Karina, Sebrina and Dina thank you for the support in this great
6. All lectures and staff in Faculty of Economics, Sebelas Maret University who
have provided knowledge, guidance, and service.
7. My trusted friend Dion Librazky, thanks for your support all the time.
8. My friends Raras and Isnaeni thanks for all your support and valuable advice.
9. My partner in crime, Rahmah Fitriani, finally we finished this study!
10. All of my friends in Accounting Department, I am happy to have you all in
the last four years. I wish that graduation is not the end of our friendship.
11. All of my friends in HMJ Akuntansi, keep on fire guys!
12. Member of GB who have gave happiness and pleasure. Andhika, Miko,
Adrian, Krisnandi, Eja, Nanda, Alfin, Adhi Kur, Peka, Deddy, Rofi and Adhi
Kur.
13. All my friends in KOMPAK Community. Thank you so much for the
friendship in all four years. All Hail Kantin!
14. All of my friends in United Indonesia Chapter Solo.
15. All of my friends in Standup Comedy Solo.
16. My first love,Sukma Rani, thank you for teaching me love. You are the apple
of my eye.
17. For all people that Researcher could not mention one by one, thanks for all
Researcher realizes that this research is far from being perfect. This study
has a lot of constraint, thus any suggestions and critics are expected for the sake of
improving this study.
As I close this acknowledgment, I expect that this writing will be useful to
all parties.
Wassalammu’alaikum Wr. Wb
Surakarta, June , 2012
TABLE OF CONTENTS
Page
PAGE OF TITLE ... i
ABSTRACT... ii
PAGE OF ADVISOR’S APPROVAL... ... iii
PAGE OF APPROVAL ... iv
PAGE OF MOTTO ... v
PAGE OF DEDICATION ... vi
ACKNOWLEDGEMENT ... vii
TABLE OF CONTENT ... x
LIST OF TABLES ... xiii
LIST OF APPENDIXES ... xiv
CHAPTER 1 INTRODUCTION ... 1
A. Background... 1
B. Problem Statements ... 4
C. Research Objectives ... 4
D. Research Benefits ... 5
E. Organization of Literature... 6
CHAPTER II THEORETICAL FRAMEWORK ... 7
A. Agency Theory ... 7
B. Corporate Governance ... 8
D. Hypothesis Development ... 11
1. Chairman Characteristics ... 11
2. Board Structures ... 12
3. Independent Committees ... 14
4. Family Control ... 16
CHAPTER II RESEARCH METHODS ... 18
A. Research Design... 18
B. Population and Sample ... 18
C. Source and Data Collecting Technique ... 19
D. Operational Definition and Measurement of Variables ... 20
1. Independent Variables... 20
2. Dependent Variable ... 21
3. Control Variables... 23
E. Data Analysis Methods ... 23
1. Classic Assumption Test ... 24
2. Descriptive Statistics and Univariate... 25
3. Multivariate ... 26
CHAPTER IV DATA ANALYSIS... 28
A. Total Data Collection ... 28
B. Classic Assumption Analysis ... 28
C. Descriptive Statistics and Univariate ... 29
1. The Impact of Corporate Governance on
Earnings Management... 33
2. The Interaction of Corporate Governance on Earnings Management... 42
CHAPTER V CONCLUSION... 46
A. Conclusion ... 46
B. Research Constraints ... 48
C. Research Suggestions ... 48
REFERENCES ... 49
LIST OF TABLES
TABLE PAGE
IV.1 Sample Selection ... 28
IV.2 Variable Definition ... 29
IV.3 Descriptive Statistics... ... 30
IV.4 Pearson Correlation ... 32
IV.5 Linear Regression (A) ... 34
IV.6 Linear Regression (B) ... 41
IV.7 Regression with Interaction Effect (A) ... 43
LIST OF APPENDIXES
Appendix I Previous Studies
Appendix II List of Companies
Appendix III Corporate Governance and Discretionary Accrual
Appendix IV Descriptive Statistics
Appendix V Pearson Correlation
Appendix VI Classic Assumption Test
ABSTRACT
THE IMPACT OF CORPORATE GOVERNANCE ON EARNINGS
MANAGEMENT: EVIDENCE FROM MALAYSIA
Muhammad Andi D.H.B.A NIM F0308067
The objective in this research is to investigate the impact of corporate governance mechanisms on the earnings management in Malaysia. Specifically, this research examines the effect of chairman characteristics, board structure, independent committees, and family control on earnings management.
This research focuses on manufacture companies that listed in Bursa Malaysia Berhad for period 2010. The research data were collected from financial statements and annual reports which published by companies. Purposive sampling method was used to determine research sample and 200 samples were collected. Hypothesis was tested by Ordinary Least Square (OLS) regression model using SPSS 17.00 software
The results of this research show that corporate governance mechanism simultaneously effect on the earnings management. Only chairman financial background and size of board that partially and significantly had effect on earnings management. Additionally,the interaction between corporate governance variables and earnings management had insignificant effect.
CHAPTER I
INTRODUCTION
A. Background
Agency relationship is a contract under which one or more persons to
engage another person to perform some service on their behalf which involves
delegating some decision making authority to the agent (Jensen and Meckling,
1976). In the context of the firm, the agent (manager) acts on behalf of the
principal (shareholder). They also claim that separation of authority between the
owner-manage and outside shareholders could cause conflict of interest as
managers tendency to appropriate perquisites out of the firm’s resources for own
consumption. The agency relationship will lead to information asymmetry
problems. Information asymmetry between management (agent) and shareholder
(principal) could cause managers to use it in preparing and reporting financial
statements for their advantage. Richardson (1998) found that information
asymmetry increase the level of earnings management.
Earnings management will reduce the quality of reported earnings and also
reducing investor confidence in the financial reports. Earnings management occur
in some corporate scandals of financial reporting, such as Enron, Global
Crossings, Tyco, WorldCom, and others (Cornett et al., 2006). Because of that
financial scandals, corporate governance now has already used by many entity in
the bussiness world. The implementation of corporate governance mechanism
quality of reported earnings. Effective monitoring from internal corporate
governance is very important to ensure reliable and complete financial report.
According to the statement by Bhattacharyay (2004), there are still a lot of
problems associated with Asian countries in strengthening corporate governance.
He claimed several main problems, such as:
1. Excessive government intervention.
2. Highly concentrated ownership structure.
3. Weak external discipline in the corporate sector.
4. Weak legal systems and regulatory
5. Lack of quality information.
6. Lack of investor’s protection
7. Lack of developed capital market
Those conditions and problems make the importance of coporate governance
mechanisme in Malaysia have possibly similar impact compared to other
countries in Asia.
Corporate governance has become an important issue in Malaysia since
the emergence of the Asia financial crisis in mid-1997. In order to improve the
monitoring function of corporate governance mechanisms in Malaysia, the Code
of Corporate Governance was drafted in1999 and subsequently approved in 2000
by the Ministry of Finance (Saleh et al., 2005). The Code made full effect to
company requirement where public listed companies in Malaysia are now
required to put in their annual report the statement of corporate governance,
of audit committee, and any additional statements by the board of directors
(Hashim et al., 2000). Nowadays, Malaysia’s progress in strengthening its
corporate governance framework has received international recognition. Malaysia
has consistently been ranked 4th for investor protection in the World Bank Doing
Business Report during 2006–2010 (Malaysia Corporate Governance Blue Print
2011).
Previous studies in several country including in Malaysia has investigated
the relationship between different corporate governance factors and earnings
management and the results show many different evidence impacts (can be found
in Appendix 1). The result could be different in Malaysia because each country
has different regulation and culture on corporate govenance mechanism. It’s
supported with statement by Abdullah (1992) that Malaysia has various cultures
which play a significant role in determining the culture of an organization.
Although previous studies have made attempts to reveal factors of corporate
governance that affecting earnings management, there is limited empirical
evidence that connecting family control and independent committees in company
with earnings management. Therefore, the impact of corporate governance
mechanism in Malaysia still be an empirical question.
Hence, the primary aim of this study is expected could give explanation
and emprical evidence about effectiveness corporate governance in constraining
earnings management. This study also investigate the effects of eleven
explanatory variables which consists of chairman tenure, chairman financial
board meeting, remuneration committee independence, nomination committee
independence, audit committee independence, family involvement, and family
ownership on earnings management.
B. Problem Statements
The problem statements in this study consist of:
1. Do chairman characteristics (chairman tenure, chairman financial
background and executive chairman) have impacts to earnings management?
2. Do board structures (independent board, size of board and board meeting)
have impacts to earnings management?
3. Do independent committees (remuneration committee independence, audit
committee independence, and nomination committee independence) have
impacts to earnings management?
4. Does family control (family involvement and family ownership) have
impacts to earnings management?
C. Research Objectives
Main objective in this study is to find empirical evidence about:
1. The impact of chairman tenure related to earnings management in
Malaysia companies.
2. The impact of chairman financial background related to earnings
management in Malaysia companies.
3. The impact of executive chairman related to earnings management in
4. The impact of proportion of independent board related to earnings
management in Malaysia companies.
5. The impact of board meeting related to earnings management in Malaysia
companies.
6. The impact of remuneration committee independence related to earnings
management in Malaysia companies.
7. The impact of nomination committee independence related to earnings
management in Malaysia companies.
8. The impact of audit committee independence related to earnings
management in Malaysia companies.
9. The impact of family involvement related to earnings management in
Malaysian companies.
10.The impact of family ownership related to earnings management in
Malaysia companies.
D. Research Benefits
This study is expected to give considerable benefits to:
1. Investors, creditor, and stakeholder, this papers could enhance them to
understand corporate governance mechanism in Malaysia, so that they can
make a good quality assessment of certain companies before making an
investing decision.
2. Development of literature about the impact of corporate governance on
earnings management in Malaysia. This study is expected could explain
proxies; chairman characteristics which proxies as chairman tenure,
chairman financial background and executive chairman, board of directors
which proxies as independent board, size of board and board meetings,
adding committee monitoring which proxies as independent remuneration
committee, independent audit committee and independent nomination
committee, family control which proxies as family involvement and family
ownership.
E. Organization of Skripsi
Chapter I : Introduction
This chapter contains introduction, problem statement, research
objectives, research benefits and organization of skripsi.
Chapter II : Theoretical Framework
This chapter contains literature review which leads the way to
hypotheses development and research model.
Chapter III : Research Method
Population, sample, measurements of variables and data
analysis method are discussed.
Chapter IV : Data Analysis and Interpretation
The comprehensive interpretation of result in descriptive
statistics and regression analysis are the body of this chapter.
Chapter V : Conclusion
This closing chapter presents the research result in broad
outline. It also discloses research constrains and future research
CHAPTER II
THEORETICAL FRAMEWORK
A. Agency Theory
Perspective of an agency theory is the basis that has been used widely in
understanding organization. Agency theory explains the relationship between the
company’s executives as an agent with the shareholder or owners as a principal.
Jensen and Meckling (1976) define agency relationship as a contract under which
one or more persons (the principal) engage another person (the agent) to perform
some service on their behalf which involves delegating some decision making
authority to the agent. They also explain that agency relationship between
ownership and control leads to a divergence between manager and owner interest.
A corporation's managers may have personal goals that compete with the owner's
goal in company. Since the shareholders authorize managers to manage the firm's
assets, a potential conflict of interest will exist between these two groups.
Agency theory is concerned with resolving two problems that can occur in
agency relationship (Eisenhardt, 1989). The first problem is the principal cannot
verify that the agent has behaved appropriately and the second problem is that
principal and agent may prefer different actions because of different risks.
Another negative impact which caused by an agency relationship could lead to
information asymmetry problems. Information asymmetry occurs when some
parties in business transactions have an information advantage over others (Scott,
(principal) could cause managers to use it in preparing and reporting financial
statements for their advantage.
B. Corporate Governance
Nowadays, corporate governance has already used by many entity in the
bussiness world. Garcia et al. (2010) think that fact is caused due to two reasons
which are change in the way of companies because of globalization, competition,
new technologies and social and environmental concern and, secondly, as a result
of financial scandals in several companies. Corporate scandals such as Enron,
Global Crossings, Tyco, and WorldCom had a terrible effect on stakeholders.
Most of the financial scandal has happened because of a lack of implementation
of corporate governance by companies.
According to statement of World Bank (2005), corporate governance
refers to the structures and processes for the direction and control of companies.
Corporate governance concerns the relationships among the management, board
of directors, controlling shareholders, minority shareholders and other
stakeholders. The agency problems between owner and management can be
handled by corporate governance mechanism. Corporate governance is one of the
most efficient way in order to reduce occurrence of conflicts of interest and ensure
achievement of company objectives required existence of regulations and control
mechanisms that effectively directs the company operations and the ability to
identify the parties who have different interests.
Effective monitoring from internal corporate governance is very important
misleads users of financial statements by providing them with false information
about firm’s true operating performance, the internal corporate governance serves
a monitoring role in constraining the occurence of earnings management (Chen et
al, 2006). The implementation of corporate gorvernance mechanism in company
could protect investor and creditor from management opportunistic behavior.
C. Earnings Management
Scott (1997) defines earnings management as a management action by
selecting the accounting policy of a certain standard for the purpose of
maximizing their welfare and or the company's market value. He also defines four
different pattern of earnings management, there are:
1. Taking a Bath
This is the pattern of earnings management which done by increasing
company profits become very high or very low.
2. Income Minimization
This pattern is similar to taking a bath, but less extreme. Income
minimization make company profit become lower.
3. Income Maximization
This pattern is done by making company profit become higher.
4. Income Smoothing
This pattern is done by raising or lowering company profits in financial
Healy and Wahlen (1999) define earnings management into several
aspects. First, earnings management interventions over financial reporting can be
done with the use of judgment, for example judgment in estimating the number of
economic events in the future to shown in financial statements, such as the
estimated economic life and residual value of fixed assets, deferred taxes,
receivables losses and the decline in asset values. Second, the purpose of earnings
management is to mislead stakeholders about the economic performance of
companies. This occurs when management has access to information that cannot
be accessed by outsiders. More specifically, Healy and Wahlen argue that
earnings management is an activity where managers use their discretion to
mislead stakeholders about economic performance of the company.
Ortega and Grant (2003) said that earnings management is possible
because of the flexibility in financial reporting in order to transform the operations
of a company's financial results. Earnings management will reduce the quality of
reported earnings and also reducing investor confidence in the financial reports. In
other words, earnings management is manipulating the earning to achieve a
predetermined target set by the management. Earnings management can be
measured by using discretionary accrual proxy inside the management agreement,
where the management can interferee the process of making financial statements.
The higher the value of discretionary accruals, the greater earnings is manipulated
D. Hypotheses Development
1. Chairman Characteristics
The role of the chairman is important to securing good corporate
governance in company. Jensen (1993) defines the function of the chairman
of the board as to run the board meetings, oversee the process of hiring,
firing, evaluating and compensating the CEO. Chairman knowledge and
experience are the significant elements in making sure the effectiveness of
board monitoring function.
The tenure of the company chairman may have an impact on corporate
fraud (Beasley, 1996). Firms that have chairman with shorter tenures are
associated with higher incidences of fraud (Chen et al., 2006). They also
explain that short tenure may imply the chairman lacks experience in the firm
and so detecting fraud is more difficult. Hazarika et al. (2009) find that
chairman tenure has negative influence related to earnings management. It
means the longer chairman tenure in the company, the better the performance
of the firm that could reduce earnings management.
The accounting and financial knowledge are beneficial for a chairman
to understand better financial statements and financial reporting issues in
company. Study recognized that chairman who has financial background are
useful in monitoring management. Isidro and Goncalves (2011) found that
earnings management is more likely to occur in firms that are run by a
Agency theory suggests separation of duties may lead to efficient
monitoring over the board process (Fama and Jensen, 1983). The involvement
of a chairman on board, either as director or chairman may create bias and
inappropriately influence board decisions. Similarly, conflicts of interest may
occur if a chairman is also an executive who is involved in the company
management (Ismail et al., 2010). In such a firm, the executive chairman has
more power over the board and firm without being supervised and evaluated.
Jensen (1993) claimed that boards are less effective when the chief executive
officer is also the chairman. Thus the following hypothesis is developed:
H1a : Chairman tenure is significantly related to the earnings
management.
H1b : Chairman financial background is significantly related to the
earnings management.
H1c : Executive chairman is significantly related to the earnings
management.
2. Board Structures
In general, the board of directors commissioned and given the
responsibility for supervising the quality of the information contained in
financial statements. Board of directors is the highest level of the control
mechanisms in the organization since they possess the ultimate power to
compensate the decisions that are made through the top management (Fama
Agency theory believe that board comprising majority of outside
directors reduce agency conflicts as they provide effective monitoring tool to
the board (Fama and Jensen, 1983). The Malaysian Code of Corporate
governance states that good corporate governance rests firmly with board of
directors and the Code required one third of the board to comprise of
independent directors in order to bring an independent judgment on the
decision process. The outside directors are expert managers from other large
organizations and with its expertise, independence, objectivity and legal
power,outside directors become potentially powerful governance mechanisms
to mitigate agency costs and protect shareholders wealth (Li, 1994).
Empirical evidence from previous studies generally supports the expectation
that board independence reduces earnings management and fraud accounting
(Beasley, 1996 and Klein, 2002).
Board size is the number of directors on the board and an important
factor in the effectiveness of the board in monitoring management. From
agency perspective, larger board support effective monitoring management
and protect shareholder’s interest. Previous studies that examine the
monitoring effect between board size and earnings management found larger
boards are more effective. Beasley (1996) shows an increasing relationship
between fraudulent information on financial reports and board size. Further,
Abdul Rahman and Ali (2006) find a significant positive relationship between
Habbash (2010) argues that directors on boards that meet frequently
are more likely to discharge their duties in to monitoring issues such as
earnings management, conflicts of interest and monitoring management.
Conversely, boards that rarely meet may have no time to find out about such
complex issues and may perhaps have time only to rubber- stamp
management plans. Xie et al. (2003) claimed that a board that meets rarely
may only have time for signing-off management plans and listening to
presentations and they may not have time to focus on issues such as earnings
management. They also find that earnings management is significantly
negatively related to the number of board meetings. Thus the following
hypothesis is developed:
H2a : The proportion of independent board is significantly related to
the earnings management.
H2b : The total number directors on the board is significantly related
to the earnings management.
H2c : The total board meetings is significantly related to the earnings
management.
3. Independent Committees
Nominating committee (composed from inside the membership of the
firm) suggests nominations and substitutions candidates for office in order to
improve managers and administrator’s selection process and corporate
nomination committee is important for board board effectiveness and
monitoring ability because it takes away the CEO’s power in nominating new
member to the board (Chtourou et al., 2001). Klein (2002), find that there is a
negative association between board independence and whether the CEO sits
on the nomination committee.
Vance (1983) claimed that the remuneration committee plays a
significant role in the board composition. From agency theory perspective,
the remuneration committee is a governance tool of control by the owners
(principals) over top management (the agents) that is expected to set a
compensation package that protects the interest of the shareholders, and to
monitor management. Petra and Dorara (2008) argue that independent
directors of remuneration committees are better able to accomplish their
duties objectively. Furthermore, Dahya and McConnell (2007) also found
that more outside directors sitting on committees leads to better performance
as a result of independence.
The audit committee is charged with the responsibility of overseeing
the firm’s financial reporting process (Klein, 2002). The purpose of the audit
committee is to ensure the accuracy of the financial reports (Buchalter and
Yokomoto, 2003). Audit committee is more effective if all of the members
are independent. Study by Bedard et al. (2004) investigate the impact of audit
committee characteristics including independent committee on earnings
negatively related to earnings management. Thus the following hypothesis is
developed:
H3a : Nomination committee independence is significantly related to the
earnings management.
H3b : Remuneration committee independence is significantly related to
the earnings management.
H3c : Audit committee independence is significantly related to the
earnings management.
4. Family Control
Unlike developed countries such as United Kingdom and United
States of America with dispersed ownership structure. In developing
countries partly large firms are controlled by family ownership. Asian firms
have more concentrated ownership structure where family control is common
in both small and established firms (Mak and Kusnadi, 2005). With most
large corporations owned and controlled by families and with family
members holding key managerial positions, however, the major agency
problem exists not between the management and owners in general, but
between the management (the controlling family) and minority shareholders
(Ali shah et al., 2009).
Due to controlling power in company, the dominant family is able to
influence appointments of top managers as well as board members. The
on networking and personal ties (Johannisson and Huse, 2000). Jaggi et al.
(2009) argues that controlling familes could monitor managerial behavior and
actions effectively, which caused reducing managerial opportunities to
engage in earnings management. They also gave opinion that there will be
less pressure on management to meet short term earnings expectations
because controlling families focus more on the long term. Based from
previous study by Jiraporn and DaDalt (2007) reveal that family firms are
significantly less likely to manage earnings. Thus the following hypothesis is
developed:
H4a : The family involvement on the board is significantly related to the
earnings management.
H4b : The proportion of family ownership is significantly related to the
CHAPTER III
RESEARCH METHODS
A. Research Design
This study is a hypothesis testing study and it aims to test independent
variables that have an impact to dependent variables. This study was conducted to
test and examine the effect of coporate governance mechanism to earnings
management. This is a cross sectional study, which means that the data were only
taken once (the end of 2010). Independent variables in this research consist of
chairman tenure, chairman financial background, executive chairman, board size,
proportion of independent board, board meeting, remuneration committee
independence, nomination committee independence, audit committee
independence, family involvement, and family ownership. Dependent variable is
earnings management which represented by discretionary accruals.
B. Population and Sample
Population refers to the entire group of people, events, or things of interest
that researcher wishes to investigate (Sekaran, 2000). Population of this research
is all annual reports of manufacturing companies listed in Bursa Malaysia Berhad
at the period of 2010. This country is chosen because the implementation of
Sampling is the process of selecting sufficient number of elements from the
population, means that by studying the samples and understanding of the
characteristics of the samples subjects, it would be possible to generalize the
characteristics of population elements (Sekaran, 2000). Sample methods for this
research is purposive sampling which aims to obtain the representative samples
along with researcher needs. For each company, the 2010 annual reports was
obtained from Malaysia stock exchange website. The initial samples were chosen
randomly for 200 annual reports. If the annual report does not meet those criteria
then the firm is excluded from the sample. The criteria of sample are determined
by:
1. The firm is manufacturing company which listed in Bursa Malaysia during
the period 2010.
2. The firm publishes annual report and financial statements at the end of
December 2010.
3. The firm has annual report in English or at least has the English version.
4. The firm has complete data on coporate governance and earnings
management.
C. Source and Data Collecting Technique
This study uses secondary data which means data that refers to information
that obtained from existing sources (Sekaran, 2000). The data comes from annual
1. List of manufacturing companies in 2010 is taken from Bursa Malaysia
Berhard website.
2. Company’s corporate governance data is based on annual reports
disclosures which published by the company.
3. Earnings management data is obtained from the financial statements of
companies. The data includes: comprehensive income, net cash flow from
operating activity, total assets, changes of revenues, property, plant, and
equipment (PPE), and changes in receivables.
D. Operational Definition and Measurement of Variables
This study uses the independent variables, dependent variable, and control
variables. The operational definition and measurement of the variables are
described as follows:
1. Independent Variables
Independent variables in this study is good coporate governance which
can be explained by chairman tenure, chairman financial background,
executive chairman, board size, independent board, board meeting,
remuneration committee independence, nomination committee independence,
audit committee independence, family involvement, and family ownership.
a. Chairman tenure is measured by duration of chairman tenure until year t.
b. Chairman financial background is dummy variable. If chairman has
c. Executive chairman is dummy variable. If chairman on the board is
executive= 1, otherwise = 0
d. Board size is measured by the total number of board members on the
board.
e. Propotion of independent board is measured by the proportion of
independent directors on the board, expressed as a percentage.
f. Board meeting is measured by total number of board meeting which held
annualy by the board of directors.
g. Remuneration committee independence is measured by the percentage of
remuneration committee independence to total committee.
h. Nomination committee independence is measured by the percentage of
nomination committee independence to total committee.
i. Audit committee independence is measured by the percentage of audit
committee independence to total committee.
j. Family involvement is measured using ratio family members on the
board to total number of directors.
k. Family ownership is measured by using percentage of direct shares
owned by family members on the board.
2. Dependent Variable
Dependent variable in this study is earnings management. Earnings
management is purposeful intervention in the external financial reporting
Discretionary accruals is used as representative of earnings management
calculated by using Modified Jones Model (Dechow et al. 1995).
This is a equation to calculate Total Accrual:
This is OLS regression equation to estimate Total Accrual:
Non Discretionary Accruals (NDA)can be calculated by the formula:
Discretionary Accrual (DA) can be calculated by the formula:
Explanation :
DAit = Firm’s value of discretionary accrualsin year t
NDAit = Firm’s value of non discretionary accrualsin year t
TAit = Firm’s total accruals in year t
Nit = Firm’s comprehensive income in year t
CFOit = Firm’s net cash flow from operating activity in year t
Ait-1 = Firm’s total assets in year t-1
TAC = Nit – CFOit
TAit/Ait-1 = β1 (1 / Ait-1) + β2 (ΔRevt / Ait-1) + β3 (PPEt/ Ait-1) + e
NDAit = β1 (1 / Ait-1) + β2 (ΔRevt / Ait-1 - ΔRect/ Ait-1) + β3 (PPEt / Ait-1)
ΔRevt = Firm’s change in revenues in year t-1 and t
PPEt = Firm’s value of PPE in year t
ΔRect = Firm’s change in receivables in year t-1 and t
e = error terms
3. Control Variables
Control variables in this study is explained by firm size, leverage and
type of industry.
a. Firm size is control variable which measured by nantural logarithm of
total assets.
b. Leverage is control variable which measured by ratio of total debt to total
assets.
c. Type of indsutry is dummy variables which represented by give score
(1,2,..,5) on each type of manufacturing companies.
E. Data Analysis Methods
In this study, OLS (Ordinary Least Squares) analysis regression is used to
analyze the realationship between independent variables, dependent variable, and
control variables. SPSS 17.00 for Windows is used as an analytical data tool to
test the regression model. Theoretically, the model will give the valid value if
1. Classic Assumption Test
Before testing the hypothesis, classic assumption test is important to
ensure that study results are valid. Classic assumption test consist of several
kinds of tests including normality test, multicollinearity test, autocorrelation
test, and heteroscedasticity test.
a. Normality Test
Normality test is used to determine whether the residual value in
regression model is well- modeled by a normal distribution (Ghozali, 2006).
T-test and F-test is done with underlying assumption that residual value is
normally distributed. Kolmogorov-Smirnov test is applied to test this
assumption. Criteria that operate in this test are two tailed test, comparing
value with significance level. This study use significance level 0.05. If
p-value > 0.05 then the data is normally distributed.
b. Multicollinearity Test
Multicollinearity test is used to determine whether two or more
independent variables in a multiple regression model are highly correlated
(Ghozali, 2006). Tolerance value and variance inflation factors (VIF)
could provide measurement to detect if multicollinearity exist. These
measurements can show which independent variables are explained by
other independent variables. If tolerance value < 0.05 and VIF > 5, then
c. Autocorrelation Test
Autocorrelation test is used to determine whether there is a
correlation between values of the process at different points in time, as a
function of the two times or of the time difference. If there is no
correlation between residual value, then the residual value is random
(Ghozali, 2006). This study use run test to detect autocorrelation. Criteria
that operate in this test are two tailed test, comparing p-value with
significance level. This study use significance level 0.05. If p-value > 0.05
then the residual is random.
d. Heteroscedasticity Test
Heteroscedasticity test is used to determine whether the variance of
the error terms differ across observations (Ghozali, 2006). Tests to detect
existance of heteroscedasticity is look at the graph scatterplot between the
predicted value of the dependent variable (ZPRED) and the residual
(SRESID). When the dots result is spread and random, then there is no
heteroscedasticity.
1. Descriptive Statistics and Univariate
Descriptive statistics used to find the average (mean), standard
deviation, and maximum and minimum value from variables tested in the
study. This analysis is intended to provide idea of distribution and behavior
2. Multivariate
From the hypothesis above, the research model can be explained by
this formula:
DAC = discretionary accruals
β = parameters (i = 1,2,3,...11)
CTE = chairman tenure
CFB = chairman financial background
CEX = executive chairman
BDIND = board independent
BDSZ = board size
BDM = board meeting
NOM = nomination committe independence
REM = remuneration committe independence
AUD = audit committe independence
FAM = family involvement
OWN = family ownership
AST = firm size
LEV = leverage
IND = type of industry
e = error terms
a. Significance Silmutaneous Test (F-Test)
F-Test is used to prove whether all independent variables have a
simultaneously effect on dependent variables.
DAC = β0 + β1CTE + β2CFB + β3CEX+ β4BDIND + β5BDSZ +
β6BDM + β7NOM+ β8REM + β9AUD + β10FAM + β11OWN+
b. Coeffcient of Determination (R2- Test)
Coefficient of determination is used to explain how much of the
variability of regression model can be caused or explained by its
relationship to dependent variable. Each additional independent variable
will make R2 increase.
c. Partial Regression Test (t-test)
This test is to determine whether the independent variables in the
partial will affect the dependent variable, assuming the other independent
variables constant. Criteria of test:
1. If significant value > alpha (5%, 1% , or 10%), it means an
individual independent variable had no effect on the dependent
variable.
2. If significant value < alpha (5%, 1% , or 10%), it means an
CHAPTER IV
DATA ANALYSIS
This chapter will describe about data description, data analysis, and
research result that have been performed during the study. Analytical model used
in this study is multiple linear regression using SPSS software version of 17.00
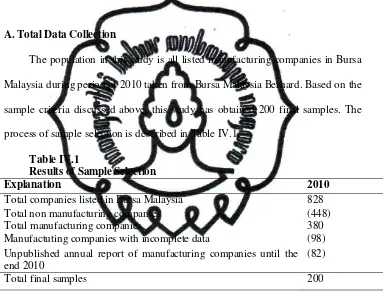
A.Total Data Collection
The population in this study is all listed manufacturing companies in Bursa
Malaysia during period of 2010 taken from Bursa Malaysia Berhard. Based on the
sample criteria discussed above, this study has obtained 200 final samples. The
process of sample selection is described in Table IV.1.
Table IV.1
Results of Sample Selection
Explanation 2010
Total companies listed in Bursa Malaysia 828
Total non manufacturing companies Total manufacturing companies
(448) 380
Manufactuting companies with incomplete data (98)
Unpublished annual report of manufacturing companies until the end 2010
(82)
Total final samples 200
Source: Bursa Malaysia Berhard (2012)
B.Classic Assumption Analysis
The result of classic assumption test in this study can be found in appendix.
The results explained that the residual data have been normally distributed and
that there is no autocorrelation and by using scatterplot graphic shows that there is
no heteroscedasticity. Therefore, the data is passed prom classic assumption test
which include normality test, multicollinearity test, autocorrelation test and
hetercocedasticity test.
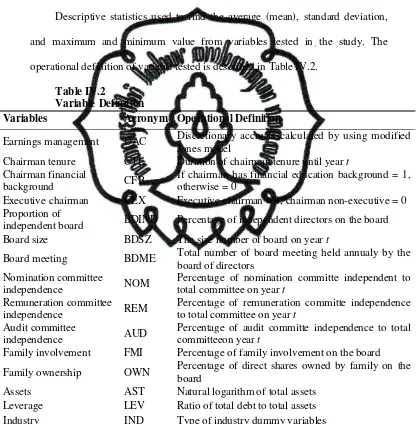
C.Descriptive Statistics and Univariate
Descriptive statistics used to find the average (mean), standard deviation,
and maximum and minimum value from variables tested in the study. The
operational definition of variable tested is described in Table IV.2.
Table IV.2
Variable Definition
Variables Acronym Operational Definition
Earnings management DAC Discretionary accruals calculated by using modified
Jones model
Chairman tenure CTE Duration of chairman tenure until year t
Chairman financial
background CFB
If chairman has financial education background = 1, otherwise = 0
Executive chairman CEX Executive chairman = 1, chairman non-executive = 0
Proportion of
independent board BDIND Percentage of independent directors on the board
Board size BDSZ The size number of board on year t
Board meeting BDME Total number of board meeting held annualy by the
board of directors Nomination committee
independence NOM
Percentage of nomination committe independent to
total committee on year t
Remuneration committee
independence REM
Percentage of remuneration committe independence
to total committee on year t
Audit committee
independence AUD
Percentage of audit committe independence to total
committeeon year t
Family involvement FMI Percentage of family involvement on the board
Family ownership OWN Percentage of direct shares owned by family on the
board
Assets AST Natural logarithm of total assets
Leverage LEV Ratio of total debt to total assets
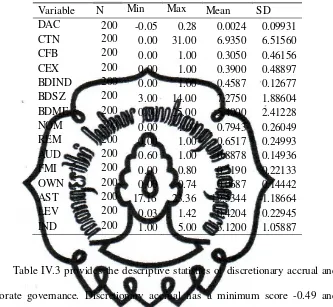
The result of descriptive statistics on manufacturing companies is described
in Table IV.3
Table IV.3
Descriptive Statistics
Variable N Min Max Mean SD
DAC 200 -0.05 0.28 0.0024 0.09931
CTN 200 0.00 31.00 6.9350 6.51560
CFB 200 0.00 1.00 0.3050 0.46156
CEX 200 0.00 1.00 0.3900 0.48897
BDIND 200 0.00 1.00 0.4587 0.12677
BDSZ 200 3.00 14.00 7.2750 1.88604
BDME 200 0.00 25.00 5.4000 2.41228
NOM 200 0.00 1.00 0.7943 0.26049
REM 200 0.00 1.00 0.6517 0.24993
AUD 200 0.60 1.00 0.8878 0.14936
FMI 200 0.00 0.80 0.2190 0.22133
OWN 200 0.00 0.74 0.0687 0.14442
AST 200 17.16 23.36 19.5344 1.18664
LEV 200 0.03 1.42 0.4204 0.22945
IND 200 1.00 5.00 3.1200 1.05887
Table IV.3 provides the descriptive statistics of discretionary accrual and
corporate governance. Discretionary accrual has a minimum score -0.49 and
maximum score 0.28 with an average score 0.0024. Negative value means the
company made earnings management by lowering profits and positive value
means the company made earnings management by raising profit. The average
tenure of chairman is 6.935 and the average of chairman financial background is
30.5%, it means that most chairman did not have education background in
finance. The average position of chairman is 39% as executive member, indicating
the number of executive chairman less than number of non-executive chairman in
The average proportion of independent board is 41% which means the
board is met with what Malaysian’s government requires. The rule states that
proportion of board members should at least contain one third independent
directors. The average size of board is 7.275 and the number of board meetings
which were held has an average score 5.4. The average scores for proportion of
nomination committee independence, remuneration committee independence, and
audit committee independence are 79%, 65%, and 88%. The number of audit
committee has met with the government rule which stated 1/3 of the members
should be independent members.The family involvement in boards has a average
score is 21.9% and the average score of family ownership is 6.87 %.
Control variables for this study are company size (AST), leverage (LEV),
and type of industry (IND). The average score of company size is 19.5344 with a
lowest score 17.16 and a highest score 23.36. Leverage has an average score
0.4204 with a lowest score 0.03 and a highest score 1.42. Type of industry (IND)
is a dummy variables with minimum value 1, maximum value 5 and an average
score 3.12.
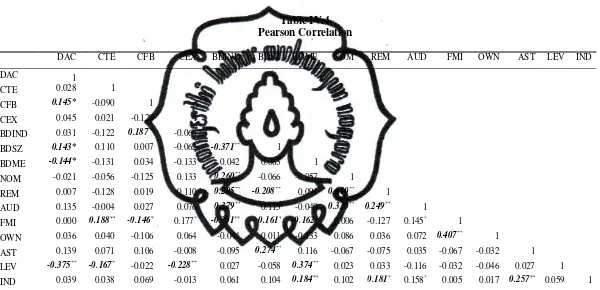
Pearson correlation test results are desribed in Table IV.4. The table shows
that coefficient between independent variables and dependent variable are
relatively low so there is no multicollinearity issues. Independent variables such
as chairman financial background (CFB), board size (BDSZ), and board meeting
Table IV.4 Pearson Correlation
DAC CTE CFB CEX BDIND BDSZ BDME NOM REM AUD FMI OWN AST LEV IND
DAC 1
CTE 0.028 1
CFB 0.145* -0.090 1
CEX 0.045 0.021 -0.129 1
BDIND 0.031 -0.122 0.187** -0.066 1
BDSZ 0.143* 0.110 0.007 -0.062 -0.371** 1
BDME -0.144* -0.131 0.034 -0.133 0.042 0.063 1
NOM -0.021 -0.056 -0.125 0.133 0.260** -0.066 -0.057 1
REM 0.007 -0.128 0.019 0.110 0.295** -0.208** 0.091 0.610** 1
AUD 0.135 -0.004 0.027 0.076 0.379** 0.115 -0.040 0.320** 0.249** 1
FMI 0.000 0.188** -0.146* 0.177* -0.201** 0.161* -0.162* 0.006 -0.127 0.145* 1
OWN 0.036 0.040 -0.106 0.064 -0.044 0.011 -0.133 0.086 0.036 0.072 0.407** 1
AST 0.139 0.071 0.106 -0.008 -0.095 0.274** 0.116 -0.067 -0.075 0.035 -0.067 -0.032 1 LEV -0.375** -0.167* -0.022 -0.228** 0.027 -0.058 0.374** 0.023 0.033 -0.116 -0.032 -0.046 0.027 1 IND 0.039 0.038 0.069 -0.013 0.061 0.104 0.184** 0.102 0.181* 0.158* 0.005 0.017 0.257** 0.059 1
variable chairman tenure (CTE), executive chairman (CEX), proportion of
independent board (BDIND), nomination committe independence (NOM),
remuneration committe independence (REM), audit committe independence
(AUD), family involvement (FMI) and family ownership (OWN) are
insignificantly correlated to earnings management In the control variables,
leverage (LEV) is significantly correlated to earnings management, while
company size (AST) and type of industry (IND) are incorrelated significantly to
earnings management.
D. Multivariate
1. The Impact of Corporate Governance on Earnings Management
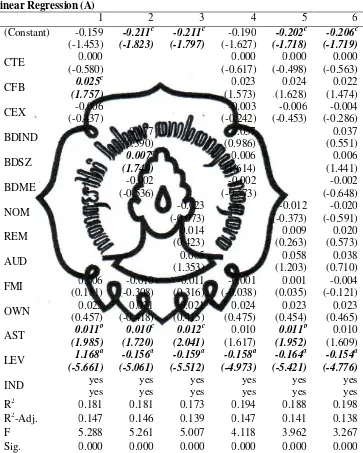
Table IV.5 show the results of the regression between corporate
governance variables and control variables on earnings management which
represented in discretionary accruals proxy. F value for each regression model
was significant. In addition, models 1 and 4 have the highest adjusted R2 is
equal to 14.7%. It means that variables on the chairman and board of directors
could explain the dependent variable (earnings management) as much as 14.7%.
The rest of 85.3% is explained by other factors.
The test results from model 1 to 6 show the chairman financial background
(CFB) and board size (BDSZ) have significant effect on earnings management at
the level 10%. Simultaneously effect of independent variables toward dependent
variable is known by comparing Sig coefficient. If Sig coefficient is less than
earnings management. The test results from all model show that all independent
variables have simultaneously effect on the earnings management (0.000<0.05).
Table IV.5
The result in all six models explain that chairman tenure (CTE) consistenly
has insignificant negative effect to earnings management. Hypothesis 1a stated
the chairman tenure is significantly related to earnings management is not
accepted. This finding is consistent with study by Cornett et al. (2007) who
found similar result that chairman tenure is insignificant, but it is different from
previous study by Hazarika et al. (2009) who found that chairman tenure is
negatively significant related to earnings management. A possible explanation
for this result because, the average score of chairman tenure in the sample is
very low (seven years only) so there is not enough influence on constraining
earnings management.
The chairman financial background (CFB) is positively significant to
earnings management at 0.10 level in model 1. Hypothesis 1b stated the
chairman financial background is significantly related to earnings management
is accepted. In contrast, from model 4, 5, and 6 show insignificant effect related
to earnings management which means the impact is inconsistent. The result is
not suported by Xie et al. (2003) who claimed that earnings management is less
likely to occur in firms that are run by a member of boards who have a corporate
and financial background. This finding is supported on study by Isidro and
Goncalves (2011) who found that chairman with management and finance
background was more prone to manage earnings. The result proves that
Malaysia companies have different chairman characteristic. Besides the benefits,
financial knowledge could have negative effect because the chairman so much
All models show that executive chairman (CEX) consistently has
insignificant negative effect to earnings management. Hypothesis 1c stated the
executive chairman is significantly related to earnings management is not
accepted.This result is consistent with other study by Ismail et al. (2010) who
found that executive chairman is insignificant related to earnings management. It
can be explained that the involvement of a chairman on executive position has
no impact on constraining earnings management and that is probably because the
families still dominate the mangement decisions in Malaysia companies. In
contrast, there is a different result from study by Gordon and Henry (2005) who
found that executive chairman is negatively and significantly related to earnings
management.
This study find that proportion of independent board (BDIND) is
consistenly has insignificant positive effect related to earnings management.
Hypothesis 2a stated the proportion of independent board is significantly related
to earnings management is not accepted. This finding is however consistent with
previous study in Malaysia by Abdul Rahman and Ali (2004) who found that
with the high presence independent directors on the board have no impact on
earnings management. They claims that the role of the board of directors in
Malaysia companies is inefficient in performing their monitoring duties due to
management dominance over board matters. The results is different with another
study by Beasley (1996) and Xie et al. (2003). Both of them find a negative
Test result from model 2 explains that board size (BDSZ) has positive
significant effect to earnings management at the 0.10 level. Hypothesis 2b stated
the board size is significantly related to earnings management is accepted. But,
from other models show insignificant effect which means the impact is
inconsistent. The result is supported by Kao and Chen (2004) in Taiwan, who
found a significant positive relationship between board size and earnings
management. A possible explanation for this because company with large board
of directors would provide a lack of coordination and communication between
the members and also proves that board characteristic in Malaysia is different
than in Taiwan.
This study found that the number of board meeting (BDME) consistenly
has insignificant negative effect to earnings management. Hypothesis 2c stated
the board meeting is significantly related to earnings management is not
accepted. This result different from previous study by Chtourou et al. (2001)
who found that meeting number is significantly positive related to earnings
management. The results is consistent with study by Habbash (2010) found that
number of meeting not restrict earning management practices. He argues that
frequent meetings not always be a characteristic of an active board of directors.
Board meetings are not necessarily functional because the limited time in
meeting restrict the important exchange of ideas among directors or with
managers (Lipton and Lorsch, 1992).
All six models explained that nomination committee independence (NOM)
Hypothesis 3a stated the nomination committee independence is significantly
related to earnings management is not accepted. The result is different by
Habbash (2010) who found negative relationship between nomination committee
independence and earnings mangement. However, this finding is consistent with
prior study by Chtourou et al. (2001) that majority of independent members on
nomination committee has insignificant effect on the level of earnings
management. Klein (2002) argues that nomination committee assignments are
influenced by board size, which means large boards have more directors to
contribute to the sub-committees and this enables the work load to be distributed
over a greater number of directors.
Remuneration committee independence (REM) consistenly has
insignificant positive effect to earnings management. Hypothesis 3b stated the
remuneration committee independence is significantly related to earnings
management is not accepted.This finding however consistent with study in
United Kingdom by Habbash (2010) that remuneration committee independence
is insignificantly positive related to earnings management. In contrast, the result
is different with previous study in USA firms by Klein (2002) who found
positive relationship between nomination committee independence and earnings
mangement. Habbash (2010) argues that even though the remuneration
committee has been introduced in many countries to carry out an essential part
of the governance required, these committees have not yet achieved the degree
Audit committee independence (AUD) consistenly has insignificant
positive effect to earnings managemen. Hypothesis 3c stated the audit committee
independence is significantly related to earnings management is not accepted.
This result confirm Klein (2002) conclusion that maintaining a whole
independent audit committee is not be necessary in constraining earnings
management. Larger audit committee which has more resources and capability
could be better than number of independent members in performing the required
duties including to prevent earnings management. However, the result is
different with study by Lin and Hwang (2010) which identifies a negatively
significant relationship between audit committee independence and earnings
management.
The result show the coefficient for family involvement (FAM) is
consistenly negative and has insignificant effect to earnings management.
Hypothesis 4a stated the family involvement is significantly related to earnings
management is not accepted.The result is not supported with prior study by Ho
and Wong (2001) who found that companies with a higher proportion of family
members on the board is more likely to have lower earnings management.
Jiraporn and DaDalt (2007) argues that family involvement has impact on
earnings management because founding families will limit the ability of
managers to manipulate earnings, and there will be less pressure on management
to manage earnings to look good in the short term since the controlling family
The study found family ownership (OWN) consistenly has insignificant
positive effect to earnings management. Hypothesis 4a stated the family
ownership is significantly related to earnings management is not accepted. The
result indicates that family board members who own shares are not effective
constraining earnings management. This results is different with study by
Hosseini (2012) who found that family ownership had significant effect to
earnings management. Earnings management is higher in countries where family
ownership concentration is higher because of weak investor protection (Leuz et
al., 2003). Based on sample studies show that only a small number of directors
who have own shares in firms which means have no influence to earnings
mangement.
Among the control variables, company size (AST) consistenly has positive
significant effect to earnings management except for model 4 and 6 where the
result show insignificant. The models show that leverage (LEV) consistenly has
negative significant effect to earnings management in all six models.
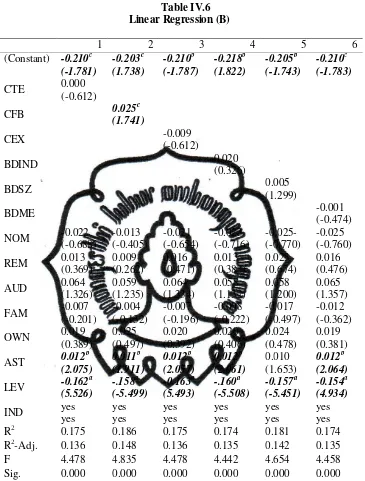
Table IV.6 show the results of the regression between each corporate
governance variables which consists of chairman and board of directors. The
result from model 2 show that only chairman financial background (CFB) has
significant effect related to earnings management which means this variable has
consistent result matching from previous table. The other variables which
consist of chairman tenure (CTE), executive chairman (CEX), proportion of
independent board (BDIND), board size (BDSZ), board meetings (BDME) is
Table IV.6
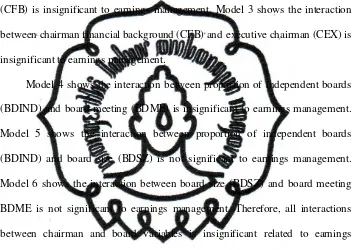
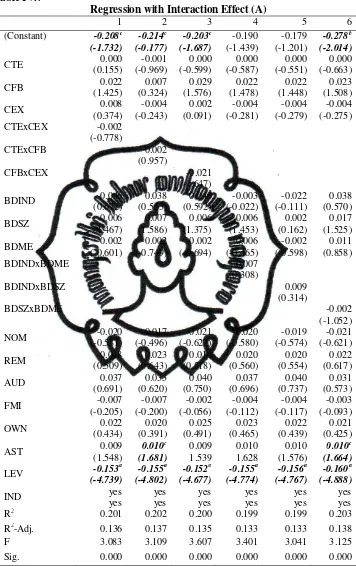
2. The Interaction of Corporate Governance on Earnings Management
Table IV.7 show the regression results with the interaction effects of
chairman variables and board of director variables. Model 1 shows the
interaction between chairman tenure (CTE) and executive chairman (CEX) and
the result is insignificant related to earnings management. Model 2 shows the
interaction between chairman tenure (CTE) and chairman financial background
(CFB) is insignificant to earnings management. Model 3 shows the interaction
between chairman financial background (CFB) and executive chairman (CEX) is
insignificant to earnings management.
Model 4 shows the interaction between proportion of independent boards
(BDIND) and board meeting (BDME) is insignificant to earnings management.
Model 5 shows the interaction between proportion of independent boards
(BDIND) and board size (BDSZ) is not significant to earnings management.
Model 6 shows the interaction between board size (BDSZ) and board meeting
BDME is not significant to earnings management. Therefore, all interactions
between chairman and board variables is insignificant related to earnings
management.
In the control variables, company size (AST) has positive significant effect
to earnings management only in model 6, the others model show insignificant
effect. The models show that leverage (LEV) consistenly has negative
Table IV.7
Regression with Interaction Effect (A)