Refer to Important disclosures in the last page of this report
Stock DataTarget price (Rp) Rp47,500
Prior TP (Rp) Rp42,000
Shareprice (Rp) Rp32,500
Upside/downside (%) +46.2
Sharesoutstanding (m) 3,730
Marketcap. (US$ m) 7,967
Astra International 59.5%
Estimate Change; Vs. Consensus 2018F 2019F PT Indo Premier Sekuritas
[email protected] +62 21 5793 1170
Robust results
Strong growth with manageable costs recorded in 9M18.
Heavy equipment division posted another strong performance.
PAMA recorded robust growth on the back of dryer weather.
Maintain BUY with 46% upside to new TP of 47,500 (prev. 42,000).
Robust growth in 3Q18.
UNTR recorded strong earnings of Rp3.6tn in 3Q18, up
22% qoq and 62% yoy, allowing 9M18 net profit to reach Rp9.1tn, jumped 61%
yoy on the back of higher revenues, margin expansion (mainly from PAMA),
manageable opex and forex gain of Rp630bn. Revenues reached Rp61.1tn in
9M18, up 32% yoy, came in above consensus (77%) and our (81%) forecast for
FY18F. Good weather had helped PAMA to record the highest OB removal volumes
of 272mn bcm (Fig. 2).
Strong heavy equipment performance.
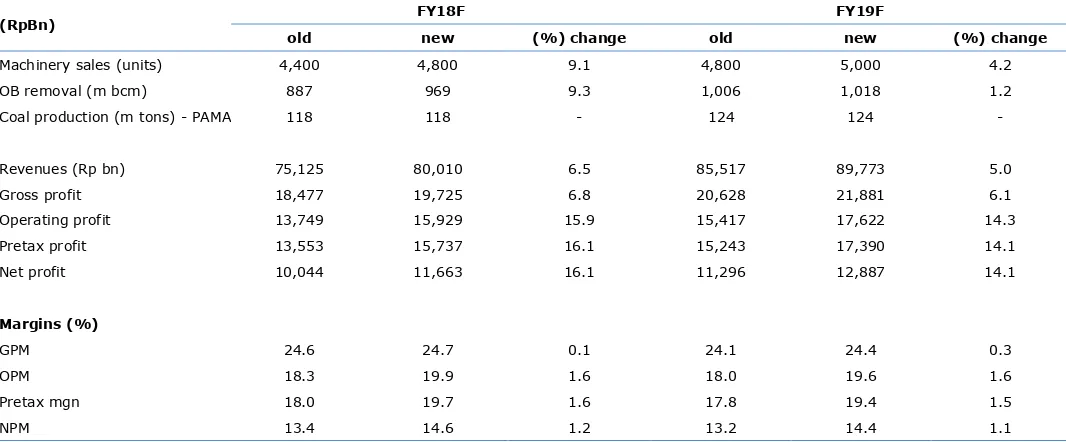
We raise our
Komatsu sales forecast to
4,800-5,000 units for FY18F-19F, respectively (from 4,400-4,800 units) as 9M18
performance came above our expectation. Heavy equipment division
recorded
strong revenues growth of 22% yoy to Rp21.3tn in 9M18 owing to strong growth
in parts and services revenues (+34% yoy) and Komatsu sales (+23%). Komatsu
sales recorded at 1,281 units in 3Q18, up 4.2% qoq and 24% yoy, bringing 9M18
Komatsu sales to 3,681 units, up 34% yoy on the back of higher demand from the
mining industry.
Mining contracting division recorded strong results.
PAMA remained the
largest revenues contributor with revenues of Rp28.9tn in 9M18, up 36% yoy
weather in 3Q18. We expect PAMA to book strong volumes in 4Q18 as we believe
rainfall to remain relatively low in the period.
Maintain Buy with 46% upside to new TP of Rp47,500.
We raise our
earnings forecast by 16% and 14% for FY18F-19F, respectively (Fig. 8), given
these better than expected set of results. Thus, we raise our target price
(DCF-Based, WACC: 13.1%, TG: 3%) to Rp47,500 (prev. Rp42,000). We also rolled
over our base valuation year to 2019, revise up USD/IDR exchange rate and risk
free rate assumptions. With 46% potential upside to our new TP, we reiterate our
Buy recommendation for UNTR.
United Tractors
(
UNTR IJ
)
Source: UNTR, IndoPremier Share Price Closing as of : 29 October 2018
2
Refer to Important disclosures on the last of this report
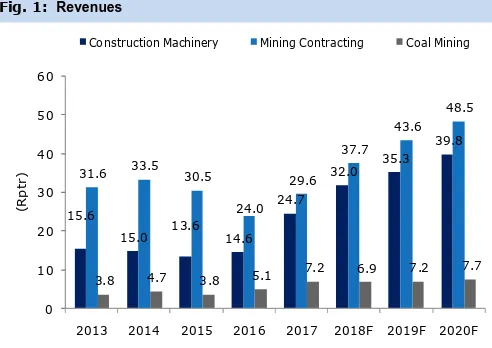
Fig. 1: Revenues Fig. 2: PAMA operational performance
Source: UNTR, IndoPremier Source: UNTR
Fig. 3: Heavy equipment sales volumes Fig. 4: Heavy equipment revenues
Source: UNTR, IndoPremier Source: UNTR, IndoPremier
Fig. 5: Mining contracting volumes Fig. 6: Coal sales volumes and ASP
Source: UNTR, IndoPremier Source: UNTR, IndoPremier
15.6
2013 2014 2015 2016 2017 2018F 2019F 2020F
(R
p
tr
)
Construction Machinery Mining Contracting Coal Mining
26.5 30.1
Coal production (LHS) OB removal (RHS)
41% 40%
2013 2014 2015 2016 2017 2018F 2019F 2020F
(t
Heavy equipment sales (industry - LHS)
UNTR's heavy equipment sales (LHS)
Market share (RHS)
2013 2014 2015 2016 2017 2018F 2019F 2020F
(R
p
t
n
)
Heavy equipm ent sales Spare part and service revenues
105 114 109 109 113 118 124 130
2013 2014 2015 2016 2017F 2018F 2019F 2020F
(
x
)
m ining volum es (m n tons - LHS) OB rem oval (m n Bcm - LHS)
UNTR clients' SR (RHS)
4.2
2013 2014 2015 2016 2017 2018F 2019F 2020F
U
3
Refer to Important disclosures on the last of this report
Fig. 7: 3Q18 results summary
(RpBn) 9M18 9M17 % Y-Y 3Q18 % Q-Q % Y-Y vs. cons. vs. ours.
Fig 8. Earnings revisions
4
Refer to Important disclosures on the last of this report
Year To 31 Dec (RpBn) 2016A 2017A 2018F 2019F 2020F
Operating Profit 6,706 10,756 15,929 17,622 19,483
Net Interest 191 142 (87) (4) 34
Cash & Equivalent 19,461 20,831 25,612 28,609 31,728
Receivable 12,115 18,188 21,284 23,882 26,598
Inventory 7,108 7,855 12,488 14,012 15,606
Other Current Assets 3,514 4,328 6,174 6,927 7,715
Total Current Assets 42,197 51,202 65,558 73,430 81,648
Fixed Assets - Net 16,685 22,251 22,491 23,701 25,261
Goodwill 0 0 0 0 0
Non Current Assets 3,804 7,699 3,810 4,275 4,762
Total Assets 63,991 82,262 93,025 102,630 112,955
ST Loans 1,028 1,916 2,012 2,112 2,218
Payable 14,119 20,239 0 26,932 29,995
Other Payables 3,208 6,221 5,601 6,284 6,999
Current Portion of LT Loans 0 0 0 0 0
Total Current Liab. 18,356 28,377 31,615 35,328 39,212
Long Term Loans 85 2,763 3,039 3,343 3,678
Other LT Liab. 2,732 3,584 4,975 5,582 6,216
Total Liabilities 21,173 34,724 39,629 44,253 49,107
Equity 12,658 12,389 11,195 11,246 11,299
Retained Earnings 28,202 32,974 40,195 44,918 50,114
Minority Interest 1,762 2,175 2,006 2,213 2,435
Total SHE + Minority Int. 42,622 47,538 53,396 58,377 63,848
Total Liabilities & Equity 63,795 82,262 93,025 102,630 112,955
5
Refer to Important disclosures on the last of this report
Year to 31 Dec 2016A 2017A 2018F 2019F 2020F
Cash Flow
Net Income (Excl.Extraordinary&Min.Int) 5,002 7,403 11,663 12,887 14,217
Depr. & Amortization 3,467 3,722 3,761 3,801 4,006
Operating Margin (%) 14.7 16.7 19.9 19.6 19.5
Pre-Tax Margin (%) 14.8 16.3 19.7 19.4 19.4
Net Margin (%) 11.0 11.5 14.6 14.4 14.2
ROA (%) 8.0 10.1 13.3 13.2 13.2
ROE (%) 12.2 16.4 23.1 23.1 23.3
ROIC (%) 13.8 18.3 23.8 23.9 24.1
Acct. Receivables TO (days) 90.3 78.0 82.0 83.7 84.0
Acct. Receivables - Other TO (days) 7.1 7.6 8.0 8.1 8.2
Inventory TO (days) 4.6 6.7 5.9 5.1 5.1
Payable TO (days) 140.0 125.2 133.9 136.9 137.1
Acct. Payables - Other TO (days) 4.9 4.9 5.1 4.6 4.6
Debt to Equity (%) 2.6 9.8 9.5 9.3 9.2
Interest Coverage Ratio (x) 0.1 0.1 0.1 0.1 0.1
Net Gearing (%) (43.0) (34.0) (38.5) (39.7) (40.5)
Head Office
PT INDO PREMIER SEKURITAS
Wisma GKBI 7/F Suite 718
Jl. Jend. Sudirman No.28
Jakarta 10210 - Indonesia
p +62.21.5793.1168
f +62.21.5793.1167
INVESTMENT RATINGS
BUY : Expected total return of 10% or more within a 12-month period HOLD : Expected total return between -10% and 10% within a 12-month period SELL : Expected total return of -10% or worse within a 12-month period
ANALYSTS CERTIFICATION.
The views expressed in this research report accurately reflect the analysts personal views about any and all of the subject securities or issuers; and no part of the research analyst's compensation was, is, or will be, directly or indirectly, related to the specific recommendations or views expressed in the report.
DISCLAIMERS