75 IJNMT, Vol. IV, No. 2 | December 2017
ISSN 2354-0082
Analyzing Factors Influencing Behavior
Intention to Use Snapchat and Instagram
Stories
Vincent Valiant Coa
1, Johan Setiawan
2Department of Information Systems Universitas Multimedia Nusantara, Tangerang, Indonesia [email protected]
Received on August 30th, 2017
Accepted on December 20th, 2017
Abstract— Snapchat, and Instagram are two social networks which recently gain their users after adopting such a feature called "Story" which allows a certain post to be disappeared after a certain time. This research takes up this technology trends analyzing the factors that probably affect the behavioral intention to use Snapchat and Instagram stories among generation Z. Factors are analyzed using Structural Equation Modeling, with basis model and variables from Technology Acceptance Model. Data collection was targeted to finished within 1 week using online questionnaire with respondent from Jakarta and Tangerang for 100 respondent that are using both Snapchat stories and Instagram Stories. There are two tools researcher usually use to analyze Structural Equation Modeling: SPSS AMOS and LISREL. In this research, researchers choose AMOS. From six hypothesis proposed for Snapchat analysis, four hypothesis is accepted, while the other two are rejected. Meanwhile, on Instagram Stories analysis, five hypothesis is accepted and one hypothesis is rejected. This study finds out the Social Presence is an exogenous variable which has a major role in affecting other variables. While Perceived Enjoyment influenced the behavioral intention to use Snapchat and Instagram Stories the most.
Index Terms—Structural Equation Modeling, Technology Acceptance Model, influence, generation Z, Snapchat, Instagram
I. INTRODUCTION
There are clear differences in behavior to use technology between each generation. Generation Z could be the generation who is exposed the most with technology, even since birth. Some researchers found that they have a preference to use ephemeral messaging to communicate with their friends and colleagues. Ephemeral messaging is a feature that allows a post or shared content will be disappeared within a certain period of time automatically. This feature is recently adopted by many social networks, including Snapchat and Instagram with their stories. Both of them successfully achieved rapid growth in the last few years.
Virtual community study is gaining the attention of many researchers lately. The use of ephemeral messaging becomes a community trend that probably interesting to be researched more. This study analyzes and proves several factors that may affect the behavior intention to use Snapchat and Instagram Stories using Structural Equation Modeling (SEM) with Technology Acceptance Model (TAM) as the base model. There are two external variables to support TAM such as Perceived Enjoyment and Social Presence. 100 people who have ever used Snapchat and Instagram Stories and resident in Jakarta or Tangerang are targeted to be the sample.
Based on the problems that render in the background, then the issues that will be discussed are:
1. How to influence Perceived usefulness against the interests of generation Z in using Instagram Stories and Snapchat?
2. How the influence of Perceived Ease of Use against the interests of generation Z in using Instagram Stories and Snapchat?
3. How are the influence of Social Presence and the Perceived Enjoyment towards interest generation Z in using Instagram Stories and Snapchat?
IJNMT, Vol. IV, No. 2 | December 2017 76
ISSN 2354-0082
II. LITERATURE REVIEW
A. Perceived Enjoyment
Perceived Enjoyment (PE) is defined as enjoyable and exploratory as a subjective psychological experience that is the context of information technology and computer-mediated environments [1]. High enjoyment can lead the adoption of a technology even though such technology does not increase any productivity. Some researchers often use PE as a variable because of entertainment, which is related to enjoyment, is an aspect that plays a pretty important role in the success of a technology acceptance. A large number of systems or technology is designed with the orientation on personal pleasure than productivity (hedonic information systems) and one of them is a social network. Therefore, the use of Perceived Enjoyment could be the most appropriate for analyzing user-acceptance towards social network [2]. B. Social Presence
Social Presence (SP) is defined as a medium that allows the user to feel that everyone else seems psychologically present [3]. Social Presence is formed if there is an interaction between user and technology that makes him/her feel the presence of other person and human warmth. A technology with human warmth is able to bring up the communication, socialization, and sensitivity to human feelings.
Digital content such as images and text will increase the social presence, as well as physical photos and letters. In addition, the way of speaking may also build psychological closeness and warmth. The social network which is full of images, videos, text, and emoticons help improving information richness to its users. This drives Social Presence to be chosen as the examined variable in research regarding social media. C. Technology Acceptance Model
Technology Acceptance Model (TAM) is the most popular research models to predict use and acceptance of information systems and technology by individual users [4]. The theory was developed by Fred Davis in 1985 with references to the Theory of Reasoned Action (TRA) which was conceived Fishbein & Azjen in 1975.
On TAM, Perceived Usefulness (PU) and Perceived Ease of Use (PEOU) are the two main latent variables that affect another latent variable Attitude towards Using (ATT) which later could influence the Behavioral Intention to Use (BIU) and the actual use. Perceived Usefulness is a degree to which a person believes that using a particular system would enhance his or her job performance [5]. Perceived Ease of Use means the degree to which a person believes that using a particular system would be free from effort. Attitude towards Using defined as a response favorably or unfavorably to an object that
results in either an acceptance or a rejection. While Behavioral Intention is an eagerness to do a particular
behavior due to good perception towards the object.
The basic TAM is shown in the picture below
designed by Fred Davis (1989)Fig.1 Technology Acceptance Model III. METHODOLOGY
The research of quantitative in nature is a research that is both objective and measurable using data in the form of figures or statements that are valued and can be analyzed with statistics. The framework hypothesis used is the Technology Acceptance Model (TAM), a popular theory to analyze and prove the level of acceptance of the technology. TAM serves a base of indicators will be used in research that is Perceived usefulness, Perceived Ease of Use, attitude toward using, Behavioral Intention to Use, and actual system use.
TAM is the renewal of the two models that have been coined earlier Theory of Reasoned Action (TRA) and the Theory of Planned Behavior (TPB). TRA indicates the relationship between attitude and subjective norm against behavior intention. This theory is considered by some researchers give rise to ambiguity or confusion on variable attitude and subjective norm because research results often show similarities (Samaradiwakara & Gunawardena, 2014). TPB is the concept of a TRA has been updated. TPB adding that indeed there are various factors that control a behavior known as Perceived Behavior Control. However, the TPB in its application toward acceptance of the technology is in doubt because of subjective variables norm does not have significant influence and perceived behavior control need to be further specified (Samaradiwakara & Gunawardena, 2014). Thus, the resercher chose to use TAM as an approach or basic framework for this research.
77 IJNMT, Vol. IV, No. 2 | December 2017
ISSN 2354-0082
Structural Equation Modeling (SEM) technique with SPSS AMOS as the tools.
Two main steps of SEM are measurement model fit and structural model fit. Measurement model fits measures the relationship between each latent variable with its observed variables, while structural model fit measures the relationship between one latent variable with another.
Model and hypothesis for this study are described as follows.
Fig.2 Model Designed for This Research To analyze the relationship of the latent variables and variables observed required supporting methods i.e. Structural Equation Modeling (SEM). There are two tools that are commonly used when analyzing the SEM that is SPSS AMOS and LISREL. SPSS AMOS selected for use in this research because it has a user friendly display and graphic-based making it suitable for novice users.
A. Research Variables
The variables that are used for research, among other Perceived Usefulness, Perceived Ease of Use, Attitude towards Using, and Behavioral Intention to Use as well as two external variables i.e. Perceived Enjoyment and Social Presence. This variable is the sixth latent variables respectively will be defined with two or more variables observed with a total of 20 pieces. The Actual variable Usage that in fact is a basic variable TAM is not used because it is considered already able to be explained by the variable Behavior Intention to Use.
Perceived Ease of Use and a Social Presence be exogenous variable because it is not influenced by any variables but rather affect other variables. Perceived Usefulness, Perceived Enjoyment, Attitude towards Using, and Behavioral Intention to Use be an endogenous variable, because it receives the influence of other variables.
B. Research Hypothesis
TAM has been used to examine the level of acceptance of a variety of information systems and technology in the Meta analysis. Look at the growth of social networking is increasingly high, the researcher proposes some hypothesis as part of searches about the level of acceptance of Snapchat and Instagram Story. As explained there are two
additional external i.e. latent variables Perceived Enjoyment and Social Presence.
The hypothesis may actually be defined themselves according to the curiosity of researchers. However, in order to be valid research surely needs to reference the earlier research. The preparation of this hypothesis refers to the two main references are:
1. Basic TAM designed by Fred Davis (1989)
Fig.3 Basic TAM
designed by Fred Davis
2. The model designed by Hassanein (2004) about the acceptance of ecommerce sites
Fig.4 Model designed by Hassanaein
Meanwhile, the proposed hypothesis model are: H1: High Social Presence will result in high
Perceived Enjoyment
H2: High Social Presence will result in high Perceived usefulness
H3: High Perceived Ease of Use will result in high Perceived usefulness
H4: High Perceived Ease of Use will result in high Attitude Towards Using
H5: High Perceived Usefulness will result in high Attitude Towards Using
H6: High Perceived Enjoyment will result in high Attitude Towards Using
IJNMT, Vol. IV, No. 2 | December 2017 78
ISSN 2354-0082
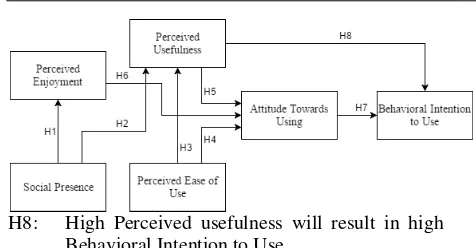
H8: High Perceived usefulness will result in high Behavioral Intention to Use
Fig. 5 The Model Research of influence of interest in the use of Snapchat and Instagram Stories C. Sampling Technique
This limited research sampling in a society that belongs to generation Z. Based on theories put forward the Grail Research (2011) and Baysal (2014), specifically the samples taken are those born in 1995 and over the next year.
The population becomes research material is a resident of Indonesia who ever used Snapchat and Instagram Stories. However, due to the number of the population belongs to is not clear or the number is too large to be recorded, it will be difficult to take samples at random and fair. The most appropriate technique is using the technique of non-probability sampling. Non-probability sampling is defined as techniques that do not give opportunities/equal opportunity for each element or member of a population to be selected into the sample (Sugiyono, 2008).
Types of Non-Probability Sampling that researcher use is Quota Sampling. Quota Sampling is a technique to determine the samples from populations that have certain characteristics to the sum (quota) of the desired. The survey will continue to be done to meet the quota of a particular sample from one of the categories or the largest.
In this study, the area that became the target of a sample are Jakarta and Tangerang. Total sample 100 people with a proportion of 50 people domiciled in Jakarta and 50 persons domiciled in Tangerang. The amount of the sample is based on the theory of minimum sample size for the processing of SEM is 10 times the number of invalid constructs complex or the dependent variable).
The dependent variables in the study amounted to 4 pieces, namely, Perceived Usefulness (PU), Perceived Enjoyment (PE), Attitude Towards Using (ATT), and Behavioral Intention to Use (BIU), then the minimum sample size is 40. Taking the samples was the 2-3 100 times the minimum size is quite capable of representing the results of hypothesis testing. In general, the number of samples ideal for
SEM is 100-150 but the sample size is smaller does not mean not being able to define the influence of variables.
IV. DATA ANALYSIS AND RESULTS
A. Measurement Model Fit
Measurement Model Fit includes goodness of fit test, also validity and reliability test. The goodness of Fit Test aims to find how well a set of data or observations already fits the model. There are some parameters or criteria that need to be fulfilled so that it is called a good fit. The result of the test applied in this study shows that both Snapchat and Instagram Stories have such good models.
After qualifying for the goodness of fit test, the next step is the validity and reliability tests. The validity of a model can be seen from Average Variance Extracted (AVE). The table shows that AVE of all variables is already above the minimum value which is 0.5. High AVE means there is a high amount of variance that is captured by a construct or variable then leads strong influences between variables.
Reliability can be checked from the value of Construct of Reliability (CR). In the table, CR of all variables are also already above the minimum value which is 0.5. This indicates data used for the model has good reliability.
Table 1. Ave Value Of Snapchat And Instagram Stories
Variable Average Variance Extracted Snapchat Instagram
Stories
PEOU 0.65 0.59
PE 0.59 0.51
SP 0.67 0.54
PU 0.52 0.47
ATT 0.66 0.66
BIU 0.80 0.79
Table 2. Cr Value Of Snapchat And Instagram Stories
Variable Construct Reliability
Snapchat Instagram Stories
PEOU 0.85 0.81
79 IJNMT, Vol. IV, No. 2 | December 2017
B. Structural Model Fit
Structural Model Fit is the last step in SEM analysis. If the measurement model defines the relationship between the latent and the observed ones, the structural model describes the relationship between
each latent variables
with a path diagram instead. The main part of structural model fit is hypothesis test.
A hypothesis is true if
p < 0.05 and CR >= 1.96 or CR < =-1.96.
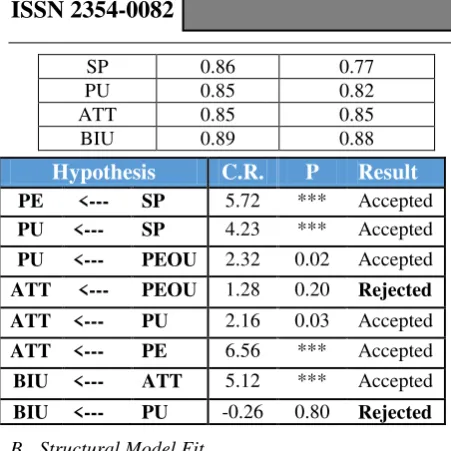
The result of hypothesis test shows there are 6 hypothesis accepted and 2 hypothesis rejected on analysis towards Snapchat. Perceived Ease of Use seems not to influence attitude very much. While on
Instagram Stories 7 hypothesis are accepted and 1 hypothesis is rejected. Perceived usefulness of both applications have no effect on behavioral intention directly
Table 3. Hypothesis Test For Snapchat
*** is p<0.001
Table 4. Hypothesis Test For Instagram Stories
*** is p<0.001
How strong one variable influences another variable can be identified by its loading factor.
As seen in Table V, loading factor of SP have big enough influences towards PE and PU. This could mean human warmth feeling while using Snapchat and Instagram Stories makes the users enjoy and keep those apps.
The first hypothesis, namely Social Presence (SP) effect on Perceived Enjoyment (PE) accepted by both applications. This means aspects of Social Presence as personal interaction seems real and immediate impression and human warmth that arises from the use of Snapchat as well as Instagram is considered interesting. It also makes both application users curious to try its features and enjoy lingering social networking use. The value of standardized loading factor H1 Snapchat is greater than the value of the loading factor Instagram Stories so they can be inferred for variable SP against PE has a great influence more significant at Snapchat compared with Instagram Stories.
The second hypothesis is Social Presence (SP) effect on Perceived usefulness (PU). This hypothesis was accepted on the analysis of both social networking. The author assumes the existence of a positive influence between these two variables because indicators Social Presence is useful to increase the effectiveness in communicating with others as well as
Hypothesis
C.R.
P
Result
Table 5. Loading Factor Of Each Relationship
IJNMT, Vol. IV, No. 2 | December 2017 80
ISSN 2354-0082
facilitate the work or activity its users. The influence of SP towards PU larger or more significant happens on the Snapchat than Instagram Stories.
The third hypothesis is the Perceived Ease of Use (PEOU) effect on Perceived usefulness (PU). This hypothesis was adopted from the basic framework of the hypothesis of TAM. Research conducted suggests that this hypothesis was accepted in Snapchat analysis as well as Instagram Stories. The ease of use of the application apparently significant effect on the perception this application is useful, for example, in terms of the interface that are not complex (PEOU indicator) makes sharing content with others more quickly (PU indicator). But PEOU didn't turn out too great influence to the PU value considering the loading factor both for Instagram Stories and Snapchat both are in the range of 0.2
The fourth Hypothesis is the Perceived Ease of Use (PEOU) influence on Attitude Towards Using. Just like the H3, this hypothesis is also based on the framework of the TAM. This hypothesis was rejected in an analysis of the Snapchat, but accepted on the analysis of the factor effect with Instagram Stories amounted to 0.3. Ease of use Snapchat where users are not the factors influencing perception or positive Outlook against the application. However, the ease of use Instagram Stories, according to users, thus being able to pose the positive perception and the like.
The fifth hypothesis is Perceived usefulness (PU) in content sharing, effective communication, and up-to-date to information raises the good view and the feeling of love towards those applications. The value of loading factor for Instagram Stories higher than Snapchat which means the influence of the larger PU against ATT on the use of Instagram Stories.
The sixth hypothesis is Perceived Enjoyment (PE) influence on Attitude Towards Using (ATT). This hypothesis was accepted in Snapchat analysis as well as Instagram Stories. This shows attraction of features provided and the convenience becomes factors users feel happy and entertained with this application. Loading factor value PE against ATT in Snapchat of Use(BIU). This hypothesis was adopted from the basic framework of the TAM. Analysis on both applications accepts this hypothesis which emphasizes positive attitudes and perceptions of users against Snapchat or
Instagram Stories affecting intention to use the social networking or increase the frequency of its use. ATT influence on BIU quite significant because its loading factor is in the range of 0.7-0.8.
The eighth hypothesis is the Perceived Enjoyment (PE) effect on Behavioral Intention to Use (BIU). This hypothesis was rejected in the analysis of both applications, it can be inferred that the convenience of use and attractive features on both social networking is not affecting the interest to continue using both of this social networking or increase the frequency of its use at a later date.
PE is another external variable that also has great influence. Loading factor of PE towards ATT is the second highest among SP, PU, and PEOU. This shows that users get interested in the ephemeral messaging Acceptance Model theory showed that 6 hypothesis is accepted and 2 hypothesis is rejected. From the accepted hypotheses, it can be inferred that PU is capable of significantly affecting the ATT which has
“domino effect” influencing BIU. In addition, PE and SP are the external variables that become the factors impacting on ATT directly and indirectly. However, the rejected hypothesis shows the absence of a direct relationship between Perceived Usefulness with Behavior Intention and the relationship between the Perceived Ease of Use with Attitude. This finding actually differs from the tested hypothesis of TAM by Fred Davis (1986).
Analysis of Instagram Stories shows that 7 hypothesis is accepted and 1 hypothesis is rejected. From the results, it can be concluded that the PU, PEOU, and PE influences the Attitude Towards Using so that it also impacts on the intention to use. Meanwhile, Social Presence also affects behavioral intention indirectly with Perceived Usefulness and Perceived Enjoyment as mediator. This hypothesis test result is the same as the result of research conducted by Hassanein (2004).
This study finds out that Perceived Enjoyment on Snapchat and Instagram Stories has the biggest influence on attitude so that it drives someone’s behavior intention to use them. PE on Snapchat has a stronger effect than PE on Instagram Stories as it can be seen on loading factor value. While Instagram Stories has stronger factors than Snapchat in Perceived Usefulness dan Perceived Ease of Use.
81 IJNMT, Vol. IV, No. 2 | December 2017
ISSN 2354-0082
V.V.C. Author thanks to Mr. Johan Setiawan as supervisor that have been guiding from beginning.
V.V.C. Auhor also thanks to Ms. Anna Riana Putriya for giving a short tutorial on using AMOS/SPSS for this research.
REFERENCES
[1] L. Chin and Z. Ahmad, "Perceived Enjoyment and Malaysian
Consumers’ Intention to Use a Single Platform E -Payment", SHS Web of Conferences, vol. 18, 2015.
[2] M. Ariff, T. Shan, N. Zakuan, N. Ishak and M. Wahi, "Examining Users' E-Satisfaction in the Usage of Social Networking Sites; Contribution from Utilitarian and Hedonic Information Systems", IOP Conference Series: Materials Science and Engineering, vol. 58, 2014.
[3] K. Hassanein and M. Head, "Manipulating perceived social presence through the web interface and its impact on attitude towards online shopping", International Journal of Human-Computer Studies, vol. 65, no. 8, pp. 689-708, 2007. [4] P. Surendran, "Technology Acceptance Model: A Survey of
Literature", 2012.