ISSN: 2339-076X (p); 2502-2458 (e),
Volume 4, Number 1 (October 2016): 689-696
DOI:10.15243/jdmlm.2016.041.689
Research articles
Spatial distribution of land susceptibility to degradation and
recommendation for its improvement: a case study in the upper Solo
Sub-Watershed
T.M. Basuki
1*, W.W. Wijaya
2, N. Wahyuningrum
3Watershed Management Technology Center), Jl. Jend. Ahmad Yani, Pabelan, PO Box 295, Surakarta- 57102, Indonesia
*corresponding author: [email protected]
Abstract:
Spatial distribution of land properties and its susceptibility to degradation is essential for watershed management planning. Therefore, a study was carried out to assess spatial distribution of land susceptibity to degradation and provide some recommendations for its improvement. The location of the study was in the upper Solo sub-watershed which majority located in Central Java Province. To classify degree of land susceptibility, a watershed typhology was applied. The typhology of watershed was based on land system and land cover type. Data of land cover and slope steepness were derived from sattelite images. Land system was obtained from Regional Physical Planning Programme for Transmigration (RePPProT). The results show that 36% of the study area is covered by highly susceptible and 55% moderate susceptible to degradation. The rest are classified as very high, low, and very low suceptible to degradation. Improvement of the degraded land can be achieved by applying land use planning which is suitable with its capability, in fact agricultural areas are found at land use capability classes VI and VII which have to use for production forest and limited production forest. In addition, conservation practices need to be applied, especially for agricultural land at Vstof land capability class.Keywords: land capability, land degradation, watershed typhology
Introduction
Spatial distribution of land properties is necessary for many application, e.g. for watershed management planning. Characterization of land properties provide information on its potential and its susceptibilty to degradation. Based on the information of land potential, a manager have to maintain or improve its productivity of a watershed/sub-watershed Kar et al., 2009).
Besides the potential of land, information of the degree of land susceptibility to degradation is also important in watershed management. Soil erosion and nutrient depletion are generally the major causes of land degradation ((Tesfa and Mekuriaw, 2014). Land degradation is not just a local problem, but it is a global environment and development issue (Bai and Dent, 2008). Land degradation causes economic loss associated with
Therefore, implementation of rehabilitation and improvement of degraded land is important because to meet the need of food, biomass energy, fiber, and timber for growing human population; to regulate greenhouse gas fluxes and global energy balance; to recover biodiversity; and to improve economic output in developing countries (Daily, 2007).
management is based on the interrelationships between land use, soil and water resources and the linkage between uplands and downstream areas (Makhamreh, 2011)..
Land system reflects natural properties, it can be derived from Regional Physical Planning Programme for Transmigration (RePPProT). The RePPProT provides information of land system, landform, slope steepness, soil, and climate condition. In addition to the natural properties mentioned above, watershed typhology is based on existing land cover which is effected by management. Land cover or land use is a key variable controlling hydrological process in a watershed/sub-watershed (Bormann and Elfert, 2010). Detriment of land cover will accelerate soil erosion and water loss and it leads to land degradation in a watershed.
Based on the background mentioned above, a study was undertaken to assess spatial distribution of land susceptibity to degradation (especially erosion) and provide some recommendations for its improvement. The location of the study was in the upper Solo sub-watershed which is categorized as one of the
priority sub-watersheds wich have to be recovered .
Materials and Methods
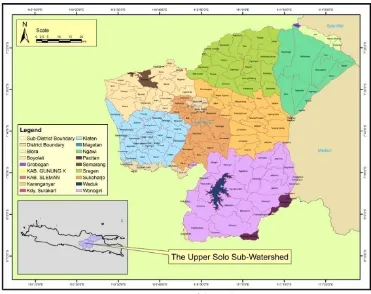
Description of the study areaThe study was undertaken in the Upper Solo sub-Watershed. Adminitratively, the dominant area is located in Central Java Province and the rest is belongs to East Java Province. It covers several districts and some of the largest are Boyolali, Klaten, Sukoharjo, Wonogiri, Karanganyar, Sragen, Surakarta and Ngawi (Central Java Province). Geographically, the study area is located between 7°14' and 8°06' South latitude and 110°26' and 111°27' East longitude (Figure 1). Rainfall pattern is characterized by a single rainy season with the highest is between November to April. Average annual rainfall is around 2100 mm. Due to heterogeneity of land use, geological formation, topography and climate, consequently various soil types are found, including Ultisols, Inceptisols, Alfisols, Vertisols, Entisols, and small areas are covered by Mollisols. Slope varies from 0 to more than 60%.
Materials
Materials used in this study are land cover maps derived from Landsat-7 ETM+ obtained from Balai Pengukuhan Kawasan Hutan (BPKH), Jogyakarta, imagery from Google Earth, Digital Elevation Model (DEM) derived from ASTER (Advanced Spaceborne Thermal Emission and Reflection Radiometer). The DEM ASTER was used to derived slope steepness. Data of land system, land form, soil type, geomorpholgy, and lithology are obtained from RePPProT Rainfall data were collected from Balai Besar Wilayah Sungai Bengawan Solo.
Field campaign and data analysis
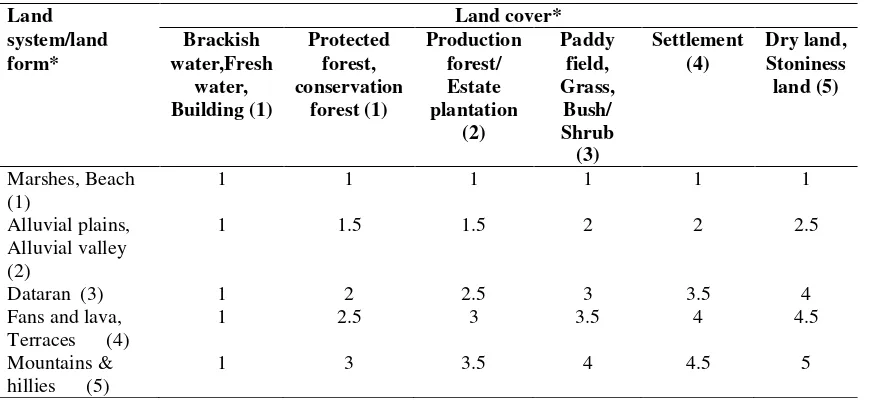
Prior fieldwork, land cover and slope analysis were carried out to produce preliminary maps. In addition, integration of land system and land cover was conducted to obtain map showing land susceptibility to degradation. The degree of land susceptibilty was based on watershed typhology introduced by Paimin et al. (2012) as provided in Table 1. The resulting maps were used to collect the necessary data such as soil properties, soil erosion, ground check of land cover, slope, landform, the degree of land susceptibility, etc.
Table 1. Degree of land sensitivity to degradation (erosion)
Land Land cover*
Remarks:*The number in brackets are value/score of its parameter. Source: Paimin et al. (2012)
Further analysis was undertaken to integrate the preliminary maps and the data from field campaign. The resulting data were evaluated and classified based on Table 2.
Table 2. Classification of land susceptibility to degradation (erosion)
Category value Degree of sensitivity
Very high > 4.3 Very high degraded High 3.5 – 4.3 High degraded Moderate 2.6 – 3.4 Moderate degraded Low 1.7 - 2.5 Low degraded Very low < 1.7 Very low degraded
Biophysical characteristics collected from the field was used to classify land use capability (LUC). The resulting classification provides
covers are suitable with their land capability. The data and classification of LUC were presented in Appendix 1.
Results and Discussion
Land coversBased on that table, it can be seen that the dominant land cover is dryland agriculture areas (38% of the sub-watershed), followed by paddy field (33% of the study area). Dryland agriculture areas in the low altitude are usually used for cultivation of cassava, maize, peanuts, chili, sweet potato, etc. In high altitude, the dry lands are for growing vegetable.
Based on Google Earth analysis and ground check, there are different characteristics of settlements in village and urban areas, as consequent these two settlements are seperated.
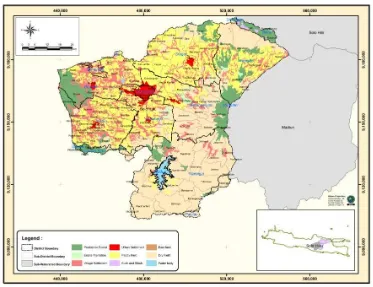
Settlements in the villages are characterized by large home garden, and these are often planted by annual crops or used as mixed garden. On the other hand, settlements in urban areas are commonly covered by concrete buildings without or with limited yard. Differentiation of these land covers is essential since runoff and sediment yield depend on ratio of impervious surface, soil, and land cover (Biggs et al., 2010). The spatial distribution of the land cover is provided in Figure 2.
Table 3. Land covers at various slope classes
Land covers Area (ha)
0-8% 8-15% 15-25% 25-45% > 45% Total
Production forest 18428 13636.3 8298.5 13215.5 12176.4 65754.7
Estate plantation 1542.1 1617.3 1036.1 717.7 66.3 4979.4
Village settlement 57782.3 15224.4 2981.9 895.3 43.8 76927.7
Urban settlement 10456.8 1048.7 41.3 11546.9
Paddy field 157778.6 32370.9 5776.3 1446.4 22.9 197395.2
Bush and shrub 1055.1 543.1 290.3 98.3 168.2 2155.0
Bareland 220.4 122.7 50.9 24.3 359.9 778.2
Dryland cultivation 78413.7 55301.3 35223.6 45845.2 12180.6 226964.4
Water body 7366.4
Total 332622.8 120158.2 53776.57 62291.99 25018.15 593867.8
Land susceptibility
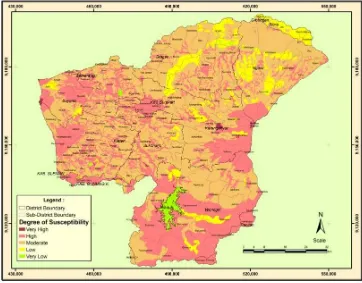
Degree of land susceptibilty was obtained by integration of land systems and land covers, the spatial distribution is shown in Figure 3. The result shows that the study area is dominated by moderate susceptible (55.1%), followed by highly susceptible (35.7%), and the rest are low susceptible (7.7%), very low susceptible (1.4%), and the least is 0.2%. Figure 3 shows that the areas with high susceptible are located in mountain areas, such as in Jatiyoso, some part of Ngargoyoso, Tawangmangu, Jenawi, Sine,
Bulukerto, Jatipiro, Ngrambe, and Jogorogo sub-Districts which are at the foot of Lawu mountain. High susceptible is also found at some places at the South border of the upper Solo sub-watershed, commonly the areas consist of karst hillies and mountains. Some regions at the fan alluvial of Merapi mountain can be categorized as high and moderate susceptible such as in Kemalang, Kemusuk, Boyolali, Cepogo, Selo, and Ampel sub-District.
Figure 3. Spatial distribution of the degree of land susceptibility to degradation in the upper Solo sub-watershed
Recommendations to recover and improve of the degraded land in the study area
Utilization of land exceeded its capability is one of the causes land degradation. In the moist to wet regions, it leads water erosion and depletion of soil nutrients, furthermore reduction in land productivity. Due to those conditions, land management have to consider land use capability (LUC). The basic concepts of LUC is land management according to its biophysical properties. Due to high variation in land properties, therefore LUC should be classified
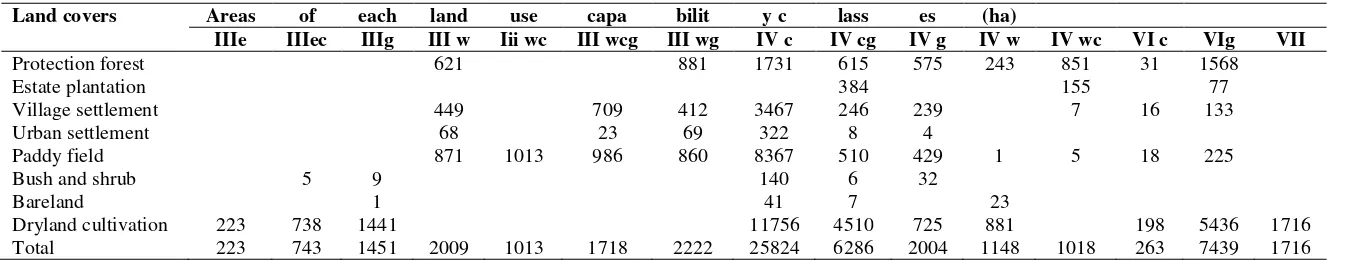
Table 4. Land use capability classification of the study area
Land covers Areas of each land use capa bilit y c lass es (ha)
IIIe IIIec IIIg III w Iii wc III wcg III wg IV c IV cg IV g IV w IV wc VI c VIg VII
Protection forest 621 881 1731 615 575 243 851 31 1568
Estate plantation 384 155 77
Village settlement 449 709 412 3467 246 239 7 16 133
Urban settlement 68 23 69 322 8 4
Paddy field 871 1013 986 860 8367 510 429 1 5 18 225
Bush and shrub 5 9 140 6 32
Bareland 1 41 7 23
Dryland cultivation 223 738 1441 11756 4510 725 881 198 5436 1716
Total 223 743 1451 2009 1013 1718 2222 25824 6286 2004 1148 1018 263 7439 1716
The other condition of some of the study area is provided in Figure 4. This area consists of rock outcrops with very shallow soil. With this condition, land rehabilitation by planting pioneer species is a proper choice. The root of pioneer species may accelarate weathering process of its parent materials. Besides that, decomposed
litterfall may increase soil organic matter. Seasonal crop cultivation as shown in that figure must be avoided to prevent further nutrient depletation. Building terraces using available rocks that are easily found in that area is recommended to reduce soil erosion.
Figure 4. Dryland cultivation in steep slope area (a) and area covered by rock outcrops (b)
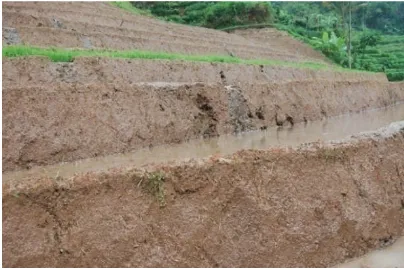
Bench terraces have generally been applied for paddy field as illustrated in Figure 5. However, when soil tillage is carrried out for planting preparation, grasses for raiser strengthener are cleared. Cleaning all of the strengthener terraces induces soil erosion.
Figure 5. Bench terraces at paddy field.
Besides biophysical properties, the social, economy and institutional aspects must be considered to recover and improve land degradation. In general, (Scherr and Yadav, 1996) suggests that policy recommendation to improve land degradation can be achieved through 1). Improvement of information systems for land management, 2). Increase research and technology, 3). Promote investment, 4). Modify property rights to encourage longterm land
6). Support local organizations to manage local resources.
Conclusion
The spatial distribution of the study area shows various degree of land susceptibility to degradation. The dominant is moderate susceptible (55,1%) followed by highly susceptible ( 35,7%). In summary, recovery and improvement of land degradation in the study area have to consider land use capability. Furthermore, soil conservation practices must be consider biophysical properties as well as social, economic, and institutional aspects.
Acknowledgements
This research was funded by Watershed Management Technology Center, Surakarta.
References
Bai, Z. G. and Dent, D. L. 2008. Land Degradation and Improvement in South Africa 1 . Identification by remote sensing, (August).
Biggs, T.W., Atkinson, E., Powel, R., and Ojeda-Revah, L. 2010. Land cover following rapid urbanization on the US-Mexico border: Implications for conceptual models of urban watershed processes. Landscape and Urban Planning96: 78–87.
Bormann, H. and Elfert, S. 2010. Apllication of
catchment characteristics and sensitivity to land use change.Advances in Geoscience27: 1–10.
Chen, L., Huang, Z., Gong, J., Fu, B. and Huang, Y. 2007. The effect of land cover/vegetation on soil water dynamic in the hilly area of the loess plateau, China.Catena70: 200– 2008.
Daily, G.C. 1995. Restoring value to the world's degraded lands.Science269: 350–354.
Gao, J. and Liu, Y. 2010. Determination of land degradation causes in Tongyu County, Northeast China via land cover change detection. International
Journal of Applied Earth Observation and Geoinformation12: 9–16.
Kar, G., Kumar, A. and Singh, R. 2009. Spatial distribution of soil hydro-physical properties and morphometric analysis of a rainfed watershed as a tool for sustainable land use planning.Agricultural Water Management96: 1449–1459.
Makhamreh, Z. 2011. Using remote sensing approach and surface landscape conditions for optimization of watershed management in Mediterranean regions. Physics and Chemistry of the Earth 36: 213–220.
Paimin, Pramono, I.B., Purwanto, and Indrawati, D.R. 2012. Sistem Perencanaan Pengelolaan Daerah Aliran Sungai. Puslitbang Konservasi dan
Rehabilitasi. Badan Litbang Kehutan. Kementrian Kehutanan.
Priyono, N.S. and Savitri, E. 1999. Pedoman teknis kesesuaian lahan dan jenis-jenis HTI. Pedoman Teknis. Balai Teknologi Pengelolaan Daerah Aliran Sungai.
Scherr, S.J. and Yadav, S. 1996. Land degradation in the developing world: Implications for food, agriculture, and the environment to 2020. Food, Agriculture, and the Environment Discussion Paper 14. International Food Policy Research Institute 1200 Seventeenth Street, N.W. Washington, D.C. 20036-3006 U.S.A.
Tesfa, A. and Mekuriaw, S. 2014. The effect of land degradation on farm size dynamics and crop-livestock farming system in ethiopia: a review.
Open Journal of Soil Science4: 1-5.
Yiran, G.A.B., Kusimi, J.M., and Kufogbe, S.K. 2012. A synthesis of remote sensing and local knowledge approaches in land degradation assessment in the Bawku East District, Ghana. International Journal of Applied Earth Observation and Geoinformation
14: 204–213.
Annex 1. Land Use Capability Criteria
No Restriction Class I II III IV V VI VII VIII
1 Soil conservation practices
e 100 100 60-80 60-80 20-60 10-40 1-20 1-20
2 Tingkat Erosi e Ignored Ringan Moderate High - - - -3 Drainage w Slow Slightly
slow
5 Struktur tanah s Coarse granular 7 Depth of regolith
(cm)
s > 200 100-200 80-100 60-80 40-60 20-40 10-20 <10
8 Percentage of gravel (%)
s - - - - 1-10 10-20 20-60 >60