ADBI Working Paper Series
Trends in National and Regional
Investors Financing Crossborder
Infrastructure Projects in Asia
Prabir De, Muthi Samudram,
and Sanjeev Moholkar
No. 245
September 2010
The Working Paper series is a continuation of the formerly named Discussion Paper series; the numbering of the papers continued without interruption or change. ADBI’s working papers reflect initial ideas on a topic and are posted online for discussion. ADBI encourages readers to post their comments on the main page for each working paper (given in the citation below). Some working papers may develop into other forms of publication.
Suggested citation:
De, P., M. Samudram, and S. Moholkar. 2010. Trends in National and Regional Investors Financing Crossborder Infrastructure Projects in Asia. ADBI Working Paper245. Tokyo: Asian Development Bank Institute. Available:
http://www.adbi.org/working-paper/2010/09/02/4056.national.regional.investors.financing.infrastructure.asia/ Please contact the author(s) for information about this paper.
Prabir De:
Muthi Samudram:
Sanjeev Moholkar:
Sanjeev Moholkar is a senior development specialist at the Japan International Cooperation Agency in India.
This is a revised version of a background paper prepared for ADB/ADBI's flagship study on infrastructure and regional cooperation and the book Infrastructure for a Seamless Asia.
An earlier version of the paper was presented at the ADB/ADBI’s conference on “Infrastructure and Regional Cooperation”, held at New Delhi, 12-13 June 2008. The authors are grateful to Biswa Bhattacharya and Harinder Kohli for their useful comments on an earlier version of the paper. The authors are grateful to the Asian Development Bank Institute’s editorial team for their excellent editing of the manuscript. The support provided by the Asian Development Bank Institute for carrying out this study is gratefully acknowledged. The views expressed in this paper are the views of the authors and do not necessarily reflect the views or policies of the Asian Development Bank Institute, the Asian Development Bank, its Board of Directors, or the governments they represent. Asian Development Bank Institute does not guarantee the accuracy of the data included in this paper and accepts no responsibility for any consequences of their use. Terminology used may not necessarily be consistent with Asian Development Bank’s official terms.
Asian Development Bank Institute Kasumigaseki Building 8F
3-2-5 Kasumigaseki, Chiyoda-ku Tokyo 100-6008, Japan
Tel: +81-3-3593-5500 Fax: +81-3-3593-5571 URL: www.adbi.org E-mail: [email protected]
Abstract
This study examines a range of crossborder infrastructure development issues related to the Asian countries. Despite active pursuit of private investment in infrastructure by most developing countries in Asia and a growing number of success stories, the pace of such investment remains slow. Participation by the private sector in infrastructure development has been mixed. While there has been moderate progress in national infrastructure development by the private sector, progress is rather limited in the case of development of crossborder infrastructure in Asia. This study documents that Asian countries have attracted higher private sector investment for the development of national infrastructure projects such as seaports and airports as compared to crossborder infrastructure projects. The rising trend among private investors in infrastructure projects indicates a decline of investments by developed country investors. One of the findings of this study is that crossborder energy projects have received greater private sector investment globally as compared to transport, telecommunication, and water projects. In the context of Asia, too, energy sector projects still dominate the investment scenario. By considering all modes of financing, this study finds that crossborder infrastructure financing in Asia has witnessed an upward trend in the last decade and a half. Aside from hydropower projects in Bhutan, crossborder infrastructure in Asia is pursued through public-private partnerships. Interestingly, these few crossborder projects in Asia have limited private sector investors, compared to other regions, despite a wide base of local investors in Asia. This paper also shows that public sector investment drives crossborder energy and transportation projects in Asia, whereas private sector investments have picked up the pace only recently, specifically after the 1997 Asian financial crisis. This study recommends that given the huge infrastructure investment needs of the region and insufficient government resources, the role of the private sector and public-private partnerships in enhancing infrastructure facilities in Asia is very crucial. A review of select case studies of crossborder infrastructure projects clearly indicates that the major reasons for slow progress of regional infrastructure development by private sector stem from both economic to non-economic issues that need to be addressed in order to promote seamless Asia.
Contents
1. Introduction ... 1
2. Trends in Private Sector Investments in Crossborder ... 2
2.1 Infrastructure Projects ... 2
3. Trends in Private Sector Investment in Crossborder ... 7
3.1 Infrastructure Projects in Asia ... 7
3.2 Private Investors in International Airports and Seaports in Asia ... 8
3.3 Private Investors in Energy Crossborder Infrastructure in Asia ... 10
3.4 Asian Crossborder Infrastructure Projects by all Modes of Financing ... 13
4. Crossborder Investment Projects in Asia: Review of Selected Case Studies ... 15
4.1 Theun Hinboun Hydropower, Lao PDR ... 15
5. Nam Theun 2 Hydropower, Lao PDR... 18
5.1 Location ... 18
5.2 Implementation Arrangement ... 18
5.3 Financing Arrangement ... 19
5.4 East–West Economic Corridor in the Greater Mekong Subregion ... 20
5.5 Hydropower Projects in Bhutan ... 26
5.6 Malaysia-Singapore Second Link ... 27
5.7 Indonesia–Singapore Gas Pipelines ... 29
5.8 Myanmar–Thailand Gas Pipelines ... 30
6. Investments in Crossborder Infrastructure: Lessons from Latin America ... 32
7. Conclusions and Policy Recommendations ... 35
7.1 Mechanisms to Strengthen CBIPs ... 37
7.2 Way Forward ... 38
Appendix 1 ... 40
Appendix 2 ... 41
Appendix 3 ... 42
Appendix 4 ... 44
Appendix 5 ... 56
Appendix 6 ... 57
1. INTRODUCTION
Infrastructure has always played a key role in integrating economies across a region. Notwithstanding certain environmental side effects, well-developed and efficient infrastructure facilities are essential for regional economic development and growth. Seen as part of a dynamic concept, infrastructure is a regional public good, moving factors of production within and across regions, thus helping those regions attain higher productivity and growth.
In a regional setting, infrastructure comprises national and international components. Infrastructure that is created and used exclusively for a nation can be termed as national infrastructure, while infrastructure that has crossborder implications1 is popularly termed as international infrastructure (hereinafter, crossborder infrastructure). While national infrastructure can indirectly enhance regional or international connectivity, crossborder infrastructure enhances international (and regional) connectivity through the exchange of factors of production, trade and investment. For example, transport networks linking neighboring countries enlarge market size, and help national economies to grow. Thus, crossborder infrastructure is seen as one of the major determinants of economic integration processes, especially for land-locked or island countries (Venables 2007). It is often argued that if countries in a region are not interlinked through efficient crossborder infrastructure facilities, their integration process will undoubtedly slow down (Vickerman 2002).2
Asia’s economic performance in the past few years—particularly in the first half of the ongoing decade—has been commendable on many counts. Economic growth has accelerated and is now averaging over 7% per annum.
3
Asia needs substantial investment in infrastructure varying between US$165–412 billion (6.2%–7.3% of GDP) per annum for the period 2007–2011.
A fascinating story is unfolding and the entire world is watching with wonder the emergence of Asia as a major economic force. Accompanying this growth is the need for efficient national and international infrastructure services for both production and consumption, and international trade purposes.
4
• High investment costs. For countries to integrate networks seamlessly,
expensive programs of shared support and investments are required so as to benefit from crossborder infrastructure.
Asia’s long-term growth and integration hinges upon the quality and quantity of infrastructure services, both national and international, to be developed in years to come. The widening infrastructure gap between countries is resulting in lower productivity, high transportation and logistics costs, reduced competitiveness, and slower growth. Bridging this gap means overcoming several formidable challenges; some of them, as noted by ADB (2006a), are as follows:
• Uneven distribution of benefits. The costs and benefits of regional projects are
likely to be distributed unevenly between countries. This often leads to decisions being based on national costs and benefits rather than regional benefits, resulting in insufficient provisions for crossborder infrastructure.
1
For example, an international airport or seaport which enhances regional or international connectivity. 2
A vast literature exists on impact of infrastructure on regional integration. One can refer, for example, Brooks and Menon (2008), and ADB-JBIC-WB (2005), among others.
3
This refers average annual growth rate for the period 2000 to 2006 for ASEAN+4 countries, calculated based on
World Development Indicators 2008, World Bank.
4
• Financing constraints. The public sector is often unable to provide infrastructure
because of its weak financial sector, usually marked by underdeveloped long-term capital markets and recurring fiscal concerns. International markets also remain inaccessible to varying degrees because of the higher rates of return that markets expect from such risks associated with investments in the public sector.
• Varying regulatory response. The varying strengths and weakness of regulatory
regimes between countries make regional infrastructure projects difficult to coordinate and develop, particularly in securing private sector financing that requires strong regulation to mitigate risks.
We look ahead at what the challenges are for crossborder infrastructure in Asia, and how to think of approaching them.5 Given the above, the objective of this paper is two-fold. First, it aims to identify the trends among national and regional investors financing crossborder infrastructure projects (CBIP) that can enhance regional connectivity. Second, it draws lessons from case studies and experiences to enhance regional cooperation in Asia. As a corollary, it also addresses the major constraints for infrastructure financing (including public and mixed investment, as well as private investment) in selected crossborder infrastructure projects in Asia.6
The paper is organized as follows: Section 2 discusses trends in crossborder infrastructure projects across the world by region and sector. This section deals with private sector investments in crossborder infrastructure, and the nature and types of investments driven by the private sector. Section 3 focuses on trends in crossborder transportation and energy infrastructure in Asia through different modes of financing. One of the reasons for selecting crossborder transportation and energy projects is that energy sector projects are driven by market demand and are better suited for principal commercial investment while transport projects usually have to be justified on the broader economic benefits (beyond commercial benefits). Discussion on these two types of crossborder projects is immensely important for private sector financing. Section 4 then presents selected case studies of CBIPs in Asia and evaluates their results. Section 5 presents the crossborder infrastructure development strategy in South America. Finally, Section 6 presents policy recommendations for enhancing Asian regional connectivity through CBIPs.
2. TRENDS IN PRIVATE SECTOR INVESTMENTS IN
CROSSBORDER
2.1
Infrastructure Projects
The last decade and a half witnessed a sharp decline in official development aid for infrastructure projects in developing Asia (Kirkpatrick and Parker 2004; Jones 2006). In contrast, private capital flows for infrastructure have increased significantly in the same period in response to the general trend towards privatization of infrastructure in developing countries.
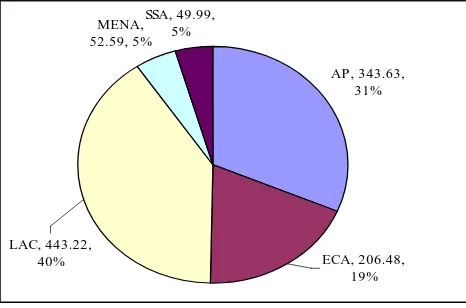
From 1984 to 2006, private sector investment (PSI) for global national and crossborder infrastructure projects amounted to US$1.1 trillion (Table 1). The Latin America and Caribbean region (LAC) ranked first, accounting for a 40% (US$443.22 billion) share of global PSI (Figure 1(a)). The Asia and Pacific (AP) and Europe and Central Asia (ECA) regions followed with investments of US$343.63 billion (31%) and US$206.48 billion (19%), respectively.
5
This has been argued by ADB in many of their seminal publications and RCI activities. Refer, for example, ADB (2006b).
6
The upsurge in investment in infrastructure has been driven mainly by telecommunications (US$536.30 billion). However, investment varies across regions. For example, PSI in the AP region has been driven by the energy sector (US$127.69 billion), whereas it is telecommunications that has attracted majority of the PSI in the other regions.
Although private sector investment in both national and crossborder infrastructure has increased in the last decade and a half, its growth has been uneven and has fluctuated across regions. Global PSI was higher in the 1990s, compared to first half of the ongoing decade (Figure 2), a trend that was much influenced by the AP and LAC regions. In contrast, the ECA, Middle East and North Africa (MENA) and Sub-Saharan Africa (SSA) regions have attracted higher PSIs in infrastructure development during 2001–2006 as compared to 1991–2000. Nevertheless, the trend in PSI in infrastructure development across regions has been rising, except for ECA, where the trend has decelerated in recent years.7
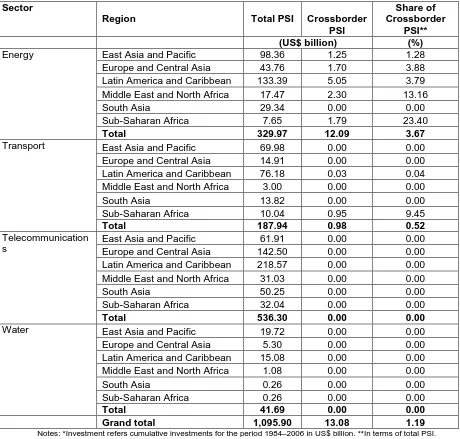
Table 1: Private Sector Investments (PSI) in Infrastructure: 1984–2006*
Sector
Region Total PSI Crossborder
PSI
Latin America and Caribbean 133.39 5.05 3.79
Middle East and North Africa 17.47 2.30 13.16
Latin America and Caribbean 76.18 0.03 0.04
Middle East and North Africa 3.00 0.00 0.00
Latin America and Caribbean 218.57 0.00 0.00
Middle East and North Africa 31.03 0.00 0.00
Latin America and Caribbean 15.08 0.00 0.00
Middle East and North Africa 1.08 0.00 0.00
South Asia 0.26 0.00 0.00
Sub-Saharan Africa 0.26 0.00 0.00
Total 41.69 0.00 0.00
Grand total 1,095.90 13.08 1.19
Notes: *Investment refers cumulative investments for the period 1984–2006 in US$ billion. **In terms of total PSI. Source: Calculated based on World Bank Private Participation in Infrastructure database, available
at
7
Compared to investments in infrastructure overall, however, PSI in crossborder infrastructure has been very low. From 1991 to 2006, only 1.36% of cumulative investment in infrastructure (US$13.08 billion) went into crossborder infrastructure, mainly in energy and transport (Table 1). The distribution of cumulative PSI in crossborder infrastructure across sectors has also been unbalanced. As shown in Table 1, energy alone has attracted 92.43% of total crossborder investments from the private sector (US$12.09 billion). Private participation in energy has increased presumably as a result of technological developments that have reduced the minimum size for efficient power plants, along with user-friendly financing mechanisms that have reduced the risks associated with the projects.
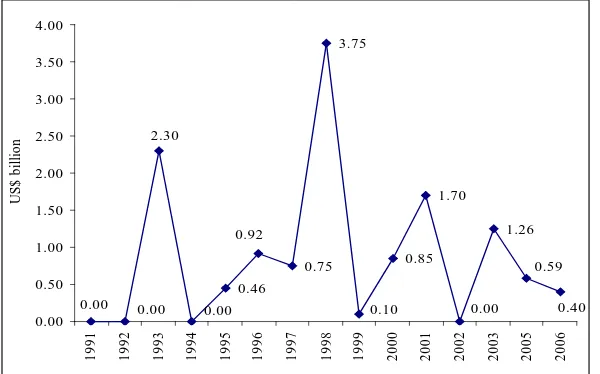
The annual investment for development of crossborder infrastructure has also been inconsistent across the world. It reached a peak of US$3.75 billion in 1998, and thereafter shrunk to less than US$500 million in 2006 (Figure 3). Cumulative PSI in crossborder infrastructure was almost double during the 1990s (US$9.13 billion), when compared with the first half of the ongoing decade (US$3.95 billion).8
Figure 1(a): Distribution of Private Sector Investment in Infrastructure by Region
AP , 343.63, 31% MENA,
52.59, 5% SSA, 49.99,
5%
LAC, 443.22,
40% ECA, 206.48,
19%
Figure 1(b): Distribution of Crossborder Private Sector Investment in Infrastructure by Region
AP, 1.25, 10%
ECA, 1.70, 13%
LAC, 5.08, 38% MENA, 2.30,
18%
SSA, 2.74, 21%
AP = Asia and Pacific, ECA = Europe and Central Asia, LAC = Latin America and Caribbean, MENA = Middle East and North Africa, SSA = Sub-Saharan Africa
Source of Figure 1(a, b): Calculated based on World Bank Private Participation in Infrastructure database, available
at
Figure 2: Private Sector Investment in Infrastructure
1990-2000 157.46 82.28 239.03 17.60 11.81 508.18
2001-2006 145.65 118.46 119.39 33.16 37.25 453.92
AP ECA LAC MENA SSA World
AP = Asia and Pacific, ECA = Europe and Central Asia, LAC = Latin America and Caribbean, MENA = Middle East and North Africa, SSA = Sub-Saharan Africa
Source: Calculated based on World Bank Private Participation in Infrastructure (PPI) Database, available at
Figure 3: Year-Wise Trend in Private Sector Investment in Crossborder Infrastructure
0.46
1991 1992 1993 1994 1995 1996 1997 1998 1999 2000 2001 2002 2003 2005 2006
U
Source: Calculated based on World Bank’s Private Participation in Infrastructure database, available at
The LAC region has been relatively successful in attracting as much as 38% (US$5.08 billion) of global crossborder infrastructure investment for the period 1984–2007 (Figure 1(b)).9
9
Refer Appendix 3 (a, b) which provides region-wise crossborder infrastructure.
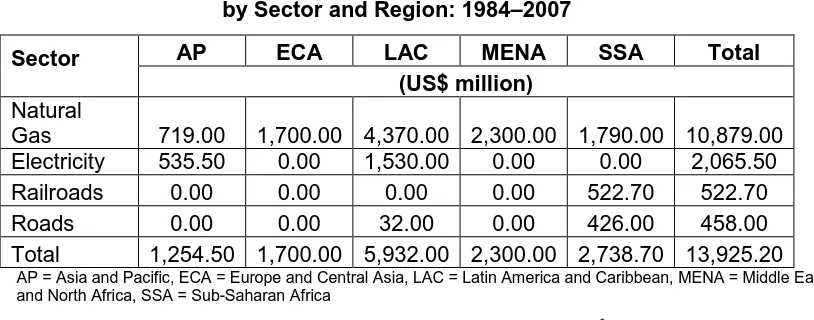
Table 2: Private Sector Investment in Crossborder Infrastructure by Sector and Region: 1984–2007
Sector AP ECA LAC MENA SSA Total
(US$ million)
Natural
Gas 719.00 1,700.00 4,370.00 2,300.00 1,790.00 10,879.00 Electricity 535.50 0.00 1,530.00 0.00 0.00 2,065.50
Railroads 0.00 0.00 0.00 0.00 522.70 522.70
Roads 0.00 0.00 32.00 0.00 426.00 458.00
Total 1,254.50 1,700.00 5,932.00 2,300.00 2,738.70 13,925.20
AP = Asia and Pacific, ECA = Europe and Central Asia, LAC = Latin America and Caribbean, MENA = Middle East and North Africa, SSA = Sub-Saharan Africa
Note: Investment refers to cumulative investments for the period 1984–2007 in US$ million. Source: Calculated based on World Bank Private Participation in Infrastructure database, available at
Projects related to natural gas (plant and transmission) have attracted nearly US$10.88 billion of investment (Table 2), indicating that crossborder infrastructure projects in the private domain are mostly driven by energy sector. With US$2.07 billion of private sector investments, electricity comes next. In terms of ranking, the AP region appears last in the league, where PSI has been restricted only to crossborder natural gas and electricity projects. It is seen that natural gas and electricity projects have the advantage of better revenue-generating potential in comparison to transport sector projects. Power projects that are driven by market demand thus have low revenue-generating risks, while transport projects have to be justified in economic terms and have higher revenue risks.
Private infrastructure projects have taken a number of forms, i.e., management and lease contracts, concessions, greenfield projects, and divestitures, of which greenfield projects have gained most in popularity.10
Table 3(a): Types of Crossborder Private Sector Investment
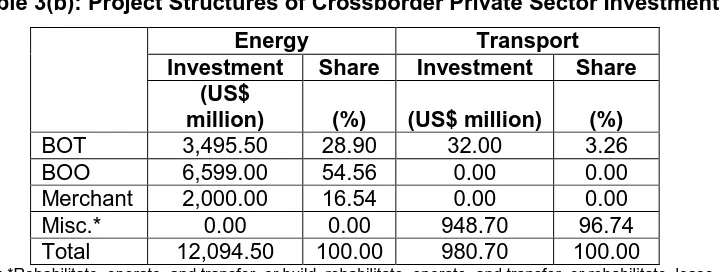
Greenfield crossborder projects have been largely developed in the energy sector (Table 3(a)), whereas concession remains the preferred mode for crossborder PSI in the transportation sector. The build, own, and operate (BOO) format has been the most preferred project structure for energy PSI (54.6%), whereas miscellaneous arrangements, such as rehabilitate, operate, and transfer; or build, rehabilitate, operate, and transfer; or rehabilitate, lease or rent, and transfer, accounted for 96.7% of transport PSI (Table 4(b)). Much of the private investment in electricity has been in greenfield projects with independent power producers implementing BOO or build, operate, transfer (BOT) contracts. About 28.9% and 16.54% of cumulative investments in the energy sector has been invested in crossborder projects implemented under BOO and Merchant categories. Unlike SSA, the AP region has witnessed a dissimilar trend in types of investment. During 1991–2006, greenfield projects, with an investment of US$1.25 billion, accounted for all the private sector investments in the AP region, of which public-private partnerships (PPP) were implemented under BOT or BOO routes.
Energy Transport
(US$ million)
Greenfield 12,094.50 32.00
Concession 0.00 948.70
Total 12,094.50 980.70
10
Table 3(b): Project Structures of Crossborder Private Sector Investment
Energy Transport
Investment Share Investment Share
(US$
million) (%) (US$ million) (%)
BOT 3,495.50 28.90 32.00 3.26
BOO 6,599.00 54.56 0.00 0.00
Merchant 2,000.00 16.54 0.00 0.00
Misc.* 0.00 0.00 948.70 96.74
Total 12,094.50 100.00 980.70 100.00
Note: *Rehabilitate, operate, and transfer, or build, rehabilitate, operate, and transfer, or rehabilitate, lease or rent, and transfer
Source: Calculated based on World Bank Private Participation in Infrastructure database, available at
Finally, the AP region has attracted about 31% of global PSI (US$343.63 billion) in infrastructure, next to Latin America, where the crossborder component has been only 0.5%, amounting to US$1.25 billion. Given this low volume of private investment in crossborder infrastructure projects, the AP region ranked last among the five regions considered in this study.
3. TRENDS IN PRIVATE SECTOR INVESTMENT IN
CROSSBORDER
3.1
Infrastructure Projects in Asia
An essential requirement for regional cooperation and sustainable development is the provision of efficient, reliable, and affordable crossborder infrastructure services, such as power, transport, and telecommunications. Private participation in infrastructure is no longer a business dominated by investors from the developed world. Firms from developing countries mobilized 44% of private funds for projects reaching financial closure in 1998– 2006 (Shurm et al 2008).11
Given the rapid growth of regional economic activities, trade, and investment in Asia, crossborder infrastructure has become an important building block of regional integration in the era of globalization (Kuroda et al. 2007). In Asia, development of crossborder infrastructure, especially transportation networks and energy pipelines, is underway, and is expected to contribute significantly to regional integration by reducing transportation costs and facilitating intra-regional trade and services.
At the same time, a large number of developing countries have introduced some private participation into their crossborder infrastructure services, especially telecommunications, and, to a lesser degree, electricity and transportation.
There are many causes behind the recent surge in private investment in infrastructure. Among the most important are the inefficiencies of public service provision, the need for economic pricing and cost recovery, technological advances enabling greater private participation, advances in regulatory frameworks, the need for private resources, and the potential investment gap that countries face. Therefore, the role of the private sector in financing and supporting crossborder infrastructure facilities is paramount. However, given the growing demand for national and international infrastructure in Asia, the private sector, whether via PSI or PPP, is expected to play a much greater role in bridging the infrastructure gap and for sustaining economic growth in the region. Here, we discuss the trends in private
11
sector investment in both national12
3.2
Private Investors in International Airports and Seaports in Asia
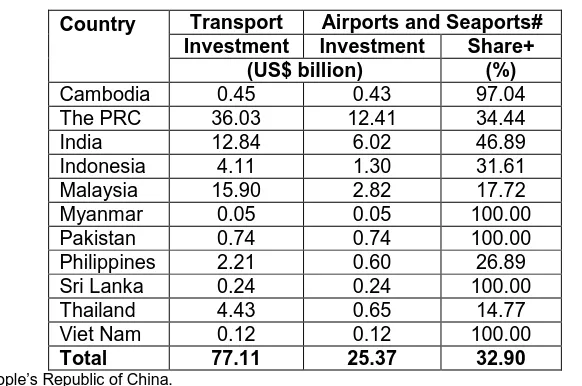
and crossborder infrastructure projects, which offer direct and indirect implications for the Asian integration process.Ideally, international airports and seaports offer crossborder services. About 33% of total private sector investment in transportation infrastructure from 1991 to 2006, amounting to US$25.37 billion, went into seaports and airports in Asia. There is a positive correlation between the size of an economy and the private sector investment it has attracted for national infrastructure that has crossborder implications. Larger economies such as the People’s Republic of China (PRC) and India attracted higher PSI for airports and seaports from 1991 to 2006 than did smaller economies (Figure 4). The PRC has attracted US$12.41 billion of private investment in airports and seaports, accounting for 34.44% of total PSI in transport infrastructure in the last decade and a half in that country. India and Malaysia trail the PRC with investments of US$6.02 billion and US$2.82 billion in airports and seaports, respectively (Table 5). Unlike the PRC and India, Malaysia’s share of PSI in seaports and airports, as a percentage of total PSI in transport infrastructure, has been relatively low (17.72%). Private sector investment in airports and seaports in other Asian countries, such as Viet Nam, Pakistan, Sri Lanka, and Myanmar, has been very low. Whatever PSI went into the transportation infrastructure in these countries is driven by international airports or seaports only.
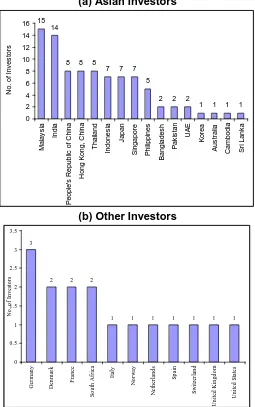
There has been some replacement of developed country investors by local investors in Asia. The US$25.37 billion PSI in airports and seaports in Asia from 1991 to 2006 drew from several private sector investors that were concentrated in Asia (Figure 5(a, b)).13
12
We only consider national infrastructure which has crossborder implications.
If we exclude downstream investors, Malaysia ranked first with 15 private sector investors in airports and seaports. A few airports and seaports in Asia have also been funded by investors from the rest of the world. However, their presence is much smaller compared to Asian investors.
13
Figure 4: Relationship between Size of the Economy and Private Sector Investment in Asia
Malaysia
India
PRC y = 0.0056x + 0.3514
(13.30) (1.11) Adj. R2 = 0.9567
0 2 4 6 8 10 12 14
0 500 1000 1500 2000 2500
GDP
PSI
Notes: *Figures in parentheses are t-values. The t-value of estimated gross domestic product (GDP) coefficient is significant at 1% level. **Both GDP and private sector investment (PSI) are taken at current US$ billion.
Sources: GDP taken from World Bank World Development Indicators CD-ROM 2007, while PSI was estimated from the World Bank Private Participation in Infrastructure database, available at
Table 4: Private Sector Investment in Transport Infrastructure in Asia*
Country Transport Airports and Seaports#
Investment Investment Share+
(US$ billion) (%)
Cambodia 0.45 0.43 97.04
The PRC 36.03 12.41 34.44
India 12.84 6.02 46.89
Indonesia 4.11 1.30 31.61
Malaysia 15.90 2.82 17.72
Myanmar 0.05 0.05 100.00
Pakistan 0.74 0.74 100.00
Philippines 2.21 0.60 26.89
Sri Lanka 0.24 0.24 100.00
Thailand 4.43 0.65 14.77
Viet Nam 0.12 0.12 100.00
Total 77.11 25.37 32.90
PRC = People’s Republic of China.
Notes: *Cumulative investment for the period 1991 to 2006. #Consider only international seaports and airports. +In terms of investment in transport sector.
Figure 5: Private Sector Investors in Airports and Seaports in Asia*
Note: * This series considers investors for cumulative investment for the period 1991 to 2006 in international seaports and airports.
Source: Calculated based on World Bank Private Participation in Infrastructure database, available at
3.3
Private Investors in Energy Crossborder Infrastructure in Asia
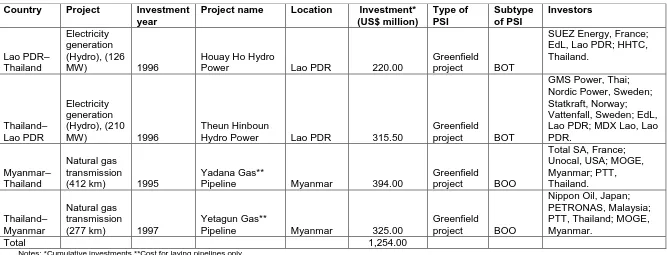
up in Myanmar in the last decade for exporting natural gas to Thailand. All four projects have been operating successfully. The number of private investors in these four projects in GMS has so far been limited to 10, where these investments were also accompanied by five public sector investors as minor shareholders (Table 6). These GMS crossborder infrastructure projects have attracted investments from Nippon Oil of Japan, PETRONAS of Malaysia, Total SA and SUEZ of France, and Unocal of USA, among others.
Table 5: PSI in Energy Infrastructure in Asia*
Country Energy Crossborder Energy
Investment Investment Share#
US$ billion US$ billion %
Afghanistan 0.002 0.000 0.000
Bangladesh 1.056 0.000 0.000
Cambodia 0.231 0.000 0.000
The PRC 34.847 0.000 0.000
India 17.978 0.000 0.000
Indonesia 11.680 0.000 0.000
Lao PDR 2.586 0.536 21.00
Malaysia 14.313 0.000 0.000
Myanmar 0.719 0.719 100.00
Nepal 0.269 0.000 0.000
Pakistan 6.738 0.000 0.000
Philippines 15.463 0.000 0.000
Sri Lanka 0.463 0.000 0.000
Thailand 12.244 0.000 0.000
Viet Nam 2.715 0.000 0.000
Total 121.304 1.255 1.035
PRC = People’s Republic of China.
Notes: *Cumulative investment for the period 1991 to 2006. #In terms of investment in energy sector Source: Calculated based on World Bank Private Participation in Infrastructure database, available at
Table 6: Private Sector Investment in Completed Crossborder Energy Infrastructure Projects in Greater Mekong Subregion
Country Project Investment
year
Project name Location Investment*
(US$ million)
Pipeline Myanmar 394.00
Greenfield
Pipeline Myanmar 325.00
Greenfield
Notes: *Cumulative investments **Cost for laying pipelines only
3.4
Asian Crossborder Infrastructure Projects by all Modes of
Financing
The analysis above considered only private sector investments in national and crossborder infrastructure. However, figures for investment in crossborder infrastructure increase if other forms of investment, such as government, PPP and mixed, are also considered.
Crossborder infrastructure financing (all modes) has seen an upward trend in the last decade and a half in Asia. As shown in Table 7, there are six crossborder hydropower projects, of which five are already commissioned and one is under construction; eight crossborder natural gas transmission projects, all in Association of Southeast Asian Nations (ASEAN); three crossborder overland transportation projects, all in GMS (under construction); and one sea bridge connecting Malaysia with Singapore. All these projects have attracted about US$13 billion over time, mostly financed through PPP.
Figure 6: Investment in Crossborder Infrastructure in Asia: 1991 to 2007
7,894.50
5,090.30
0 1,000 2,000 3,000 4,000 5,000 6,000 7,000 8,000 9,000
Government PPP
U
S
$
b
illio
n
PPP = public private partnerships. Source: Calculated based on Table 7.
Table 7: Crossborder Investment Projects by all Modes of Financing in Asia
Sector
Sub-sector Project
Country
pair Year# Investment
(US$ mln.)
Investment
Type Status
Energy
Hydro
power Chukha, Bhutan
Bhutan–
power Kurichhu, Bhutan 2002 119.00
Government
Thailand 2005 1,450.00
PPP
Singapore 1991 260.00
PPP
Corridor 2001 1,331.30
Government+
Ongoing
Transport Road
North–South
Transport Corridor 2003 4,716.20
Government+
Singapore 1998 790.00
PPP
Completed
Total 12,984.80
PPP = Public private partnership.
Notes: *PSP / PPP in downstream including US$62 million power transmission under PPP. **Includes second crossing bridge, a Customs, Immigration and Quarantine complex, 3 toll plazas, 2 rest and service areas and other ancillary facilities. #Year of operation, except for ongoing projects, for which, we have taken as year of financial closure. +Having substantial multilateral funding.
In view of all the foregoing, it may be concluded that crossborder infrastructure financing has witnessed an upward trend in the last decade and a half in Asia. Barring hydropower projects in Bhutan, crossborder infrastructure in Asia is normally pursued through PPP, where energy sector projects are relatively higher in numbers. Interestingly, these few crossborder projects in Asia have limited presence of private sector investors, compared to other regions. Nonetheless, Asian countries have attracted higher private sector investments for development of national infrastructure projects like seaports and airports, compared to crossborder infrastructure projects in the past.
This accumulated anecdotal evidence also suggests that Asian investors have improved their position and are taking on a larger share of infrastructure investments that promote regional connectivity. There are three possible reasons for this: first, the broadening and deepening of capital markets in Asian countries has enabled their investors to mobilize more resources; second, the growing experience of investors with infrastructure investments, often as minority partners with developed country investors, has given them more expertise; and, third, Asian investors might well be in a better position to understand and therefore deal with the political economy issues that stem from privately supported Asian infrastructure projects.
Given the huge infrastructure investment needs of the Asian region and insufficient government resources, the role of the PSI and PPPs in enhancing Asian infrastructure facilities, particularly crossborder infrastructure, is thus very important. At the same time, Asia has very many active local investors, some of whom have been engaged in CBIPs. We look at the trends of these investors in some selected CBIPs next.
4. CROSSBORDER INVESTMENT PROJECTS IN ASIA:
REVIEW OF SELECTED CASE STUDIES
We cite here a few examples among several of ongoing and/or completed CBIPs in Asia and critically evaluate their performance in the context of crossborder infrastructure development and regional cooperation.14
4.1
Theun Hinboun Hydropower, Lao PDR
The Theun Hinboun project (originally known as Nam Theun 1-2) was the first BOOT Hydropower project implemented in Lao PDR. Construction started in 1994 and the plant was made operational in 1998. The 210 MW (2x10⁵ MW) project is located about 100 km upstream of the confluence of the Mekong river. A 230 kV transmission line (86 km long) was also constructed to transport electricity from the station to the Thailand border.
The main objective of the project was to support economic growth in Lao PDR by enhancing foreign exchange earnings through the export of electric power to Thailand. This was the first project implemented under the 1993 memorandum of understanding between Lao PDR and Thailand for developing 1,500 MW of power in Lao PDR by the year 2000 for export to Thailand. It was the first major investment under the new foreign investment policy of Lao PDR. In addition to technical assistance for structuring legal agreements for implementation of the project, the Asian Development Bank (ADB) also extended loan assistance for the project.
The final project cost, including foreign and local currencies was US$240.3 million. The project was completed on time, without delays, and with substantial savings from the original estimated cost.
14
4.1.1 Implementation Arrangement
In 1994, the Government of Lao PDR formed a PPP, named Theun-Hinboun Power Company Ltd. (THPC), to plan, design, finance, construct, own, operate, and maintain the project, and sell electricity under a long-term contract to the Electricity Generating Authority of Thailand (EGAT).
The Government of Lao PDR was represented by Electricité du Laos (EdL), the state-owned power utility, while the private sector was represented by the foreign sponsors MDX Lao Public Company Ltd. (MDX) and Nordic Hydropower AB (NH). The MDX is 90%-owned by GMS Power Public Company Limited; the remaining 10% is owned by the Crown Property Bureau, Thailand. The NH is equally owned by Statkraft A.S. of Norway and Vattenfall AB of Sweden.
From the beginning, since the legal framework in Lao PDR was inadequate for the project to be implemented under a commercial format, the Government of Lao PDR and THPC entered into a License Agreement (LA) that authorized THPC to implement the project on a BOOT basis for 30 years (from the start of commercial operation). The LA contained provisions on exclusive rights and tax and royalty obligations of THPC. THPC was also protected under the LA against any water diversions detrimental to it, except for the implementation of the NT2 Project. In return, THPC was required to pay a royalty of 5% of gross revenue to the Government. THPC was granted a tax holiday of five years commencing with the start of commercial operations up to the end of 2002, after which THPC was expected to pay 15% tax on its taxable income. The Lao PDR Government took responsibility for environmental and social mitigation; funding for such mitigation measures and compensation, however, was to be provided by THPC (limited to US$2.6 million).
The Power Purchase Agreement (PPA) was executed between EdL and EGAT in June 1996 with a validation period of 25 years from the start of commercial operations. The PPA provided for an option to renegotiate the tariff after 10 years and was based on the take-or-pay principle under which EGAT undertakes to purchase 95% of the project’s available energy output. The tariff itself was denominated in dollars, of which 50% was to be payable in dollars and 50% in Thai baht at the exchange rate on the execution date of the PPA. In the first year of operation, the tariff was negotiated at US$0.0484 per kWh and would increase thereafter at a fixed rate of 1% per annum.
4.1.2 Financing Arrangement
Equity funding of US$110 million was raised by the Government of Lao PDR, through EdL (US$66 million), MDX (US$22 million) and NH (US$22 million). On the other hand, debt funding worth US$130.3 million was provided by the Government of Lao PDR (US$6.9 million), commercial banks (US$64.8 million) and through export credit (US$58.6 million). Funding towards the Government of Lao PDR’s contribution for the project was channelized through grant assistance from Norwegian Agency for Development Cooperation (US$7.1 million) and UNDP (US$0.4 million); and loan assistance from ADB (US$57.7 million) and Nordic Development Fund (US$7.3 million).
The ADB loan was extended to the Government of Lao PDR at a 1% interest rate, with 40 years maturity and a 10-year grace period. The ADB funds were further on-lent by the Government of Lao PDR to EdL (US$5.5 million, at 6.21% interest, with 25 years maturity and 5 years grace period) and THPC (US$8.5 million, at 10% interest, with 16 years maturity and 4 years grace period).
4.1.3 Financial Returns
net income from the project would reach US$736.6 million and US$407.6 million, respectively. After paying dividends to shareholders, THPC would still retain US$13.8 million in unappropriated earnings. On the other hand, the shareholders are projected to recover their investment through dividend payments. By 2009, virtually all debt will have been paid and profitability will depend on tariff negotiations with EGAT and whether EGAT moves to a pooling system. Financial analysis shows that THPC’s recalculated financial international rate of return (FIRR) was 19.5% (project life of 25 years). Further, it was found that over the period 1998–2000, EdL would earn about US$46.4 million and the income was projected to reach about US$28.6 million per annum till the year 2022.
A recent ADB publication (ADB 2007) has mentioned that THPC’s sales revenues increased from US$42 million in 1998 to US$57 million in 2005, and are expected to reach about US$55 million in the future. THPC is making a healthy profit and maintains a comfortable debt-servicing capacity. The project generated net income of US$88 million from 2003 to 2005. THPC’s dividend payments over 2003–2005 amounted to US$78 million, of which US$47 million went to EdL. In addition THPC paid about US$2.8 million in royalties to the government in 2005. The profit tax payment for 2004 was about US$3.4 million and about US$2.9 million for 2005.
Figure 7: Financing Structure of Theun-Hinboun Project
Source: Authors.
4.1.4 Mitigation of Project Risks
The project risks were mitigated to a large extent through a number of initiatives from the project sponsors (UNCTAD 2005). The Government of Lao PDR committed to meet its obligations under the 30-year BOOT license, while the ADB waived its usual negative pledge covenant. The shareholders gave a completion guarantee to the lenders.
As shown in Figure 7, an offshore escrow account, managed by a French bank, was set up and pledged to the lenders. Funds were distributed, first to meet the O&M costs of THPC, then to service the debt to the lenders, followed by royalties to the government, and later, dividends to shareholders. O&M costs are managed via a contract awarded every three years. In addition, Lao PDR agreed to join the World Bank Group’s Multilateral Investment Guarantee Agency (MIGA), which allowed the lenders to take out sovereign risk insurance with MIGA.
Escrow Account
Shareholders Government of Lao PDR
THPC
EGAT
Banque Indosuez Lenders
Loan
30 year license agreement, giving rights to land, water etc. and limiting environmental
PPA, 25 years take-or-pay, fixed price with automatic escalation
3) Royalties Electricity
1) O&M expenditures 2) Debt service
various assignments
Loans 4) Dividends
4.1.5 Project Benefits
THPC was expected to contribute about US$21.2 million revenue in the year 2000; that would increase to US$40.9 million by the year 2022. In the real sense, the project was found to have favorable impact on Lao PDR’s economy through export of electricity to Thailand and rural electrification in the surrounding areas. Substantial employment was generated during the construction period and in plant operation. The project also resulted in capacity building of several workers associated with the project. Further, availability of modern education and medical services has resulted in improved living conditions in the area. With substantial funds earned from the project, the EdL is in a position to subsidize electricity tariffs for the poor population in the country and support its various power projects.
On the negative side, project-related environment and social impacts were found to be a serious issue when flows were diverted to the Nam Hai–Nam Hinboun system. However, the risks were largely mitigated with support from ADB in the form of review missions and technical assistance.
Overall, the project was found to be remarkably successful with respect to financing arrangements, project implementation, and coordination between all parties concerned.
5. NAM THEUN 2 HYDROPOWER, LAO PDR
5.1
Location
The 1,075 MW Nam Theun 2 (NT2) hydropower project is a trans-basin scheme being developed via the diversion of the flow of the Nam Theun river from the Nakai plateau down to the Xe Bang Fai river. It comprises 4 x 250 MW units designed for the supply of power to Thailand and 2 x 37.5 MW units for Lao PDR domestic power consumption. The project also includes a 138 km long 500 kV transmission line from the power station to Thailand border near Savannakhet.
In terms of financing, NT2 is the largest private sector crossborder project, as well as being the largest private sector hydropower scheme, in Southeast Asia. Construction was started immediately after financial closure in June 2005. The project has been constructed at an estimated cost of US$1.45 billion (Table 8). The official handover of the project to the Lao PDR Government is planned for June 2010.15
5.2
Implementation Arrangement
The project is being implemented by Nam Theun 2 Power Company Limited (NTPC), a company incorporated under the laws of Lao PDR and mandated through a BOOT concession agreement to build, own, operate, and transfer the project to the Government of Lao PDR at the end of the 25-year operation period.
The shareholders of NTPC comprise EDF International (EDFI), a subsidiary of Electricité de France (35%); Lao Holding State Enterprise (LHSE), a company fully owned by the Government of the Lao PDR (25%); Electricity Generating Public Company Limited (EGCO) of Thailand (25%); and the Italian-Thai Development Public Company Limited (ITD) of Thailand (15%).
resettlement and social development activities. In case of defaults, termination rights have been provided to both parties.
The PPA was executed between NTPC and EGAT and Electricité de France in 2003. Unlike the Theun Hinboun project, the PPA is based on the take-or-pay principle under which 95% of the project’s energy would be sold to Thailand for the first 13 years, and later subject to a spot market, if operated. The energy tariff has been built on system avoided cost16
Table 8: Financing Structure of Nam Theun 2
in Thailand.
Project Financing Plan US$
million
Thai Baht million
Total (US$
million)* % of total
Long-term Debt 500.00 20,000.00 1,000.00 69.0%
ECA–COFACE (France)
AFD (Agence Française de Dévelopment) NIB (Nordic Investment Bank)
PROPARCO facility Thai Exim Facility
Thai commercial Bank Facility (7 Banks)
136.00
Notes: *Converted at 1US$= THB 40. Source: ADB (2007).
5.3
Financing Arrangement
Equity contribution of nearly 31% of project cost has been made by the shareholders and debt funding of about 69% has been raised from international financial institutions (IFIs), commercial banks/lenders. A combination of financial institutions, comprising 5 multilateral, 4 export credit, 2 bilateral and 16 Thai and international commercial banks, are involved with financing of the project.
The World Bank has provided a Partial Risk Guarantee loan under International Development Association (IDA) (US$42 million), and MIGA has extended a guarantee for debt (US$42 million), while ADB has extended a Political Risk guarantee (US$42 million). The World Bank has also provided IDA grant assistance (US$20 million), and ADB has extended loan assistance (US$50 million) and a public sector loan (US$16.1 million) to the Government of Lao PDR.
16
In addition, nine international commercial banks (ANZ, BNP Paribas, BOTM, Calyon, Fortis Bank, ING, KBC, SG, and Standard Chartered) and seven Thai commercial banks (Bangkok Bank, Bank of Ayudhya, Kasikorn Bank, Krung Thai Bank, Siam City Bank, Siam Commercial Bank, and Thai Military Bank) are providing long-term loans to NTPC. The equity contribution of LHSE (one of the shareholders of NTPC) is financed through loans, grants, and other tools by AFD, ADB, European Investment Bank, and the World Bank.
5.3.1 Mitigation of Project Risks
Some of the major issues related to private sector participation in crossborder infrastructure projects are the political, contractual, and legal risks associated with such projects. As noted above, these risks have been appropriately addressed by the international funding agencies. The NT2 is a classic case of PPP with limited recourse financing, ably supported by international funding agencies, export credit agencies, and multiple commercial lenders. Learning from shortcomings from the Theun Hinboun Hydropower project, the NT2 has been carefully designed, with adequate planning for economic, environmental, and social safeguards that are extensively monitored by internationally recognized and independent panels, project lenders, and IFIs. The safeguards were designed in consultation with local villagers and under international guidelines and recommendations from the various financial institutions involved with the project. These measures are fully funded as part of the project cost and cover the entire project area including catchment reservoir and downstream areas. As it is based on the take-or-pay principle, revenue risks for the project are minimal. A 5-year tax holiday followed by 10% and 15% corporate profit tax during the next 5-year period applies to the project.
5.3.2 Expected Project Benefits
Given the relatively small size of the national economy, the project is expected to have significant economic impacts in Lao PDR.17
It is expected that the NT2 could lead to doubling in private investments (IMF, 2003) during the construction period. Construction activities are providing job opportunities to nearly 4,000 workers in the neighborhood and local areas. All these effects are expected to boost the economic growth of Lao PDR from the current 6% to nearly 7% up to 2011. In addition, availability of additional electricity from the power station and better access due to about 140 km of new or upgraded roads under this project would improve the living condition of the population in the adjoining areas.
The project will generate considerable revenue through taxes, royalties, and dividends for the government, and this revenue can be effectively ploughed back to provide necessary public goods and services required for sustainable growth and poverty reduction. The Government of Lao PDR, via the revenue to be generated from the project, is planning to establish a poverty reduction fund with the objective to promote economic and social development throughout the country.
Revenues generated from the project will provide substantial funding for the government’s National Growth and Poverty Eradication programs. The NT2 project would help the Lao PDR economy grow at higher rate in coming years, which would lead to higher personal incomes and per capita consumption, thereby bringing economic well-being and reducing poverty in Lao PDR.
5.4
East–West Economic Corridor in the Greater Mekong
Subregion
conceived to create an integrated, prosperous, and equitable Mekong subregion, complementing individual national efforts to promote economic growth and reduce poverty. In 2001, the GMS countries endorsed a 10-year strategic framework targeting enhanced connectivity, increased competitiveness, and a greater sense of community in the region. About 11 flagship projects were identified, out of which the North-South Economic Corridor (NSEC), East-West Economic Corridor (EWEC), and Southern Economic Corridor (SEC) dominated the GMS transport sector plan. The corridors were planned to encourage trade, investment, and tourism, and ease crossborder movement of people and goods in the subregion and were intended to serve about 2.6 million sq. km. of surface area and nearly 320 million people.
Out of the several flagship programs, the EWEC is in the most advanced stage of completion, and several transport, energy, telecommunications, industrial, tourism, and other programs have been successfully launched or are under implementation. Most of these projects are being funded through public resources, and private participation is limited. The case study of EWEC has been included to appreciate the catalytic role played initially by the government and donor agencies in funding basic infrastructure, which, in turn, attracts the private sector to develop other economic infrastructure in the subregion.
The EWEC flagship initiative focuses on transport (road, water, railway, and airports), energy, telecommunications, tourism, and other initiatives with the intent to further strengthen economic cooperation, and facilitate trade, investment, and development along the East–West transport corridor. A pre-investment study for EWEC (ADB, 2001) has developed a framework for cooperation and development in agro-industry, infrastructure, trade and investment, tourism, and industrial estates, and recommended about 74 projects, including policy and institutional development initiatives.
5.4.1 Completed/Ongoing Infrastructure Projects along EWEC
Data from ADB’s GMS Development Matrix has been used to appreciate the financing trends for completed and ongoing infrastructure projects along the EWEC. About 11 projects, comprising 9 transport and 2 investment projects are either completed or are under implementation along the EWEC. Transport projects comprise the improvement of road links and construction of missing links along the EW transport corridor, and rehabilitation of port facilities at Da Nang, Viet Nam. The investment projects comprise the Lane Xang Mineral project in Lao PDR and the feasibility study for Special Economic Zone (SEZ) in Savan-Seno along the Lao PDR-Thailand border.
5.4.2 Transport
The transport segment of the EWEC has been implemented with assistance from ADB, Japan Bank for International Cooperation (JBIC), Japan International Cooperation Agency (JICA), and other donor agencies and national governments. The transport corridor (1,450 km) starts near the Andaman Sea west of Myanmar and traverses through Thailand and Lao PDR before terminating near the South China Sea east of Viet Nam. The corridor links Mawlamyine–Myawaddy in Myanmar; Mae Sot–Phitsanulok–Mukdahan in Thailand; Savannakhet–Dansavanh in Lao PDR; and Lao Bao–Hue–Dong Ha–Da Nang in Viet Nam. While most of the highway is now operational, work on few sections in Myanmar is yet to be taken up. The highway provides crucial access to ports in northeast Thailand and central Lao PDR, and has opened opportunities to several medium-sized cities.
Table 9: List of Ongoing and Completed Projects along the East-West Economic
Funding Agencies Project Outline
Mawlamyine–Myawaddy
Highway, Myanmar 100
Government of Thailand’s soft loan to Myanmar
Improvement of Myawaddy to Mawlamyine roads in Myanmar comprising (i) Myawaddy–Kawkareik– Paan–Mawlamyine; and (ii) Myawaddy– Kawkareik–Mudon–Mawlamyine roads. Upgrading of first 18 km section of Mae Sot–Myawaddy–Mawlamyine road
completed with assistance from Thailand.
Widening of Mae Sot–
Out of the total 770 km, 4-laning of 233km has been completed; 75km is under construction and 262km to be widened over 2007–11
Construction of four road sections of Eastern Seaboard corridor
Second Mekong International Bridge, Thailand and Lao PDR18
100 Bridge (1.6km) and approach roads (6km)
Access roads to Second Mekong International Bridge, Thailand
22 Government of Thailand
4–laning of RN 212 on Mukdahan side and widening of Mukdahan Bypass
Improvement of Xeno– Muang Phin highway, Lao PDR
65 Government of Japan (Grant through JICA)
Project involves 130–km road section [Seno–Phalan (70 km) & Phalan–Muang Phin (60 km)]
Rehabilitation of RN 9 (78 kms), including border crossing infrastructure,
construction & improvement of rural roads, small bridges, river crossing systems, and other infrastructure.
Upgrading &
Upgrading & improvement of RN 9 between Lao Bao and Dong Ha on Highway 1 (83 km), including upgrading of the Dong Ha bypass and border– crossing infrastructure
Construction of two parallel 6.4 km tunnels, 5.9 km access roads and bridges along Highway 1, connecting Da Nang and Hue
Rehabilitation of Da Nang
Port at Tien Sa, Viet Nam 124
JBIC Loan–¥10,690 million and rest by Government of Viet Nam
Upgrading 2 terminals, construction of a breakwater, 15 km access road to Highway 1.
ADB = Asian Development Bank, JBIC = Japan Bank for International Cooperation, JICA = Japan International Cooperation Agency, WB = World Bank. RN = Route Number
Note:*Data not available
Source: ADB website, GMS Development Matrix, 2006. available at http://www.adb.org/GMS/devt-matrix.asp
18
Figure 8: Funding Sources for Transport Projects along East-West Economic Corridor
JICA (US$65M) 8% Others (US$258M)
32%
ADB (US$57M) 7%
JBIC (US$432M) 53%
ADB = Asian Development Bank, JBIC = Japan Bank for International Cooperation, JICA = Japan International Cooperation Agency.
Source: ADB GMS site, available at: http://www.adb.org/GMS/Economic-Corridors.
Transport projects along the EWEC have attracted investments of US$813 million, primarily from donor agencies and from public resources of member countries. As noted in Figure 8, the JBIC has contributed about 53%, JICA 8%, ADB 7%, and others comprising financing from country governments, and other donor agencies, about 32%. Thus, transport projects along EWEC have not attracted finances from the private sector. On a few sections, a toll is being imposed, and the revenue generated is used to maintain the facility and service the debt.
5.4.3 Trade Facilitation and Crossborder Transport Agreement
The transport crossborder barriers along the EWEC have gradually decreased since 2000. For example, travel time between Khanthabouly (Savannakhet) bordering Thailand to Dansavanh bordering Viet Nam has been reduced from 12 hours to as low as 3 hours. Further, accessibility to education and medical services has also improved. In 2003, all member countries had signed the crossborder transport agreement (CBTA), and, with completion of the second Mekong bridge in 2006, developed through JBIC assistance, a major portion of the EWEC was ready for movement of goods and people.
Under the crossborder trade and investment flagship, a number of technical assistance (TA) programs were extended to the GMS countries. The assistance comprised formulation of the CBTA and support to member countries for framing annexes and protocols, institutional development and capacity building, laws and regulations improvement, and identification of means to mitigate non-physical barriers for crossborder movement. So far, an investment of US$5.5 million has been made, with ADB contributing about 74%, country governments nearly 22%, and the United Nations Economic and Social Commission for Asia and the Pacific (ESCAP) about 3%. The procedures are being pilot tested along the Thai–Lao PDR border at Mukdahan–Savannakhet and at the Lao PDR–Viet Nam border at Dansavanh–Lao Bao and is being prepared for full implementation starting 2009.
5.4.4 Industrial Investment
The Lao Bao SEZ, spread over 15,800 hectares of land, was the first SEZ developed in Viet Nam in 1998. An investment of US$25 million was made in providing basic infrastructure like electricity, water, and telecommunications. To attract private investors, preferential treatment was provided, including exemption from value-added tax, export/import tax, and special consumption tax. Corporate tax was waived for the first four years and discounted thereafter. Half of the personal income tax of laborers was waived and land lease was exempted for the first 11 years. As a result, about 45 projects with investment of nearly US$120 million were made by the year 2006. In addition, a major private sector project (Lane Xang Minerals Ltd.), costing US$205 million, has been developed by the Australian gold and copper producer, Oxiana, in this area.
The Savan-Seno SEZ (Lao’s first SEZ) is under implementation and is scheduled for completion in 2011. The SEZ was identified by a JICA study, while the cost (US$300,000) for preparing the Feasibility Study was provided by the Government of Thailand. The SEZ comprises twin sites, one located near the Second Mekong International Bridge (305 hectares) and the other in Seno at east of Savannakhet (20 hectares). The industrial estates will function as export processing zone, free-trade zone, and free service and logistics center. To attract investments, preferential treatment is provided, including exemption from corporate tax for the first 5–10 years, exemption from import and consumption tax, as well as personal income tax discount of 5%. Land lease is allowed for 75 years, comprising free lease for the first 12 years if total lease period is more than 30 years.
Further, with an objective to enhance PPPs and competitiveness, a 10-year fund with target capitalization of US$20–25 million has been created. The fund identifies sectors and industries for investment in Cambodia, Lao PDR and Viet Nam. ADB has extended 25% of the equity capital, while the balance has been contributed by other development financing institutions and private investors. The fund provides long-term equity support to small and medium-sized enterprises (SMEs) and invests in enterprises with strong growth potential, export orientation, and capable management. It targets enterprises that are able to generate employment, promote an environment that fosters economic growth, and forge regional cooperation in the GMS.
5.4.5 Financing for future Projects along East-West Economic Corridor
The ADB Development Matrix has identified about 356 projects throughout the GMS at an estimated cost of US$27.1 billion, out of which transport and energy sectors would comprise 66% and 28% respectively.
Figure 9: Estimated Cost for Proposed Projects in Greater Mekong Subregion
Source: Calculated by authors based on GMS database, available a
The ADB report on GMS Flagship Initiative EWEC (ADB 2005d) indicates that major sources for funding these projects shall comprise government, multilateral development, and international lending agencies, foreign and local direct private investment, international private equity funds, and international and domestic capital markets. As mentioned above, the participating governments will have to shoulder a significant share of project costs, along with policy/program formulation, and implementation, and institutional development. In several cases, implementation of projects will require multi-country support, and cost-sharing will have to be evolved on a case-by-case basis.
5.4.6 Government Support
The EWEC traverses four countries and the road projects can be categorized as CBIP. However, all road improvement projects along the EWEC are funded by national governments and/or external donor partners, and private sector participation has been negligible. Such transnational roads do not cater for large traffic volumes and are not financially viable. These projects are considered as basic infrastructure projects and do not attract the private sector investment. However, once the basic road network is made available, other economic activities start gaining momentum and the private sector may later participate in ventures that are financially remunerative. Accordingly, leadership from national governments in planning and funding such crossborder transport projects and from the external funding agencies that support future development is highly important.
5.4.7 Project Benefits
To sum up, the GMS economic corridors would link the subregion with a direct outlet for trade with the rest of the world. There is no denying that the combination of improved access to trade and reduced impediments to crossborder trade would accelerate the economic development of the region, primarily along the corridors. These GMS corridors would encourage trade, investment, and tourism in the Mekong region, and ease the crossborder movement of people and goods, thereby increasing subregional economic growth and reducing poverty.
5.5
Hydropower Projects in Bhutan
Hydropower stations in Bhutan can be seen as success stories of crossborder energy projects between two friendly neighboring countries. Bhutan has 26 hydropower stations, out of which 4 major hydro plants (Table 10) are crossborder projects. Since the country’s electricity generation is significantly higher than the maximum domestic demand of 130 MW, Bhutan is a net exporter.
5.5.1 Bhutan–India Hydropower Cooperation
The hydropower cooperation between the two neighboring countries started with the signing of the Jaldhaka agreement in 1961. The Jaldhaka hydel is located on the India side of Indo-Bhutan border in West Bengal. The 27 MW Jaldhaka Hydel Power Station Stage-I was commissioned in 1967–1972 and the Stage-II Power House, with an installed capacity of 8 MW was commissioned in 1983. Most of the power produced at Jaldhaka is exported to Southern parts of Bhutan. The benefits of the crossborder energy trade have encouraged Bhutan, which has a hydro potential of over 30,000 MW, to seek Indian investments in setting up power plants.
Table 10: Crossborder Hydropower Projects in Bhutan
Location Financial
Source: Ministry of Power, Government of India.
The India–Bhutan partnership in hydropower effectively started in 1978, when India extended US$200 million for construction of a 336 MW hydroelectric plant at Chukha in Bhutan. The Chukha hydel project was entirely funded by the Government of India with a 60:40 ratio of grant and loan. It was successfully commissioned in 1988, and the project was handed over to the Bhutanese government in 1991. About 70% of power generated from this project is exported to India. India is also helping Bhutan in providing training and human resource development in the power sector.
Apart from Chukha, India has also implemented the Kurichhu and Tala hydropower projects in Bhutan. Looking at the financial benefits of crossborder energy projects, the Royal Government of Bhutan has requested India to develop a 1095 MW hydro plant at Punatsangchhu.19
5.5.2 Tala Hydropower and Transmission Project
The Tala Hydroelectric project is the biggest crossborder power project in South Asia. This 1,020 MW project has been constructed with an investment of around US$1 billion, that is entirely funded by the Government of India (GOI) by way of grants and loans at a 60:40 ratio. Once the project is fully completed, all power from this project will be exported to India. The first phase (170 MW) of this project was commissioned in May 2008.20
19
The Indian Prime Minister laid the foundation stone of this plant during his visit to Bhutan in May 2008.
This project has attracted several public and private sector investors in construction (mostly Indian contractors) such as Bharat Heavy Electrical, Hindustan Construction Company, Larsen and Toubro and Jaiprakash Industries.
20