169
J Trop Soils, Vol. 16, No. 2, 2011: 169-174Coastline Change Surround Sekampung River Estuary Estimated
by Geographic Information System Technique
Fahri and Tamaluddin Syam
Department of Soil Science, Faculty of Agriculture, University of Lampung, Jl. Sumantri Brojonegoro No. 1 Bandarlampung 35145, Indonesia , e-mail: [email protected]
Received 17 December 2009 / accepted 18 September 2010
ABSTRACT
Keywords: Abrasion, accretion, coast land, coastline, estuary
Surround a big river estuary coastline has a dynamic characteristic and change along a period of time, because of a natural process and/or it is accelerated by human activities. The surround Sekampung river estuary coastline located in Rawa Sragi area is one of the most dynamic coastlines in southern Lampung Province that has changed significantly from 1959 (as a natural process) to year 1987 (as an accelerated process by human activities) since the government of Indonesia has applied swamp drainage system for Rawa Sragi area. It is likely that the coastline has changed significantly in the period of 1987 to 2009 (as an increasing intensity of the human activities in the sur-rounding Rawa Sragi land). The objective of this research was to analyze the coastline change in the sursur-rounding of Sekampung river estuary in two periods of time: (1) the change of the 1959 – 1987 period coastlines; and (2) the change of the 1987 – 2009 period coastlines. The method of this research was a GIS technique, the implementation was divided into three main steps: (1) the first analysis was conducted in laboratory include raster data source analysis and registration, coastline digitations, and overlaying and analysis of the coastline data; (2) field observa-tion (ground check) was conducted to observe and verify the ground existing coastline; and (3) the last analysis was conducted after ground check activity to improve and to verify the first coastline analysis results. The result of this research indicated that coastline change in the period of 1959 to 1987 increased the coast land as much as 717.19 hectares, but decreased the coast land as much as 308.51 hectares. Furthermore the coastline change in the period of 1987 to 2009 increased the coast land as much as 162.504 hectares, but decreased the coast land as much as 492.734 hectares. The 1959 – 1987 coastline change was a coast land increasing period, but the 1987 – 2009 coastline change was a coast land decreasing period.
J Trop Soils, Vol. 16, No. 2, 2011: 169-174 ISSN 0852-257X
INTRODUCTION
Surround a big river estuary coastline has a dynamic characteristic (Desaunttes 1977) and change along a period of time because of a natural process and/or it is accelerated by human activities. The surround Sekampung river estuary coastline located in Rawa Sragi area is one of the most dynamic coastlines in southern Lampung Province that has changed significantly from year 1959 (as a natural process) to year 1987 (as an accelerated process by human activities) since the government of Indonesia has applied swamp drainage system for Rawa Sragi area. It is likely that the coastline has changed significantly in the period of 1987 to 2009 (as an increasing of the human activities intensity to the surround Rawa Sragi land).
Administratively the surround Rawa Sragi area land included two register lands status which
register 4 was for production forest land and register 15 was for coast land (as protected area). In 1991, The Forest Minister of Indonesia published a decision letter statement No. 67 Kpts 1991 that allowed changing the register 4 land status of forest production land to be a convertible forest production land, but in the statement there was no statement for the commodity type to be used in the conversion. As followed by Lampung province government regulation in 2001, the register 4 was fully converted to non forest land stated in Lampung Province Regulation No. 6, 2001, but the surr ound Sekampung river estuary register 15 land of 647.6 hectares mangrove area was still stated as a protected area and the people was prohibited to convert the area to be any other land use.
Since 2001, the register 4 land status has been totally changed to be a crops farming system and fish pond la nds by people of the a rea. Unfortunately, the register 15 land has been converted illegally to be fish pond land by them as well.
The conversion of conservation forest or protected forest to be a plantation, fish pond, farming system, harbor, and settlement that have being increased for this time, will affect on degradation of an environment condition such as flooding, landslide, abrasion, erosion, greenhouse effect, fauna and flora distinction, and even climate change (Howard 1991; Soerjani 1997; Radjagukguk 2000). Tarigan (2005) found several abrasion areas in Cisadane coast, Banten Province, which might be due to the effects of human activities and natural phenomena such as, high current and high wave during full moon over that area.
The changes of land status and human activities surround Sekampung river estuary were thought to change significantly the coastline in the two time periods of 1959 to 1987 and 1987 to 2009 because of abrasion and accretion processes along those periods. The coastline change in the two periods would be interesting to be analyzed using GIS technique (Ross et al. 1993; Dahdouh and Guebas 2002).
The GIS technique has some advantages (Lee and Tan 2002; Chan and Wiliamson 1999; Zhu et al. 2001) to analyze the coastline with three data period (map and satellite images) recording (Shalaby and Tateishi 2007; Fahri 2007). Overlaying the three period geographical data in the GIS technique would easily and accurately (Fahri and Muludi 2001) analyze the coastline change. Spatial data analysis in SIG technique would be also flexible (Van Marveine 1993), can be transferred, analyzed and presented into the other compatible program, and the final data can also be stored and updated any time.
The objective of this research was to analyze the coastline change of surround Sekampung river estuary in two periods of time: (1) the coastline change in 1959 to 1987; and (2) the coastline change in 1987 to 2009.
.
MATERIALS AND METHODS
Location
The research was located in Rawa Sragi area, Eastern Lampung Province. Geographic location of the area is in between 105o 40’26" - 105o50’7" East (longitude) and 5o29’52" - 5o 37’50" South (Latitude). Straight distance of the coastline is about 19.36 kilometers.
Materials
The materials used for this research included: (1) a topographic raster map (1959) used for the
starting period coastline analysis; (2) SPOT 20 x 20 meters resolution satellite image (1987) used for the first period coastline change analysis; and (3) Google Earth satellite image (2009) used for the second period coastline change analysis. Field ob-servation main tool used for field obob-servation ac-tivities, was a GPS. A set of computer together with a set of software were used for data process-ing and analysis. The mapinfo program was used in this research as the main software
Methodology
The method of this resea rch was GIS techniques. The implementation of this method was divided into three main execution activities as follows:
The first step analysis was conducted in Land Resource Evaluation and Environment Laboratory, Department of Soil Science, Faculty of Agriculture, University of Lampung. The activities include: - Raster data sources analysis and registration; in
this step, the raster map-base data were analyzed and registered into geographical coordinates in GIS program.
- Land use interpretation and analysis; in this step, the 1959 Rawa Sragi land use was interpreted and analyzed from the 1959 topographic raster map, the 1987 Rawa Sragi land use was interpreted and analyzed from the 1987 SPOT image, and , the 2009 Rawa Sragi land use was interpreted and analyzed from the 2009 Google Earth raster image.
- Land use digitations; in this step, the 1959 land use was digitized from the topographic raster map, the 1987 land use digitized from SPOT raster image and the 2009 land use digitized from Google Earth raster image. The digitations were conduct ed on-scr een in a comput er program .
- Overlaying and analysis of the coastline data include: (1) the 1959 land use and the 1987 land use data were overlaid to analyze the land use change in the first period; and (2) the 1987 land use and the 2009 land use data were overlaid to analyze the land use change in the second period. The second steps were field observation (ground check) was conducted to observe and verify the ground existing land use. The ground check position was based on the land use type which was in every land use type was represented by three points field observation.
J Trop Soils, Vol. 16, No. 2, 2011: 169-174 RESULTS AND DISCUSSION
Coastlines in the Year 1959
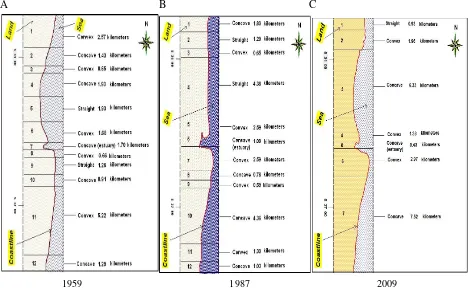
Based on GIS analysis of the 1959 topographic raster map, the surround Sekampung River Estuary coastline could be divided into 12 sequences (Figure 1A). The 12 sequences coastline along 21.23 kilometers, include: (1) 5 convex coast line sequences as long as 10.78 kilometers (50.8%); (2) 5 concave coastline sequences as long as 7.26 kilometers (34.2%); and (3) 2 straight coastline sequences as long as 3.19 kilometers (15.0%). The coastlines were dominated by convex sequence which means that until year 1959 accretion process was more dominant especially along the southern estuary side. Otherwise in the northern side, the coastlines were dominated by concave sequence especially next to the estuary which means in this location abrasion process was more dominant.
Coastlines in the Year 1987
Based on GIS analysis of the 1987 20
×
20 meters resolution SPOT raster image, the surround Sekampung River Estuary coastline can be divided into 12 sequences (Figure 1B). The 12 sequences coastline as long as 21.83 kilometers, include: (1) 5 convex coastline sequences as long as 7.72 kilometers (35.4%); (2) 5 concave coastlinesequences as long as 8.44 kilometers (38.7%); and (3) 2 straight coastline sequences along 5.67 kilometers (25.9%). The concave and convex coastline sequences were almost the same which mean that until 1987 abrasion and accretion processes were almost in balance in this period, and much more accretion process took place in the northern estuary side. It was indicated by straight sequence dominated the coastline especially around the middle part of the northern side. In this location accretion and abrasion processes was being in balance in this period. It was thought that the concave sequence (Figure 1) was deposited by sediments from the river and abrasion process has being started in this location
Coastlines in the Year 2009
Based on GIS analysis of the 2009 Google Earth raster image, the surround Sekampung River Estuary coastline can be divided into 7 sequences (Figure 1C). Coastline as long as 21.50 kilometers, include: (1) 3 convex coastline sequences as long as 6.29 kilometers (29.3%); (2) 3 concave coastline sequences as long as 14.28 kilometers (66.4%); and (3) 1 straight coastline sequence along 0.93 kilometers (4.3%). The coastlines were dominated by concave sequences which mean that until 2009 abrasion process was more dominant along both the southern and northern estuary sides. It indicated that abrasion process have being high level.
Figure 1. Change of coastline sequences in the surrounding Sekampung River estuary in the year 1959, year 1987, and year 2009.
1987
1959 2009
The Coastline Change from Year 1959 to Year 1987
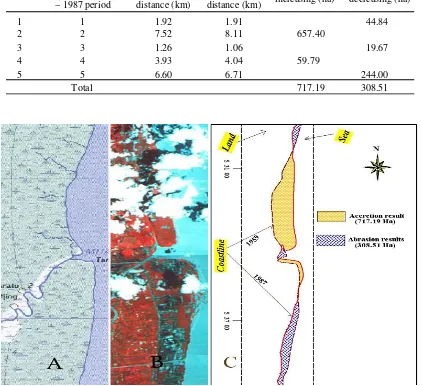
Based on the overlaying analysis of the 1959 Topographic raster map and the 1987 SPOT raster image in GIS technique, the result of the coastline change in the period of 1959 to 1987 is presented in Table 1 and Figure 2. The coastline change resulted in both increasing and decreasing coast lands because of the accretion and abrasion processes. The accretion process increased the coast land as much as 717.19 hectares located dominantly on the northern side next to the estuary and the other little one located on the southern side next to the estuary. Otherwise, the abrasion process decreased the coast land as much as 308.51 hectares
Figure 2. Coastline change of the 1959 – 1987 period surround Sekampung River estuaries. A = coastline on the 1959 topographic raster map, B = coastline on the 1987 SPOT raster image, and C = the coastline change of the 1959 – 1987 periods.
located dominantly on the southern side the estuary and the other little ones located on around estuary and on the north-end side estuary.
It indicated that in this period increasing the coast lands were higher than that of decreasing the coast lands which might be due to much more sedimentation took place in the cost land because of land conversion (register 4) from forest production land became a crops farming system and/ or settlements in the Rawasragi area
The Coastline Change from Year 1987 to 2009
Based on the overlaying analysis of the 1987 SPOT raster image and the 2009 Google Earth raster image in GIS technique, the coastline change in the Table 1. The accretion and abrasion due to the coastline changing in the surrounding of
Sekampung River Estuary in the 1959 – 1987 periods.
No.
Changing Sequences of 1959
– 1987 period
The 1959 Coastline distance (km)
The 1987 Coastline distance (km)
Land increasing (ha)
Land decreasing (ha)
1 1 1.92 1.91 44.84
2 2 7.52 8.11 657.40
3 3 1.26 1.06 19.67
4 4 3.93 4.04 59.79
5 5 6.60 6.71 244.00
J Trop Soils, Vol. 16, No. 2, 2011: 169-174
period of 1987 to 2009 is presented in Table 2 and Figure 3. The coastline change resulted in both increasing and decreasing the coast lands because of the accretion and abrasion processes. The accretion process increased the coast land as much as 162.504 hectares located dominantly on the north-end estuary side and the other little ones located on around estuary and on the separated place southern estuary side. Otherwise, the abrasion process decreased the coast land as much as 492.734
hectares located dominantly along the northern estuary side and the other little ones located on around estuary and on the separated place southern estuary side.
It indicated that in this period decreasing the coast lands were higher than that of increasing the coast lands which might be due to the illegally conversion of the protected land area (register 15) from the mangrove land area became fish pond area by the people along the period of year 1987 to 2009. No.
Changing Sequences of 1987
– 2009 period
The 1987 Coastline distance (km)
The 2009 Coastline distance (km)
Accretion (ha) Abrasion (ha)
1 1 2.52 2.75 65.03
2 2 6.95 7.18 463.20
3 3 1.83 1.03 23.85
4 4 1.34 1.31 19.23
5 5 3.45 3.42 47.47
6 6 1.45 1.51 7.094
7 7 2.67 2.64 24.37
8 8 0.76 0.79 2.332
9 9 0.53 0.52 1.684
10 10 0.33 0.35 0.878
Total 21.83 21.50 162.504 492.734
Table 2. The accretion and abrasion due to the coastline changing in the surrounding of Sekampung River Estuary in the 1987 – 2009 periods
CONCLUSIONS
The coastline in the surrounding Sekampung River Estuary, in 1959 included: (1) 5 convex coastline sequences as long as 10.78 kilometers; (2) 5 concave coastline sequences as long as 7.26 kilometers; and (3) 2 straight coastline sequences as long as 3.19 kilometers, in 1987 include: (1) 5 convex coastline sequences as long as 7.72 kilometers; (2) 5 concave coastline sequences as long as 8.44 kilometers; and (3) 2 straight coastline sequences as long as 5.67 kilometers, and in 2009 include: (1) 5 convex coastline sequences as long as 7.72 kilometers (35.4%); (2) 5 concave coastline sequences as long as 8.44 kilometers (38.7%); and (3) 2 straight coastline sequences as long as 5.67 kilometers.
Until year 1959 accretion process was more dominant especially along the southern estuary side. In 1959 – 1987 period abrasion and accretion were almost in balance, and much more accretion process took place in the northern estuary side. In 1987 – 2009 period abrasion process was more dominant along both the southern and northern estuary sides and abrasion process has being in a high level.
The coastline change in the period of 1959 to 1987 increased the coast land as much as 717.19 hectares, but decreased the coast land as much as 308.51 hectares. The coastline change in the period of 1987 to 2009 increased the coast land as much as 162.504 hectares, but decreased the coast land as much as 492.734 hectares. The 1959 – 1987 coastline change was a coast land increasing period, but the 1987 – 2009 coastline change was a coast land decreasing period.
Based on this research result, it was suggested that the human activities intensity to the lands around Rawasragi area need to be controlled, especially for land use conversion from any land use to be fish pond. The illegally land conversion activities from the register 15 to be fish pond need to be strictly controlled by the related authority Programme of Competition Grant 2009 by Direc-torate General of Higher Education, Republic of Indonesia. The authors are grateful to A Benardo, S.P. to assist in the laboratory.
REFERENCES
Chan TO and IP Wiliamson. 1999. A Model of decision process for GIS adoption and diffusion in a government environment. URISA J 11 (2): 7-16. Dahdouh F and Guebas. 2002.The use of remote sensing and GIS in the sustainable management of tropical coastal ecosystem. Environ Develop Sustain 4: 93-112.
Desaunttes JD. 1977. Catalogue of Landform for Indonesia. Soil Research Institute, Bogor-Indonesia. Fahri and K Muludi. 2001.Tingkat ketelitian delineasi metode analisis manual dan metode analisis sistem informasi geografis dalam pemetaan unit lahan Sub-DAS Way Terusan Hulu, Lampung dengan menggunakan citra satelit.J Trop soils 12: 127-134 (in Indonesian).
Fahri. 2007. Designing A Geographic Information Systems to Support Semi-detail Crop-Land Suitability Evaluation an d Cr op-Lan d Management Decision-making. [Master Thesis] Department of Computer Science and Information Engineering, Asia University, Taiwan. 93 p. Forest Minister. 1991. Decision letter statement No 67
Kpts 1991. Forest Department of Indonesia. Google Earth. June 3rd, 2007. http://earth.google.com/
showcase/index.html.
LG Ross, EA Mendoza QM and MCM Beveridge. 1993. The application of geographical information system to site selection for coastal aquaculture: an example based on salmonid cage culture.
Aquaculture 112: 165-178.
Lampung Province Government. 2001. Lampung Province Regulation No. 6, 2001. Lampung Province.
Howard JA. 1991. Remote Sensing of Forest Resources. Theory and Application. London, New York, Tokyo, Melbourne, Madras: Chapman & Hall, 420 p. Lee LM and TS Tan. 2002. GIS For Plan-Making in
Penang Island: The Road to Online Planing. Online Planing J: 1-27.
Radjagukguk B. 2000. Perubahan sifat-sifat fisik dan kimia tanah gambut akibat reklamasi lahan gambut untuk pertanian. J Ilmu Tanah Lingk 2 (1): 1-15. Shalaby A and R Tateishi. 2007. Remote sensing and GIS for mapping and monitoring land cover and land-use changes in the Northwestern coastal zone of Egypt. Appl Geogr 27: 28–41 pp.
Soerjani M. 1997. Pembangunan dan Lingkungan Meniti Gagasan dan Pelaksan aan Sustain able Development. Jakarta. Masyarakat Perhutanan Indonesia, 135 p (in Indonesian).
Tarigan MS. 2007. Perubahan garis pantai di wilayah pesisir perairan Cisadane, Provinsi Banten. Makara Sains 11 (1):49-55.
Van Marveine M. 1993. Land Information System: Part: Principles. Ghent University. Belgium. 84 p. Zhu AX, B Hudson, J Burt, K Lubich and D Simonson.