T E R R E S T R I A L L A SE R S C A NNE R F O R M O NI T O R I NG T H E D E F O R M A T I O NS A ND
T H E D A M A G E S O F B UI L D I NG S
G. V acca a
, F . Mistretta a
, F . S tochino a
, A . D essi a
a
D IC A A R , D ep. of C ivil and E nvironmental E ngineering and A rchitecture, University of C agliari, P.zza D 'A rmi 09123 C agliari -(vaccag, fmistret)@ unica.it
C ommission V , W G V /3
K E Y W OR D S : 3D modelling, deformations measurements, terrestrial laser scanner
A B S T R A C T :
T he paper presents the use of the terrestrial laser scanner for the study and the assessment of damaged buildings. T he terrestrial laser
scanner provides the ability to detect the geometric 3D model of a building without any physical contact with the structure. K nowledge of the 3D model will give the opportunity to study the deformation and quantify the damages.
T hree case studies are presented relating to damaged and/or unsafe buildings: S ivillier C astle (V illasor - S ardinia- Italy), the B ell T ower of Mores (S ardinia-Italy) and industrial building (C agliari - Italy) .
T he first two cases concern buildings of historical and architectural importance that present a state of compromised conservation; the last, an industrial building compromised by fire. In all cases, a laser scanner survey was carried out that not only provided
valuable information but also highlighted structural metric deformation and degradation.
1. I NT R OD UC T I O N
T he monitoring of building structures have an increasingl y
important role in the engineering field, above all because they
are concerned with the impact that such structures have in the area where they were built. Often, when walking through the
old town centers, we realize just how obselete and dangerous some buildings (even historic-cultural ones) are. T he interest of
some local governments in this problem has led, in the last few years, to the study and the trying out of measuring and
monitoring methods which, quickl y and at low cost, allow to define the extent of the deformation and the degrade in an
accurate and reliable way. T he most frequent cases of monitoring and control can be classified as follows: verification
of the deformation and damage caused by natural calamities (e.g. earthquakes), or malicious (e.g. fires) ; verification of the
degrade caused by weather conditions; verification of the present precarious state of a structure with respect to its initial
project; verification of the result of bad workmanship. T he requirement, therefore, is to identify techniques that are able to
carry out accurate and reliable measuring of structural deformation, and that are easy to obtain and are not too
expensive. Moreover, in case of the unstable buildings, especially if this are historic and cultural buildings, instruments
are required that do not make direct contact with the structure
itself. A mong all the geomatic techniques, that have some of these characteristics, there are the following: measurement with
T otal S tations, measurement with GNS S technology, close range photogrammetry and T errestrial L aser S canning. T here
follows a brief description of these techniques:
1. C lassical survey with T otal S tations is widespread for the
accurate measuring of a li mited number of accessible or inaccessible points. T he drawback of this technique, when used
for monitoring structures, is the long time, above all for complex structures in which a high number of points must be
surveyed in order to obtain accurate information regarding the structure and its deformation.
2.T he Global Navigation S atellite S ystem ( GNS S ) is a
technique that is now usually used to monitor the condition of structures and buildings [ 2-6] , also in combination with other
sensors like accelerometers, or inertial navigation systems [ 11] ;
but this technique can't to use to carry out measurements indoor or in presence of obstruct.
3. D igital close-range photogrammetry has been a low cost alternative [ 15] , and is highly accurate [ 9]. It also offers a quick,
remote, three-dimensional (3D ) data acquisition with images that provide a permanent visual recording of the test. B ut the
compulsory use of targets might be disadvantageous in some circumstances; especially when the access to the object is risky
or even when it is inaccessible to operators. In contrast, the depth dimension could be slightly solved, just avoiding the use
of multiple convergent images.
4. T errestrial laser scanning (T L S ) has become a new alternative
to health monitoring of structures incorporating novelty approaches [ 11] and computer methods [ 13] .
T he approach proposed in this paper is one of studying the potential of T errestrial L aser S canning (T L S ) in terms of
monitoring structures and buildings that have been damaged by natural calamities or by malicious intent. T hree cases were
presented. F irstly, the study of the deformation of some vertical walls of S ivillier C astle ( X V C entury). S econdly, the study of
the verticality of a B ell T ower ( X IX C entury) , 40 m high, and
the degrade of the statue at the top of it. T hirdly, the study of the deformation of a prefabricated structure relative to an industrial
building which had been the object of arson.
2. T E R R E S T R I A L L A S E R S C A NNE R (T L S )
T he scanning of an object, or a building, consists of a series of scansions of the whole building, both internally and externall y.
T he result obtained is a multitude of points which allow for a 3D reconstruction of the object with high accuracy.
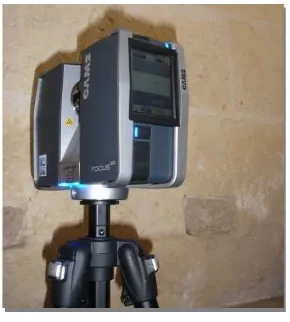
T he F aro 3D laser F ocus (fig. 1) was used in all the cases
studied presented successively. It is a compact scanner
characterized by an operative range that varies between 0.6 m and 120 m with a linear distance error of ±2 mm for scanner-object distances comprised between 10 m and 25 m, and a noise
(that is to say, the standard deviation of the values with respect
to the best-fit plan) which varies from between 0.6 mm and 10 mm with a reflectivity of 90% and 2.2 mm to 25 mm with a
reflectivity of 10%. It has a vertical visual field of 305° and a horizontal one of 360°. T he vertical and horizontal resolution is
0.009°. It has a scanning speed of 976.000 points/sec , and a reduced weight. Incorporated into the laser is a color digital
camera with a resolution of 70 megapixels
T he laser scanning provides a point cloud with a high density
points, each one of them having the coordinates x, y, z, relative to an intrinsic reference system to the instrument and the
reflectivity, which is indicative of the physical characteristics of the surface scanned. B y way of the digital images obtained, the
scansion is completed with R GB information of the object scanned; allowing for the integration of the analyses of the
structure, e.g., those referring to the degrade of the building materials.
2.1 D ata pr ocessing
T he handling and processing of the point cloud was done by
way of the J R C R econstructor S oftware v. 3.1.0 ( 335), of
Gexcel L td. R econstructor is a software that enables the carrying out of all the processing operations of the point cloud
until the 3D model of the structure or building scanned is obtained.
T he processing to which the point cloud was subjected can be synthesized in three phases: pre-processing, pre-alignment and
alignment. Once the scansions of the software have been loaded, they undergo ‘ cleaning’ by way of the application of a
series of algorithms that extract the information needed for the successive phase of data processing. W ith this procedure,
known as pre-processing, operations are carried out which focus on noise reduction, the calculation of the normal vectors, the
determining of the outlines, and the calculation of confidence; values that enable the assessment of the measurement reliability
on each single point. T he scanning accuracy does not only depend on the laser scanner used, but is also conditioned by
such factors as the angle of incidence between the laser belt and the tangent plane at the point, the distance from the point, and
the material of the object on which the laser beam strikes. T he
confidence value is therefore an average weighing of the values of the normal vectors on the surfaces, of the distance and the
reflectivity. D uring the pre-processing phase, the points that go
over the minimum confidence value are discarded. T he point clouds treated in this way are oriented in a relative manner (one
is taken as a reference, while the others are considered mobile); at first, approximately, by way of the matching of natural
features, or targets in two adjacent scannings; then in an accurate manner. In order to carry out this final phase, known as
aligning, the iterative IC P (Iterative C losest Point) algorithm, utilized by R econstructor, searches for control points; that is to
say, it identifies in the point cloud mobile the points that are closest to the same points in the reference point cloud. T he
cloud point mobile is therefore shifted iteratively towards the reference model in order to reduce the distance between the
control points. W hen the processing phase has been concluded, the series of scannings, correctly ‘ squared up’, is geo-referred in
a single system of external reference. T his can be carried out by utilizing natural coordinate targets or points in the external
reference system which can be recognized in the point cloud.
T he calculation of the mesh constitutes the final phase that enables the transformation of the 3D points on a continuous surface. T he derived 3D model, apart from constituting a virtual
prototype of the site scanned, enables the realization of diverse
products. In fact, it is possible to extract vertical and horizontal sections for graphic representation, as well as realize support
orthophotos for the restitution of the graphic outputs.
3. C A S E S S T UD I E D
3.1 S ivillier C astle
S iviller C astle ( fig.2) is one of the most important and representative cultural heritage in S ardinia, with late Gothic
architecture. T he castle was built in 1415 by Giovanni S iviller in the town of V illasor, 30 km from C agliari (Italy) . In 1991, it
was acquired as a cultural heritage by the municipality of V illasor and, after an important restoration, it became a library
and cultural centre for exhibitions and conventions. In the last few years, the castle has been in a very poor state, and the
wooden structures and walls have needed restoration work to halt the progressive decay. A s a part of the study for the
restoration project, the building was scanned with a terrestrial laser scanner. T he scanning provided detailed dimensional
information of the building, and has enabled the study of the structural deformations and damage; in particular, the
deformations of the bearing walls.
T he scanning required an accuracy equal to a restitution scale of 1:50. T o obtain this, 61 scannings were carried out with a
resolution of 7 mm. T hese scannings, superimposed by at least 30%, enabled the realization of a 3D reconstruction of the
castle, avoid of holes and with the accuracy required [ 18] . Of these 61 scannings, 3 were carried out using an airborne
platform ( fig. 3), with the aim of scanning the whole roof, while the remaining scannings were carried out from the ground. T he
airborne platform used consisted of a hydraulically controlled basket mounted on a truck. T he scanner was positioned on the
basket, and two operators lifted 15 m from the ground. T o avoid harmful vibrations of the basket, that could have compromised
the scannings, the following precautions were taken: truck engine and lifting motor turned off, operators quite still, and
lack of wind. T he scannings were processed by way of the software R econstructor, as described in paragraph 2.2.
F igure 1: F ocus 3D L aser scanner
T he 3D model, obtained in this manner, was geo-referred in the E T R F 2000, by way of utilizing natural points located in the
external perimeter of the castle. T he points were surveyed by way of GNSS in modality R T K ; using the differential
corrections from the permanent S A R NE T stations
(http://www.geodesia.biz/sarnet/) in S ardinia. A fter laser scanning, and the following reali zation of the 3D model, it was possible to study the geometrical and structural characteristics
of the castle. In particular, the deformation of the castle walls
with respect to the vertical plane [ 7]. In fact, as can be seen in fig. 4, the vertical walls are completely out of plumb. T he study
of the verticality and deformations of the walls was carried out internally with R econstructor software. F irst, a plane containing
the Z axis was generated ( vertical) , successively, identified the two extreme points of the facade (determined from the
intersection between the plane of the facade and the horizontal one), and positioned according to the latter, the vertical plane
was shifted and rotated around the Z axis until it contained these two points. Having defined the vertical plane of the facade in
this way, the distances between the points of this plane and those of the real wall were calculated, and finally the contour
line of such distances were generated, with equidistance equal to 1 cm. W ith A rcGIS (E S R I) software, and starting from the
contour line, the grid of the D igital Model of the Surface (D SM) was generated, with 2 cm pixel, and successively classified in
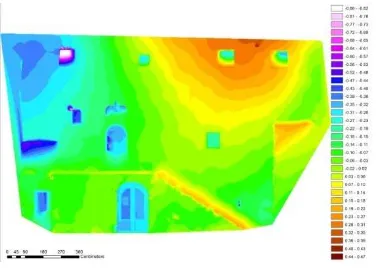
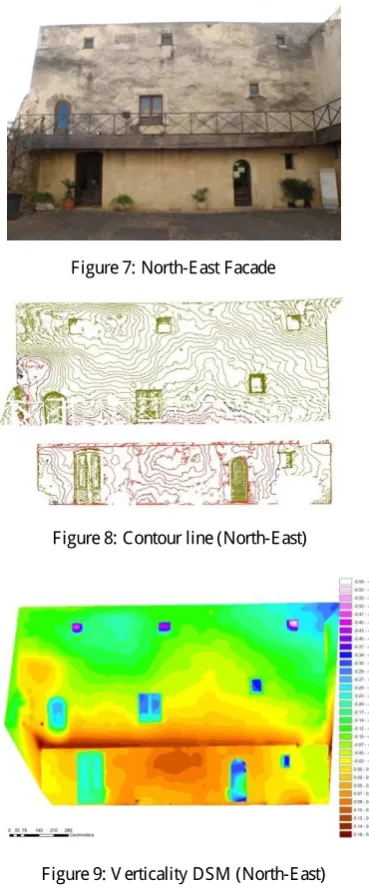
order to obtain the verticality map of the wall. T he paper reports only the study of two walls – North-W est and North-E ast. T he
image of the North-W est facade is shown in fig. 4, 5 and 6 instead, respectively show the contour line of the distances of
the real wall – vertical plane and D SM of the verticality for the internal wall of the courtyard. In fig. 7, 8 and 9 are shown the
same study for the North-E ast wall. In both cases, as can be
inferred from the verticality D S M, the walls have a geometrical pattern which is completely different and anomalous with
respect to the vertical plane, and little inclined towards any structural geometrical plan. T he North-W est wall has a part, at
the top on the right, which is completely out of plumb, with a difference of as much as 40 cm from the vertical plane. T he
same can be said of the rest and greater part of the wall with, even in this case, receding displacements of 40 cm from the
vertical plane. R egarding the North-E ast wall is concerned, the situation is similar, even if the pattern is completely different.
T he higher part has receding displacements from the vertical plane of up to 35 cm, while the lower part is out of plumb by up
to 15 cm. In fig. 5 and 8, the green contour line represent the receding part; the red, the out of plumb; the black, the
intersection of the vertical plane with the wall in question. F igure 2: S ivillier C astle
F igure 3: A irbone platform survey
F igure 4: North-W est F acade
F igure 5: C ontour line ( North-W est)
F igure 6: V erticality D S M (North-W est)
3.2 T he B ell T ower in M or es
T he church bell tower of S anta C aterina, built in 1871 by the
architect S alvatore C alvia Unali , is the highest bell tower in S ardinia (about 40 m), and is considered the finest example of
neo-classic architecture in S ardinia. Of particular interest are the five terracotta statues of the four E vangelists and C hrist the
R edeemer. Over the last few years, these statues have shown a high level of deterioration. T his situation convinced the
Municipality of Mores that it was necessary to undertake a study for a project (involving structural engineers, geomaticians
and geo-technicians) of proper restoration of the statues, as well as parts of the bell tower itself. In particular, an accurate
scanning was requested. Moreover, the determining of the exact
height of the bell tower and any out of plumb of it was requested. In order to carry out a complete scanning of the structure, given the considerable height of it, a L iebherr
motorized crane, complete with an extendible ( up to 60 m)
telescopic arm, was used. A laser scanner (fig. 10) was mounted on the crane arm. B y operating the laser with a computerized
remote control, all the parts of the bell tower were scanned at a distance of no more than 10 m, which allowed for laser ray
inclinations which were not too high. T he scannings were
carried out in the absence of wind and with the crane engine turned off to avoid any vibrations that would have disturbed the
scanning. A total of 93 scannings were carried out, both internally and externally, with a resolution of 7 mm. T he
scanning of the statues was carried out with a resolution of 3 mm, and the laser positioned at a distance of 5 metres.
Moreover, the scanning operation had been planned in such a way as to guarantee the superimposition among the scannings of
at least 30% .
W ith the R econstructor software, the point clouds was initially
pre-processed and successively, utilizing exclusively natural features (at least 5 for each pair of scannings), the point clouds
were pre-aligned, and then aligned with an error margin inferior to one centimetre.
T he geo-referring of the point clouds was carried out in the E T R 2000 system, by way of signals which were distributed at
ground level, and which were surveyed during the scannings. It
was not possible to insert targets along the height of the bell tower because there were no buildings around it of a similar height. T he coordinates of the points at ground level were
determined by way of a GPS scanning, in R T K modality. A lso
in this case, the S A R NE T network of permanent stations was used; the network transmitting the differential corrections via
Internet in the E T R F 2000 reference system.
F or the graphical reconstruction of the statue of C hrist the
R edeemer a contour level restitution, with an equidistance equal to 10 cm, was carried out (fig. 11) . A classi cal restitution was
also carried out, in which all the cracks and deterioration present in the statues were made evident.
T he creation of the 3D model enabled the carrying out of analyses aimed at determining the heights of the bell tower and
the statue of C hrist the R edeemer, establishing the global geometrical arrangement of the structure and, in particular,
assessing the out of plumb respect of its barycentric axis. A s far as the bell tower is concerned, its height was measured between
the external floor area and the base of the statue, and the result was 36.32 m. T he height of the statue, measured between its
base and the highest point of its halo, was 3.46 m.
T he criterion adopted to assess the out of plumb of the
barycentric axis of the bell tower was that of measuring the barycentric displacement of the sections from the vertical axis
and passing through to the barycenters of the base [9] . F rom the
3D model, was extracted one horizontal section for each meter of height, starting from a measurement of 5 m (base section),
thus excluding the part of the bell tower that is connected to church of S anta C aterina. T he adjective “Ideal” was attributed
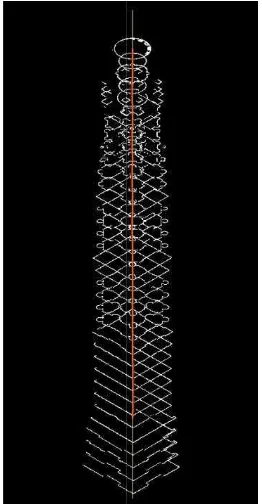
to all the intersection points of the vertical with the different sections. T he pattern of the barycenters of the sections did not
diverge very much from that of the vertical, with values of the distance between the ideal point and the real barycenter
oscillating between 0.086 m and 0.002 m. F igure 12 shows the pattern overall barycenter curve (in red) with respect to the
vertical (in yellow) and figure 13 shows the planimetrical barycentric dispersion of the various sections with respect to the
ideal position. F igure 9: V erticality D S M (North-E ast)
F igure 8: C ontour line ( North-E ast) F igure 7: North-E ast F acade
F igure 10: T he B ell T ower
F igure 11: R edeemer statue graphic output
3.3 I ndustr ial building
T he last case is that of an industrial
structure was partly damaged by a fire. T he effects of extreme actions like blast load or fire is the subject of a current research
trend ( see for example [ 4] [ 5] [ 6] [ 8] ), and the information obtained from a geomatic survey can be of paramount relevance
in the structural analysis [ 2] [ 3] . T he B ell T ower
R edeemer statue graphic output
F igure 12: Position of the barycentre vertical axis
F igura 13: Planimetrical barycentric dispersion
T he last case is that of an industrial building ( F ig. 14) whose
structure was partly damaged by a fire. T he effects of extreme actions like blast load or fire is the subject of a current research
trend ( see for example [ 4] [ 5] [ 6] [ 8] ), and the information obtained from a geomatic survey can be of paramount relevance arycentre curve (red) respect to the vertical axis ( yellow)
: Planimetrical barycentric dispersion
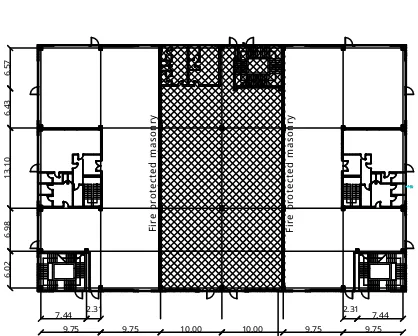
T he structural assessments of this building have been presented in [ 1] . T he building is prefabricated and characterized by a
rectangular structured plan, with a width of 40,00 m and a length of 60,00 m. T he building has two floors above ground: the
ground floor, approximately 6,00 m high from the floor slab, is subdivided into three parts with the same surface area; of which,
only one was directl y damaged by the fire. T he first floor, approximately 3,50 m high from the floor slab, which is not
subdivided.
T he building has a reinforced concrete load-bearing structure consisting of columns with rectangular cross section, precasted
and prestressed beams with T shaped cross section which
controlled; something that would have been impossible using
traditional measuring methods, especially in this case in which the scanning difficulties are worsened by the deteriorated state of
the structure.
In order to work on the laser scanning project, one had to consider the precision requested for the study of the
deformations of the load-bearing structure of the building that had to be sub-centimetres in exactness. T o this end, 19
scannings were carried out with a resolution of 7 mm. T he scanning was carried out by positioning the instrument beneath
the centre lines of the longitudinal and transversal beams of the the orthophotos relative to the structural elements being studied.
A s far as the study of the columns (with a total height of 6 m and rectangular cross section) damaged by the fire are
concerned, the focus was on the variation of the centre of gravity position after the fire.
F or the sake of clarity, the structural elements subjected to fire were labeled as shown in figure 16. In order to find the position
of the centre of gravity, after the fire, of the six central columns (labelled 4 to 9, see F igure 15), their geometry was recorded by
the laser scanner after the fire. Obviously damage is also present on these four sections at different heights (see fig. 17 and fig.
18) . T he bottom and top ends of each column were not exposed to fire, and so their deformation is negligible.
F igure 14: Industrial building
F igure 15: Z one interested by fire at the ground floor
F igure 16: S tructural elements scheme
T he variation of the centre of gravity position through the
column height is reported in fig. 18. L ooking at this picture, it is clear that the variations of the centre of gravity position are
localized in the central part of the column (S ection 2 and S ection 3), this confirms the hypothesis of the each column
having a constrained end. S ome lateral columns, like C olumn 6, were dramaticall y dug during the fire and present important
cross section reduction on the fire exposed side; instead, the other side presents negligible damage. T he central C olumn 5
and C olumn 8, exposed on the whole perimeter, present very few centre of gravity positional variations: less than 10 mm in
the latter case and less than 5 in the former.
T he fire also damaged the ceili ng of the ground floor which
consists of transversal T -shaped beams (labeled with T code in F ig. 16) simply supported directly by the columns and by the
longitudinal omega-shaped beams (labeled with L code in F igure 15), supported by the above mentioned T -shaped beams.
T he maximum deflection recorded ( F ig. 18) for each beam is reported in T able 1. T he negative sign indicates upward
deflection, while the positive one refers to downward deflection. T he higher negati ve deflections for T -shaped beams
(corresponding to code T , see F igure 15) are located in the right
side of the plant ( beams T 2-T 4-T 6) while the other beams ( T 1-T 3-1-T 5-1-T 7-1-T 9) present a positive one ( see F igure 16). In order to
explain these results it must be highlighted that each beam is designed with a negative deflection due to the prestressing
tendons. So, in some cases the local damages due to fire were so high to invert the sign of the deflection, in the other cases the
negative deflection has survived to fire. T he longitudinal omega-shaped beams (corresponding to label L , see F igure 16)
present high deflections in the bottom part of the plant (see F igure 16) . In particular beam labeled L 4 has a maximum
deflection of 74.23 mm corresponding to 6/1000 of the span. T his results proves that the fire effect in addition to the dead
load of the structure has neglected the initial negative deflection (equal to 25-30 mm, see the undamaged beams labeled L a and
L b, present in all L -beams) , only in several damaged elements.
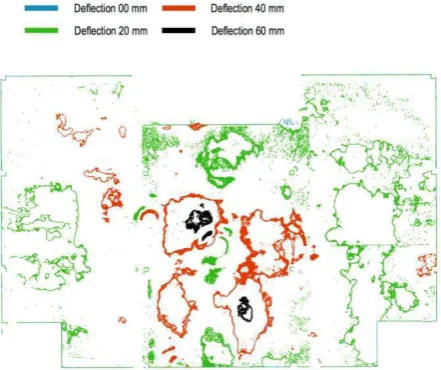
T he first floor slab deflection was also investigated by means of L aser S canner and the result is reported in figure 20. In order to
assess the deflections caused by the fire, the R econstructor software was utilized, which generated a horizontal plan passing
through an attachment point between the beam and the column not deformed by the fire and, from this, was calculated the
deflections with respect to the multitude of points scanned by the laser scanner. S uccessively, the level curves of the
deflections were generated. T he maximum recorded deflection was 60 mm. It is located on the left side and in the bottom part
of the fired zone. V isible cracks are not present in the extrados, and the unique sign of the fire is the floor discolouration.
B eam L ( m) rv
( mm) L 1 12.28 72.84 L 2 12.29 -2.30 L 3 12.25 -1.69 L 4 12.23 74.23 L 5 12.26 25.17 L 7 12.21 -24.31 L 8 12.26 -7.10 L 9 12.25 -6.05 L 10 12.22 -12.54 L 11 12.30 -14.69 L 12 12.24 -20.09 L 13 11.85 -23.74 L 14 11.92 -18.57 L 15 11.89 -12.94 L 16 12.25 -23.58 L 17 5.57 -12.74 L 18 5.67 10.76 L a 12.23 -27.71 L b 12.25 -20.03 T 1 9.20 5.68 T 2 9.33 -28.47 T 3 9.35 1.81 T 4 9.35 -4.99 T 5 9.35 18.13 T 6 9.35 -10.35 T 7 9.33 9.63 T 9 6.84 0.15 S e c t io n 1 - 1 . 0 m
S e c t io n 2 - 3 . 2 m S e c t io n 3 - 3 . 6 m
S e c t i on 4 - 5 . 2 m
F igure 17: S cheme of the column cross-section center
of gravity detection
F igure 19: A t the right the beam section, at the left the beam span (L ) and the deflection (rv) for every beam
F igure 18: C entre of gravity position of columns cross section
at different heights
T he accurate study of the deformation of the structural elements allowed the assessment of the costs involved in the
refurbishment in a much more effective way than the traditional
methods used in such cases
4. C ONC L US I ON
T he work here presented has looked into and tested the utilization of the terrestrial laser scanner for the monitoring of
structures and/or complex buildings. T he cases presented have highlighted the advantages and disadvantages of utilizing a
scanning technique of this type. In particular, it is important to
points that a more traditional type of scanning might have.
A mong the disadvantages, we can enumerate: the complex
nature of data processing; the difficulty in extracting plans and sections from the 3D model in an automatic manner and without
the intervention of an operator. W ithout doubt the utilization of T L S , for these purposes, offers far more margins for
improvement that enable the speeding up of data processing operations and data extraction; as shown in this document.
R E F E R E NC E S
1. F . S egni Pulvirenti, A . S ari, 1994, Architettura tardogotica
e d'influsso rinascimentale. E d. Ilisso, 2
F igure 20: F irst floor slab deflection
he structural elements the assessment of the costs involved in the
refurbishment in a much more effective way than the traditional
T he work here presented has looked into and tested the errestrial laser scanner for the monitoring of
T he cases presented have highlighted the advantages and disadvantages of utilizing a
In particular, it is important to
T he utilization of the T S L for the monitoring of structures destructive, and one which
provides the geometry of a building or structure (form and dimensions) , even if the latter are inaccessible.
ity of having highly accurate 3D models allows for the study of structural deformations in a very reliable and
gives the opportunity to attentively evaluate the interventions needed in order to restore a structure sections from the 3D model in an automatic manner and without
W ithout doubt the utilization of
concrete beams under impulsive loads accounting for strain
rate effects, Nuclear E ngineering and D esign 86.
5. S . T attoni, F . S tochino, F . C aldar, 2013.
approach to serviceability assessment of reinforced
concrete structures in fire, C ivil
6. G. C arta , F . S tochino, 2013. T heoretical models to predict
the flexural failure of reinforced concrete beams under blast loads, E ngineering Structures
7. M. D eidda, A . D essi, M. Marras, G. V acca, 2012;
scanner survey to cultural heritage conservation and restoration, Int. Arch. P hotogramm.
Inf. Sci., X X X IX -B 5, 589-594,
8. M. A cito, F . S tochino, S .
response and reliability analysis of R C beam subjected to explosive loading, Applied Mechanics and Materials
pp. 434-439.
emblematic monument from terrestrial laser scanner, Nondestructive T esting and E valuation
11. H.S . Park, H.M. L ee, H. A deli,I. L ee,
approach for health monitoring of structures: terrestrial
laser scanning,C omput. Aided C ivil Infra 12. A dami, F . Guerra, P. V ernier, 2007.
architectural accuracy text.
Symposium, 01-06 October 2007, A thens,
13. S .J . Gordon, D .D . L ichti, 2007.
scanner data for precise structural deformation
measurement, J . Surv. E ng. 133, pp. 72
14. G. R oberts, C . B rown, X . Meng,
monitoring: tracking milli meters across the
GPS World, pp. 26–31.
15. P. A rias, J . Herraez, H. L orenzo, and C . Ordon˜ez,
C ontrol of structural problems in cultural heritage monuments using close-range photogrammetry and
computer methods, C omput. Struct
16. T h. K ersten, H. S tenberg, E . S tiemer, 2005
with terrestrial L aser S canning for indoor cultural heritage applications using two different scanning system.
Proceedings of the ISPRS “Panoramic Photogrammetry Workshop” B erlin, Germany, 24
X X V I, Part 5/W 8
17. D . B arber, J . Mills, P. B ryan, 2004.
specification for terrestrial laser scanning of cultural heritage -one year on. ISPRS, International Archives of
Photogrammetry and Remote Sensing, C ommission V , ISPRS X X C ongress, Istanbul, T urchia.
18. L . B ornaz, F . R inaudo, 2004. T errestrial laser scanner data Processing. International Archives of Photogrammetry and
Remote Sensing, ISPRS. X X C ongress F irst floor slab deflection
F . S tochino, A . C azzani, S . Poppi, E . T urco, 2015. S ardinia R adio T elescope finite element model updating by means
of photogrammetric measurements, Mathematics and
, A . C ausin, A . C azzani, S . Poppi, G. S anna, M.
S olci, F . S tochino, E . T urco, 2015, T he S ardinia R adio T elescope: a comparison between close range
ogrammetry and fem models, Mathematics and
. S D OF models for reinforced concrete beams under impulsive loads accounting for strain
Nuclear E ngineering and D esign, 276, pp.
74-S . T attoni, F . 74-S tochino, F . C aldar, 2013. A si mplified approach to serviceability assessment of reinforced
C ivil-C omp P roceedings, 102. G. C arta , F . S tochino, 2013. T heoretical models to predict
reinforced concrete beams under E ngineering Structures, 49, pp. 306-315.
M. D eidda, A . D essi, M. Marras, G. V acca, 2012; L aser
scanner survey to cultural heritage conservation and Arch. P hotogramm. Remote Sens. Spatial
594,
S . T attoni, 2011. S tructural
response and reliability analysis of R C beam subjected to Applied Mechanics and Materials, 82,
E . B ertacchini, E . B oni, A . C apra, C . C astagnetti, M.
emblematic monument from terrestrial laser scanner, Nondestructive T esting and E valuation, 23:4, 301-315,
H.S . Park, H.M. L ee, H. A deli,I. L ee, 2007 A new ach for health monitoring of structures: terrestrial
Aided C ivil Infra.. E ng. 22,19–30. A dami, F . Guerra, P. V ernier, 2007. L aser scanner and
architectural accuracy text. X X I International C IPA 06 October 2007, A thens, Greece.
2007. Modeling terrestrial laser scanner data for precise structural deformation
133, pp. 72–80.
G. R oberts, C . B rown, X . Meng, 2006 B ridge deflection monitoring: tracking milli meters across the firth of forth,
P. A rias, J . Herraez, H. L orenzo, and C . Ordon˜ez,2005.
C ontrol of structural problems in cultural heritage range photogrammetry and
C omput. Struct. J . 83, pp. 1754–1766. K ersten, H. S tenberg, E . S tiemer, 2005. E xperiences
with terrestrial L aser S canning for indoor cultural heritage applications using two different scanning system.
Proceedings of the ISPRS “Panoramic Photogrammetry ” B erlin, Germany, 24-25/03/2005 IA PR S, V ol.
D . B arber, J . Mills, P. B ryan, 2004. T owards a standard
specification for terrestrial laser scanning of cultural ISPRS, International Archives of