p-
ISSN 2622-2027
e-
ISSN 2622-2035
24|TiBuana, Vol. 01, No. 1, 2018
ANALYSIS OF LOSS WATER ON PIPE DISTRIBUTION ”NON REVENUE WATER
(NRW)” NETWORK PDAM SURYA SEMBADA CITY OF SURABAYA WITH
CAUSAL LOOP DIAGRAM (CLD)
Yanatra Budi Pramana*) *)
Industrial Engineering Department, Faculty of Industrial Technology University of PGRI AdiBuana Surabaya
Email : [email protected]
Abstract
Water is an important supporting factor in humanlife. The problem of clean water in an area is managed by Perusahaan Daerah Air Minum (PDAM) Surabaya. PDAM Surya Sembada as a water management company in Surabaya is expected to be able to distributethe needs of clean water, however, in the distribution network, sometimes experiencing problems that cause water is not fully channeled to the customer, to overcome
this problem, the Causal Loop Diagram
approach is used to identify the cause of the water loss,after knowing these factors, we have
been made model with Causal Loop model,to
calculate the water loss that occurred, in PDAM Surya Sembada Surabaya especially DMA 109 using Infrastructure Leakage Index
(ILI) method. The Causal Loop Diagram
approach, various causes of water loss include: physical water loss caused by reservoir leakage, transmission line leakage and distribution pipeline leakage; non physical water loss caused by meter fault, wild connection and water theft. Based on the data obtained, obtained NRW value at DMA 109 of
439.455.72 m3 / year or by 25% with a loss of
329.591.8 m3 / year. Service pipe leakage up to
the customer meter is 1.757.822.8 m3 / year.
Keywords:Causal Loop Diagram, Distribution Network Pipeline, Infrastructure Leakage Index (ILI), Water Loss
1. Introduction
Clean water is an important supporting factor for human survival. The need for raw water for various purposes, especially clean water for households, public places, industries and others will continue to increase from time
to time in line with the pace of development in various sectors and fields and the number of population continues to grow, expected to be able to distribute and meet the needs of clean water community well and evenly with the existing pipeline distribution system, if the distribution system is not good enough, will cause various problems such as lack of water pressure so that the flow of water is not distributed evenly. Efforts to reduce the level of water leak can be done by first monitoring the condition of water that is distributed, both cubic water and pressure.
Monitoring efforts will be easier and more accurate if done in a small area, in other words divide the vast area into small parts. To maintain water availability, PDAM utilizes technology by building District Meter Area (DMA) and renewal of old pipes that reduce pipe leakage. Technology is the latest knowledge of knowledge and practice skills in the production of consumption and distribution of products and services in the development process(Suwarno and Nurcahyanie, 2007).
Umar et al., 2014, discusses the distribution system in predicting the magnitude and location of the leak using only one input data, namely pressure and using the method of Extreme Learning Machine. While in research writer use more than one input data and use method of Infrastructure Leakage Index (ILI). Ardiansyah et al., 2005 discussed about the water distribution performance system by entering different data with data presented by the author with different processing also.
TiBuana, Vol. 01, No. 1, 2018| 25 it.
2. Methods
This research was conducted at PDAM Surya Sembada Kota Surabaya. The method used in this research is Causal Loop Diagram
approach. Data were analyzed by Causal Loop Diagram (CLD) approach and Infrastructure Leakage Index (ILI) method with the following steps:
Start
Data collection Reference
SecondaryData
• Number of
customers
• Age of the pipe
• Water sold • Official
consumptionof accounts
Data Primer
• Data on water usage
patterns
• Average pressure
• debit Data • Total usage • Accuracy meter
Data processing
Preparation of Control programs
NRW
• Official Legal Consumption
• OfficialUnofficial Consumption
• Non Physical Loss (Komersil)
• Physical Loss (Teknis)
Calculation Infrastructure Leakage Index (ILI)
ILI = CAPL/MAAPL
ILI = Infrastructure Leakage Index CAPL = Current Annual Physical Losses
MAAPL = Minimum Achievable Annual Physical Losses
Result and Discussion
p-
ISSN 2622-2027
e-
ISSN 2622-2035
26|TiBuana, Vol. 01, No. 1, 2018
Figure 1. Flowchart model 1. Causal Loop
To search and investigate the location of sources of water loss in terms of initiative taking is as follows :
1. Passive investigation 2. Active investigation
Experiment to detect and measure include:
1. Pressure Control 2. Zone Metering 3. Distrik Metering 4. Waste Metering 5. Calculate MAAPL
6. Calculate CAPL
7. Calculate ILI (CAPL/MAAPL) 8. Adjustment For Intermittent Supply
9. Sounding regulary
10. Compare ILI with matrix study physical loss.
3. Result and discussion
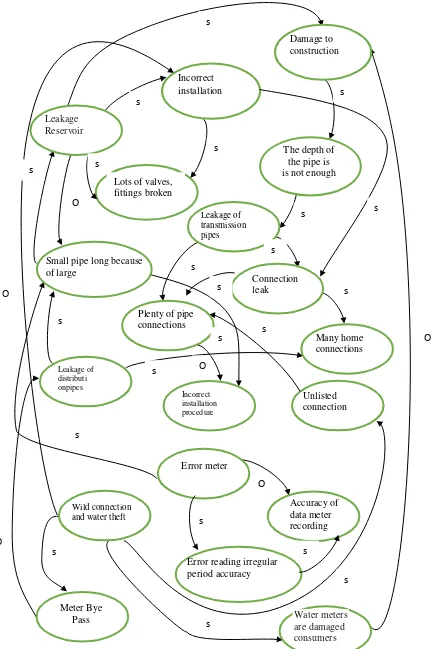
A. Causal Loop Diagram
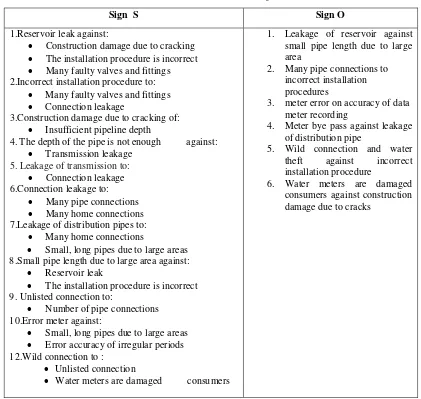
the modeling of causal relationship or marked "S" and "O" can be seen in the table below
Table 1.The Power of Causal Relationships
Sign S Sign O
1.Reservoir leak against:
• Construction damage due to cracking • The installation procedure is incorrect • Many faulty valves and fittings 2.Incorrect installation procedure to:
• Many faulty valves and fittings • Connection leakage
3.Construction damage due to cracking of: • Insufficient pipeline depth
4. The depth of the pipe is not enough against: • Transmission leakage
5. Leakage of transmission to: • Connection leakage 6.Connection leakage to:
• Many pipe connections • Many home connections 7.Leakage of distribution pipes to:
• Many home connections
• Small, long pipes due to large areas 8.Small pipe length due to large area against:
• Reservoir leak
• The installation procedure is incorrect 9. Unlisted connection to:
• Number of pipe connections 10.Error meter against:
• Small, long pipes due to large areas • Error accuracy of irregular periods 12.Wild connection to :
• Unlisted connection
• Water meters are damaged consumers
1. Leakage of reservoir against small pipe length due to large area
2. Many pipe connections to incorrect installation procedures
3. meter error on accuracy of data meter recording
4. Meter bye pass against leakage of distribution pipe
5. Wild connection and water theft against incorrect installation procedure
TiBuana, Vol. 01, No. 1, 2018| 27 Figure 2. Causal Loop Diagram
Lots of valves, fittings broken
Plenty of pipe connections
Damage to construction
Incorrect installation
Leakage Reservoir
The depth of the pipe is is not enough
Leakage of transmission pipes
Many home connections
Leakage of distributi onpipes
Incorrect installation procedure
Unlisted connection
Error meter
Wild connection and water theft
Accuracy of data meter recording
Error reading irregular period accuracy
Meter Bye
Pass Water meters
are damaged consumers
Small pipe long because of large
Connection leak s
s
s
s
s s
s
s
s
s
s
s
s
s s
s
s
s
s
s
s s
O
O O
O O
p-
ISSN 2622-2027
e-
ISSN 2622-2035
28|TiBuana, Vol. 01, No. 1, 2018 B. Data Water discharge
Table 2.Data water discharge
DMA Month
Year 2016
TOTAL CUSTOMERS
USE ACCOUNTS
(m3)
109 JANUARY 3.310.00 111.127.00
FEBRUARY 3.313.00 109.764.00
MARCH 3.316.00 110.824.00
APRIL 3.320.00 106.812.00
MAY 3.322.00 108.315.00
JUNE 3.325.00 114.518.00
JULY 3.323.00 102.522.00
AUGUST 3.329.00 116.437.00
SEPTEMBER 3.335.00 100.608.00
OKTOBER 3.337.00 107.524.00
NOVEMBER 3.338.00 116.583.00
DECEMBER 3.339.00 113.333.00
TOTAL 39.907.00 1.318,367.00
Average 3.325.58 109.863.3
(Source : PDAM Surya Sembada Surabaya city)
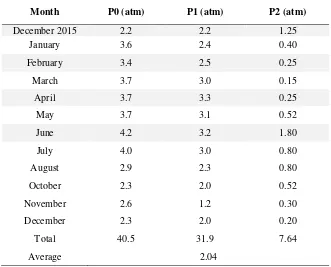
C. Pressure Data
Tabel 3.Pressure on PDAM Surya Sembada Surabaya city
Month P0 (atm) P1 (atm) P2 (atm)
December 2015 2.2 2.2 1.25
January 3.6 2.4 0.40
February 3.4 2.5 0.25
March 3.7 3.0 0.15
April 3.7 3.3 0.25
May 3.7 3.1 0.52
June 4.2 3.2 1.80
July 4.0 3.0 0.80
August 2.9 2.3 0.80
October 2.3 2.0 0.52
November 2.6 1.2 0.30
December 2.3 2.0 0.20
Total 40.5 31.9 7.64
TiBuana, Vol. 01, No. 1, 2018| 29 P0 = pressure at the beginning
P1= pressure at the middle P2= pressure at the end
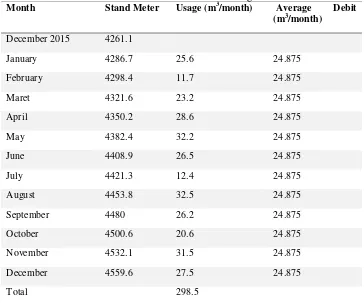
D. Pattern Data water usage
Table4.Pattren usage water
Month Stand Meter
December 2015 4261.1
January 4286.7
February 4298.4
March 4321.6
April 4350.2
May 4382.4
June 4408.9
July 4421.3
August 4453.8
September 4480
October 4500,6
November 4532.1
December 4559.6
(Source : PDAM Surya Sembada Surabaya city) E. Data Accuracy in Meter
From the average customer as much as 3.325.58 or 3.326 home connections obtained the amount of the difference (liter) measuring
glass that is 663.2 liters. This meter accuracy data will be used to calculate the percent value of water loss from customer meter.
F. Data water distribution
Table 5. Water Distribusion Total distribution of
water (m3/month)
Jumlah air recordedin bill accounts
(m3/ month)
GAP / difference (m3/ month)
146.485.24 109.863.93 36.621.31
(Source : PDAM Surya Sembada Surabaya city ) With reference to the table of water usage
patterns, then obtained the following calculation which will then be used to
p-
ISSN 2622-2027
e-
ISSN 2622-2035
30|TiBuana, Vol. 01, No. 1, 2018
Table 6. Calculation Pattern usage of water
Month Stand Meter Usage (m3/month) Average Debit
(m3/month)
December 2015 4261.1
January 4286.7 25.6 24.875
February 4298.4 11.7 24.875
Maret 4321.6 23.2 24.875
April 4350.2 28.6 24.875
May 4382.4 32.2 24.875
June 4408.9 26.5 24.875
July 4421.3 12.4 24.875
August 4453.8 32.5 24.875
September 4480 26.2 24.875
October 4500.6 20.6 24.875
November 4532.1 31.5 24.875
December 4559.6 27.5 24.875
Total 298.5
(Source : Data research, 2017)
Calculation of water usage in 1 month with water meter reading ratio:
= First Stand Meter – End Stand Meter
= 4286.7 – 4261.1 = 25.6 m3/ month
calculation Q average : Q = 𝑎𝑎𝑎𝑎𝑎𝑎𝑎𝑎𝑎𝑎𝑎𝑎 𝑎𝑎𝑜𝑜𝑤𝑤𝑎𝑎𝑎𝑎𝑤𝑤𝑤𝑤
𝑎𝑎𝑎𝑎𝑎𝑎𝑎𝑎𝑎𝑎𝑎𝑎 𝑎𝑎𝑜𝑜𝑑𝑑𝑎𝑎𝑎𝑎𝑎𝑎 = 298,5
12 =
24.875
𝑇𝑇𝑎𝑎𝑎𝑎𝑎𝑎𝑇𝑇𝑑𝑑𝑑𝑑𝑜𝑜𝑜𝑜𝑤𝑤𝑤𝑤𝑤𝑤𝑎𝑎𝑑𝑑𝑤𝑤𝑎𝑎𝑜𝑜𝑎𝑎𝑎𝑎𝑎𝑎𝑛𝑛𝑤𝑤𝑤𝑤𝑤𝑤𝑎𝑎𝑎𝑎𝑤𝑤𝑤𝑤" 𝑎𝑎𝑤𝑤𝑎𝑎𝑤𝑤𝑤𝑤"
𝑎𝑎𝑎𝑎𝑎𝑎𝑎𝑎𝑎𝑎𝑎𝑎𝑠𝑠𝑎𝑎𝑎𝑎𝑠𝑠𝑇𝑇𝑤𝑤 𝑥𝑥 100%
With reference to the distribution table, we can calculate percent
water loss, calculated based on the following Tornton formula :
𝐻𝐻=𝐷𝐷 − 𝐾𝐾
𝐷𝐷 𝑥𝑥 100%
D = 146.485.24 m3/month x 12 = 1.757.822.88 m3/year K = 109.863.93 m3/year x 12 = 1.318.367.16 m3/year
𝐻𝐻
=1.757.822.88 −1.318.367.16
1.757.822.88 𝑥𝑥 100%
𝐻𝐻= 439.455.72
1.757.822.88 𝑥𝑥 100%
= 25%
Leakage in m3 = 25% x 1.757.822.88 m3 = 439.455.72 m3/year
= 36.621.31 m3/month
= 1.220.7 m3/day
Calculates the percent value of water loss from the customer “meter”
663.2
3.326 𝑥𝑥 100% = 19%
Total water distribution =146.485.24 m3
From lost water in “meter” distribusion customer and amount water distribution, we can calculation lost water:
146.485.24 x 19% = 27.832.2 m3/month = 333.986.4 m3/year
Calculation of lost water in “ rupiah”
The total price of water sold is
= Rp. 184,131,946.68 m3/month=
TiBuana, Vol. 01, No. 1, 2018| 31 109,863.93 m3/month = 1,318,367.16
m3/tahun
Leakage =
25% x 1,318,367.16 m3/year= Rp. 329,591.8 m3/tahun
Average price = 2,209,583,360.16 1,318,367.16
= 1,676 /m3
totallostwater in rupiah = leakage x average price list
= Rp. 329.591.8 m3/year x Rp. 1.676 /m3
= 552.395.856.8 m3/year
= 46,032,988 m3/month = 1.534.432.9 m3/day
Water balance calculation:
• Water distribution at the month Januari – Desember = 146,485.24 m3/month = 1,757,822.88 m3/year
• = 109,863.93 m3/month = 1,318,367.16 m3/year
• No accuracy customer “meter” = 27,832.2 m3/month = 333,986.4 m3/year
• Lost water = amount water distribusion – consumsion acoount in meter tool = 1,757,822.88 - 1,318,367.16 = 439,455.72 m3/year
• water loss
• = lost water – non technical loss=
439,455.72 - 333,986.4 =
105,469.32 m3/year
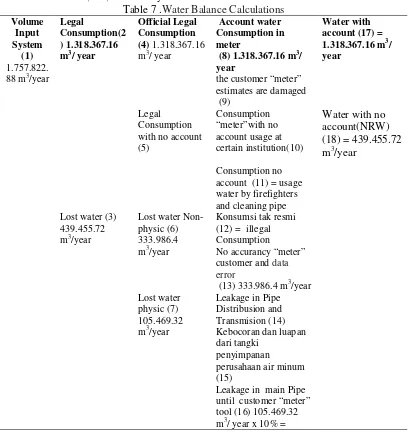
• Water balance calculation can be seen in the following table:
Table 7 .Water Balance Calculations
Volume ) 1.318.367.16 m3/ year
Official Legal Consumption (4) 1.318.367.16 m3/ year
Account water Consumption in meter
(8) 1.318.367.16 m3/ year
Water with account (17) = 1.318.367.16 m3/ year
the customer “meter” estimates are damaged (9)
Legal Consumption with no account (5)
Consumption “meter”with no account usage at certain institution(10)
Water with no account(NRW) (18) = 439.455.72 m3/year
Consumption no account (11) = usage water by firefighters and cleaning pipe Lost water (3)
439.455.72 m3/year
Lost water Non-physic (6) 333.986.4 m3/year
Konsumsi tak resmi (12) = illegal Consumption
No accurancy “meter” customer and data error
(13) 333.986.4 m3/year Lost water
physic (7) 105.469.32 m3/year
Leakage in Pipe Distribusion and Transmision (14) Kebocoran dan luapan dari tangki
penyimpanan
perusahaan air minum (15)
p-
ISSN 2622-2027
e-
ISSN 2622-2035
32|TiBuana, Vol. 01, No. 1, 2018
10.546.9 m3/year CalculateNon – Revenue Water (NRW)
withInfrastructure Leakage Index (ILI)
:Long main pipe (LM) = 5,580 km.
Number of home connections
(NC) = 3.326
Pressure average (P) = 2.04
Average length of service pipes
(LP) = 15 m = 0.015 km
CAPL (l/year) = physical loss at this time
= 374.592.12 m3/year = 212.788.422 l/day = 6,383,652.66 l/month = 76,603,831.92 l/year
ILI = 𝐶𝐶𝐶𝐶𝐶𝐶𝐶𝐶 𝑀𝑀𝐶𝐶𝐶𝐶𝐶𝐶𝐶𝐶
= 374 ,592,120 76,603,831.92
= 4.88
4. Conclusion
From the analysis of the discussion that has been described, it can be concluded as follows:
1. The cause of water loss in PDAM Surya Sembada Surabaya as follows:
a. Physical Water Loss:
• Reservoir leak
• Transmission pipe leaks
b. Non Physical Water Loss:
• Meter Error
• Wild Connection and Water Theft.
2. How to minimize water losses that occur in PDAM Surya Sembada Surabaya, can be controlled to control leaks - leaks that occur as follows :
• Establishment of zones and sub zones
• Establishment of sub zone to be monitored
• Assessment of distribution pipeline network conditions
• Checking the function and recording of water meters
• Sub zone stabilization
• Minimum Night Flow (AMM)
• Leak detection
5. Acknowledgment
This reseaches have been support from Dean UNIPA Surabaya and dan Chairman of the Industrial Engineering Department. In addition, thank you to the PDAM Surya Sembada Surabaya and Hendro Ardiyansyah have been helped and supported in this research.
Reference
1. Abbas, A.Z & Ejah, U.S & Gunadin, I.C & Umar, M.H. (2014). Sistem Deteksi Kebocoran pada Jaringan Pipa Air PDAM Menggunakan Analisis Tekanan dengan Metode Extreme Learning Machine. Jurnal Tugas Akhir Teknik Informatika, D42110277.
2. Ardiansyah, H. 2014. Modul Sistem
Distribusi, Surabaya.
3. Ardiansyah, Juwono, P.T & Ismoyo, M.J. (2012). Analisa Kinerja Sistem Distribusi Air Bersih. Jurnal Teknik Pengairan, 3, 211 – 220.
4. Dharmasetawan, M. 2004. Sistem
Perpipaan Distribusi Air Minum. Eka Mitra Engineering, Jakarta. 5. Farley, M. & Wyeth, G. & Istandar, A. &
TiBuana, Vol. 01, No. 1, 2018| 33 Losses.
6. Hidayat, T. (2012). Pengurangan Tingkat Kehiangan Air Melalui Perbaikan Meteran Air dan Penggantian Meteran Air yang Hilang dengan Pendekatan Sistem Dinamik. Jurnal Teknik Industri, 4 – 5, 978 – 979.
7. Kementrian Pekerjaan Umum. 2009.
Pedoman Penurunan Air Tak Berekening (ATR), Jakarta.
8. Malabay. (2008). Pendekatan Sistem Model Causal Loop Diagram (CLD) Dalam Memahami Permasalahn Penerimaan Kuantitas Mahasiswa Baru Di Perguruan Tinggi Swasta. Pendekatan Model Causal Loop Journal, 1411 – 6286. 9. Rita, D.K. & Nugraha, W.D. (2010). Studi
Kehilangan Air Akibat Kebocoran Pipa Pada Jalur Distribusi PDAM Kota Magelang (Studi Kasus : Perumahan Armada Estate dan Depkes, Kramat Utara Kecamatan Magelang Utara). Jurnal
Teknik Lingkungan FT UNDIP. 10. Sarungallo, G.A & Wardhani,E. (2016).
Evaluasi Sistem Jaringan Distribusi Air Bersih di Kecamatan Pontianak Selatan Kota Pontianak Provinsi Kalimantan Barat. Jurnal Rekayasa Lingkungan, 4, 1.
11. Siregar, N.A & Mulia, A.P .(2012). Evaluasi Kehilangan Air (Water Losses) PDAM Tirtanadi Padangsidimpuan di Kecamatan Padangsidimpan Selatan.
12. Tahid, Suwarno & Nurcahyanie, Yunia Dwie. (2007). Konsep Teknologi dalam Pengembangan Produk Industri Pendekatan Kolaboratif pada Konsep Teknologi dan Desain Produk Industri. Jakarta: Kencana.
13. Tornton dkk. 2008. Penurunan
Kehilangan Air, Semarang.