Information in this document is subject to change without notice. Examples provided are fictitious. No part of this document may be reproduced or transmitted in any form, or by any means, electronic or mechanical, for any purpose, in whole or in part, without the express written permission of Actuate Corporation.
© 2003 - 2015 by Actuate Corporation. All rights reserved. Printed in the United States of America. Contains information proprietary to:
Actuate Corporation, 951 Mariners Island Boulevard, San Mateo, CA 94404 www.actuate.com
The software described in this manual is provided by Actuate Corporation under an Actuate License agreement. The software may be used only in accordance with the terms of the agreement. Actuate software products are protected by U.S. and International patents and patents pending. For a current list of patents, please see http://www.actuate.com /patents.
Actuate Corporation trademarks and registered trademarks include:
Actuate, ActuateOne, the Actuate logo, Archived Data Analytics, BIRT, BIRT 360, BIRT Analytics, BIRT Data Analyzer, BIRT Performance Analytics, Collaborative Reporting Architecture, Dynamic Data Web, e.Analysis, e.Report,
e.Reporting, e.Spreadsheet, Encyclopedia, Interactive Viewing, OnPerformance, Performancesoft, Performancesoft Track, Performancesoft Views, Quite4Me, Quiterian, Report Encyclopedia, Reportlet, The people behind BIRT, X2BIRT, and XML reports.
Actuate products may contain third-party products or technologies. Third-party trademarks or registered trademarks of their respective owners, companies, or organizations include:
Mark Adler and Jean-loup Gailly (www.zlib.net): zLib. Apache Software Foundation (www.apache.org): Axis2, log4, Tomcat. Boost.org: Boost libraries, licensed under the Boost Software License. CURL (curl.haxx.se): Curl, licensed under a MIT/X derivate license. International Components for Unicode (ICU): ICU library. Marcin Kalicinski
(rapidxml.sourceforge.net): RapidXML, licensed under the Boost Software License. Bruno Lowagie and Paulo Soares: iTextSharp, licensed under the Mozilla Public License (MPL). Math.NET: Math.NET, licensed under the MIT/X11 License. Microsoft Corporation: Access Database Engine, SQL Server Express. opencsv team (sourceforg.net): opencsv.
openssl.org: OpenSSL, licensed under the OpenSSL license. qooxdoo.org: qooxdoo, licensed under the Eclipse Public License (EPL). Dave Scriven (svg.codeplex.com): SVG Rendering Engine, licensed under the Microsoft Public License. SQLAPI: SQLAPI++. sqlite.org: SQLite, public domain. stlsoft.org: STLSoft libraries, licensed under the BSD license. Matthew Wilson and Garth Lancaster (www.pantheios.org): Pantheios, licensed under a modified BSD license. All other brand or product names are trademarks or registered trademarks of their respective owners, companies, or organizations.
A b o u t U s i n g B I R T A n a l y t i c s v
A b o u t
U s i n g B I R T
A n a l y t i c s
BIRT Analytics provides fast, free-form visual data mining and predictive analytics. BIRT Analytics combines easy-to-use data discovery and data mining tools with powerful and sophisticated analytic tools.
BIRT Analytics supports selecting, grouping, analyzing, and presenting big data in a way that makes it actionable. BIRT Analytics enables a business user to process massive amounts of data, predict business outcomes, and make informed decisions. By making better decisions faster, business strategists can deliver vibrant and informative visual analysis of inherent trends in big data.
BIRT Analytics consists of three key components:
■ Actuate BIRT Analytics user interface, a web application that is used to carry out dynamic
analyses
■ BIRT Analytics Administration, a set of tools that supports administering user access and
privileges
■ BIRT Analytics Loader, a tool that extracts, transforms, and loads records from an external
data source to FastDB, the BIRT Analytics data repository
Using BIRT Analytics describes how to use Actuate BIRT Analytics technology to carry out dynamic analyses. Using BIRT Analytics includes the following chapters:
■ About Using BIRT Analytics. This chapter provides an overview of this guide.
■ Chapter 1. Understanding BIRT Analytics. This chapter introduces Actuate BIRT Analytics
and provides information about the application’s home page.
■ Chapter 2. Understanding BIRT Analytics work areas. This chapter describes the BIRT
Analytics work areas: Data Explorer, Data Tree, and Scratchpad.
■ Chapter 3. Working with your data. This chapter describes how to select your data for
analysis using BIRT Analytics fundamental tools.
■ Chapter 4. Loading and analyzing data. This chapter describes how to analyze data.
■ Chapter 5. Visualizing your data.This chapter describes how to create appealing data
analysis visualizations.
■ Chapter 6. Identifying and predicting data trends. This chapter describes how to use BIRT
Analytics to mine data.
■ Chapter 7. Managing campaigns.This chapter describes how set up and run a business
campaign using BIRT Analytics.
■ Chapter 8. Scheduling tasks. This chapter describes how to automate tasks and events using
■ Glossary. This chapter provides definitions of terms used in the BIRT Analytics product
A b o u t U s i n g B I R T A n a l y t i c s vii
Accessing BIRT Analytics information
The online documentation includes the materials described in Table 2-1. You can obtain HTML and PDF files from the Actuate website. These documentation files are updated in response to customer requirements.
Obtaining documentation
Actuate provides technical documentation in PDF and HTML formats. You can download PDF or view HTML versions of the documentation from the following URL:
http://developer.actuate.com/resources/documentation/birt-analytics
Obtaining late-breaking information and documentation
updates
The release notes contain late-breaking news about Actuate products and features. The release notes are available on the Actuate Support site at the following URL:
http://support.actuate.com/documentation/releasenotes
If you are a new user, you must first register on the site and log in to view the release notes.
actuate.com also provides product update information. Table 2-1 BIRT Analytics documentation
For information about this topic
See the following resource
Installing BIRT Analytics on Windows, Linux, and Mac OS X
Overview of data analysis and data mining Using BIRT Analytics tools
Visualizing data
Obtaining technical support
You can contact Customer Support by e-mail or telephone. For contact information, go to the following URL:
http://www.actuate.com/services/support/contact-support.asp
Supported and obsolete products
The Actuate Support Lifecycle Policy and Supported Products Matrix are available at the following URL:
C h a p t e r 1 , U n d e r s t a n d i n g B I R T A n a l y t i c s 1
C h a p t e r
1
Chapter 1
Understanding BIRT Analytics
This chapter contains:
■ About BIRT Analytics main interface
■ Understanding the home page
About BIRT Analytics main interface
The BIRT Analytics main interface provides the following tools:
■ Data exploration
■ Purely analytical tools: crosstabs, Venn diagrams, bubble diagrams, evolutions, profiles,
maps, and Pareto analyses
■ Advanced analytical tools for data mining: clustering and forecasting
■ Segmentation tool: selections
■ Data engineering and enrichment tools: aggregates, decodes, expressions, numeric ranges,
quantile ranges, parameters, and rankings
■ Data export and import tools
■ Configuration tools for user preferences: password, language, and theme
Understanding the home page
The home page appears in the browser when you open BIRT Analytics.
A “Recent analysis” panel, on the right-hand side of the page, lists recent analyses that have been accessed. You can clear this list using the “garbage bin” icon at the bottom.
A “My folders” panel to the left of the Recent analysis panel gives you access to your own saved analyses. Choosing the “Folder” tab, displays your folders in the “Data Tree” panel. (Go to the section “Understanding Data Tree” in Chapter 2, “Understanding BIRT Analytics work areas” for more information on the Data Tree.) Both the “Recent analysis“and the “My folders” panels are shown in Figure 1-1.
Figure 1-1 My folders and Recent analysis panels in the home page
C h a p t e r 1 , U n d e r s t a n d i n g B I R T A n a l y t i c s 3
Laying out the feature tabs
A tools menu provides customization options for each set of tabs in the user interface, as shown in Figure 1-2. These options support placing the tabs in different positions and displaying text, an icon, or both on each tab. To access these options, right-click a tool’s tab.
Figure 1-2 Options for tool tab placement and text
Setting preferences
Use Preferences to change the password, language, and theme for BIRT Analytics, as shown in Figure 1-3. To save one change and prepare to make further changes, choose Change. To discard unsaved changes, choose Cancel. To save changes and return to BIRT Analytics, choose Accept. Changes take effect after exiting BIRT Analytics and reentering.
Table 1-1 Icons for BIRT Analytics features
Icon Label Purpose of the BIRT Analytics feature
Start The initial view
Explore Viewing and interacting with data in a segment or table
Enrichment Creating more informative data by defining new fields in existing tables or using the data outside BIRT Analytics
Enrichment—
Engineering Enriching analyses by creating new fields in existing tables
Enrichment—
Import-Export Inputting and outputting data using various formats Analytics Performing in-depth examinations of data and drawing
conclusions from the patterns
Analytics—
Analysis Examining data in depth using statistical tools Analytics—
Advanced Mining data to produce information from operations such as grouping and prediction
Analytics—
Selections Segmenting the data by identifying groups of items that meet certain condition
Gallery Displaying data in visual form, providing a quick way to see trends and patterns
Campaign
Workflow Planning, configuring and managing campaigns.
Tasks and
Events Scheduling tasks based on Time or on Events
Positions
Figure 1-3 Available user preferences
Logging Out
The application does not log out automatically, even when there has been no use for a prolonged period of time. The application locks the screen after prolonged inactivity. Simply type your password to unlock it.
You can lock your screen at any time via the User icon at the top right-hand side of the screen, as shown in Figure 1-4.
Figure 1-4 Using the Lock command
Changing a password
The new password must comply with the password policy associated with the user account and must contain at least one of each of the following character types:
■ Lowercase letters
■ Uppercase letters
■ The following special characters _, -, !, ·, $, %, (, ), =, |, @, #, €, *, ~, ",", ., " "
■ Numeric characters
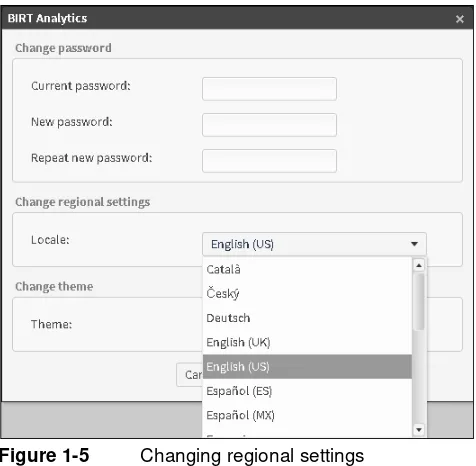
Changing regional settings for language/locale
C h a p t e r 1 , U n d e r s t a n d i n g B I R T A n a l y t i c s 5 Figure 1-5 Changing regional settings
How changing regional settings affects date and date/time
Setting your locale also sets your date and date/time values so that they will be displayed in your local format - appearing correctly in the Discrete Values grid, in Crosstab row
dimensions, in Bubbles, Pareto and Profiles.
Subsequent editing of date and date/time values is done using a Calendar form.
Changing the theme
You can change the appearance of BIRT Analytics using predefined themes. BIRT Analytics provides two themes: Augusta and Classic (original BIRT Analytics theme, as shown in Figure 1-6.
Figure 1-6 Changing the theme
Identifying hidden buttons and tabs
When you minimize the size of a window, an icon appears next to the Window’s drop-down list on the top right of the screen. It gives access to a list of any buttons or tabs that are no longer accessible on your screen. In Figure 1-7 below, clicking on the this icon in a minimized window in the Advanced Tab of the Analysis tool set shows that both the Logistic regression and the Linear regression tabs are hidden from view. This feature is available in all windows and tabs except Start and Explore.
Access to other resources
The “Resources” panel found at the bottom of the home page gives users access to the following online resources:
This panel also gives access to information concerning the release of the installed software.
Understanding the sample data model
Figure 1-8 shows an outline of the demo database analytical model. Not all fields from each table appear in this example.
■ Household is the main table.
■ Customer is a sub-table 1.
■ Order is a sub-table 2.
■ Order Detail is a sub-table 3.
Figure 1-8 Demo database tables, fields, and associations
When the administrator loads the demo database into BIRT Analytics, the loader sets up the associations among the tables. Use these implied associations in BIRT Analytics to change the resolution on many types of analyses:
■ A household can have from 1 to N associated customers.
■ A customer can have from 1 to N associated orders. A customer must have an associated
household.
■ An order can have from 1 to N associated order detail lines. An order must have an
associated customer.
■ An order detail line must have an associated order.
C h a p t e r 2 , U n d e r s t a n d i n g B I R T A n a l y t i c s w o r k a r e a s 7
C h a p t e r
2
Chapter 2
Understanding BIRT Analytics
work areas
This chapter contains:
■ About BIRT Analytics work areas
■ Understanding Data Tree
■ Understanding Scratchpad
■ Understanding Data Explorer
About BIRT Analytics work areas
The BIRT Analytics user interface consists of three main areas:
■ Data Tree
■ Scratchpad
■ Data Explorer
Understanding Data Tree
Data Tree provides the following three views to navigate through your data and saved analysis files: My Data, Discrete Values, and My Folders, as shown in Figure 2-1.
Figure 2-1 Data Tree showing the tables in the Demo database
My Data works with the Discrete Values viewer, which shows the content of explored fields, their values, and the stored entries with each value. Values are sometimes called categories and entries as records.
Using My Data
My Data is available from Data Tree. Use My Data to display and navigate through databases, tables, and fields. To view the tables in a database, select the triangle icon beside the database name. To view the fields in a table, select the triangle next to the table, as shown in Figure 2-2. In this figure, the Demo database and the Customer table in the database are expanded and the fields in the Customer table are accessible. Selecting the triangle next to an expanded database or table collapses the view of the items.
Figure 2-2 My Data showing fields in the Demo Customer table
C h a p t e r 2 , U n d e r s t a n d i n g B I R T A n a l y t i c s w o r k a r e a s 9 In My Data, right-click an item (Database, Table or column) to enable the following field operation options:
■ Chart: Display the Chart view of the item.
■ Delete: Permanently remove the Database, table or column. Delete is available only for
users who have the Delete privilege granted by an administrator.
■ Discrete values: Display the discrete values for the item.
■ Edit: Edit the segment in the Selections window that opens, making necessary changes or
corrections.
■ Explore: Display all relevant table columns of the selected database in the Data Explorer
panel, filtering with the chosen segment.
■ Frequency: Provides frequency information about the item
■ Make Permanent: Write a calculated field as an entry in the database. ■ Rename: Rename the item.
■ Selection: Select a range of values stored in a column. ■ Statistics: Provides statistical information about the item
■ Summary: Displays a summary view of relevant item information ■ Index/Unindex: Indexes or unindexes columns.
■ View definition: View definition of a domain column
Table 2-1 Icons for database, table, and field data types
Not all options are available to every Data Tree item:
■ Database options:Summary, Rename and Delete ■ Table Options:Summary, Explore,Rename and Delete
■ Column Options:Chart, Discrete values, Explore, Summary, Rename, Delete and Index/ Unindex
■ Numeric Column Options: Chart, Frequency, Discrete values, Explore, Statistics,
Summary, Remove, Delete, Select and Index/Unindex
■ Derived Column Options: Chart, Frequency, Discrete values, Explore, Statistics, Summary,
Rename, Edit, Make permanent, Delete, Select and Index/Unindex
■ Derived Domain Column Options:Chart, Discrete values, Explore, Summary, Rename,
Delete, Index/Unindex and View definitions
Making a calculated field permanent
A calculated field can be stored as a permanent field in the associated table for use by others. Identify a calculated field by the small, gray cog in the lower left corner of the calculated field icon. Unlike a calculated field, a permanent field can be used to sort columns in a report. Making a calculated field permanent replaces the calculated field. The database does not retain the original calculated field definition.
How to make a calculated field permanent
1 Right-click a calculated field appearing in My Data.
2 Choose Make permanent.
Using Discrete Values
Discrete Values is a view that shows the contents of individual database fields. Each unique value, or category, is represented by a total of all its occurrences or records. Discrete Values appear when you double-click a database field in My Data. For example, double-clicking the Age Numeric field in the Customers table displays a list of age ranges and the customer records matching each age range, as shown in Figure 2-3.
Figure 2-3 Discrete values showing the values in the Age Numeric field
Discrete Values also supports dragging fields and dropping them in places where selections or segments are used. For example, drag one or more specific categories to Scratchpad to examine the values in detail or store them for future use.
C h a p t e r 2 , U n d e r s t a n d i n g B I R T A n a l y t i c s w o r k a r e a s 11 that contains many discrete values. [Order].[Order No] contains more discrete values as there is a unique category for every order.
Categories can be sorted by name and the records they contain. The default sort order is by number of records. To sort categories in alphabetical order, click Value. A search engine supports finding particular categories by Name. Select multiple discrete values by holding CTRL while clicking the desired categories.
Discrete Value Search
The Discrete Values searching process is instantaneous due to its ability to take multiple keystrokes into account rather than individual keystrokes.
Using My Folders
My Folders displays the files and folders available to a user, as shown in Figure 2-4.
Figure 2-4 My Folders showing a personal folder, Income
Files and folders in the My Folders section in My Folders are available only to you. Files in the Shared section are accessible to all users. Files can contain analyses, selections, and exports. There is no fixed limit to the folders you can create. To share a file with other users, move the file under the Shared heading.
Create new folders directly or while saving a file:
■ Right-click the folder My folders. Choose New. Type the name and description of the new
folder, as shown in Figure 2-5.
Figure 2-5 Creating a new folder named Income
■ When saving an analysis, choose Save As to create a folder in which to save the analysis.
To save a complete data structure into a file with a .ddw extension, right-click a file and choose Export. The file can be downloaded to your local system. To load previously stored structures, right-click a folder and choose Import.
Understanding Scratchpad
Figure 2-6 Scratchpad showing two segments Use Scratchpad in the following ways:
■ Drag segments directly from Data Tree to use as filters in analyses.
■ Drag results of different analyses to Scratchpad for detailed analysis.
■ Manipulate segments from Data Tree or from an analysis to create intersections, invert
content, and so on.
All changes applied to a segment in Scratchpad affect only the current session. To retain these segments for later use, save them in My Folders, as described in “Using My Folders.”
Scratchpad consists of four elements:
■ Segments window. Drag segments from other windows in BIRT Analytics and drop them
in this main area of Scratchpad. Available segments are tables from a database, discrete values, and the results of some analyses.
■ Status bar. This information displays the number of records in the selected segment.
■ Segment handling menu. When you drag one segment over another in Scratchpad, the
join functions in Table 2-2 appear.
■ Secondary menu. When you right-click a segment, the options in Table 2-3 are available.
Table 2-2 Functions used to join segment contents
Icon Function Description
AND Joins the two categories with the resulting segment containing those records that meet both conditions simultaneously. For example, you can select Customers who are Sales Assistants and under the age of 25.
OR Joins the two categories with the resulting segment containing those records that meet one or both of the conditions.
For example, you can select customers who are either Sales Assistants or under the age of 25, which would include Sales Assistants under the age of 25.
Exclude Joins the two categories, with the resulting segment
containing those records that meet the conditions in the first category but not the second one.
For example, you can select customers who are Sales Assistants but not under the age of 25, which excludes Sales Assistants under the age of 25.
NAND Inversion of AND.
C h a p t e r 2 , U n d e r s t a n d i n g B I R T A n a l y t i c s w o r k a r e a s 13
Understanding Data Explorer
Data Explorer is a tool that displays detailed and summary information about databases, tables, and fields. To access Data Explorer, choose Explore. Next, drag a segment from Data Tree or Scratchpad, and drop it in Record View.
Depending on the selection you make, different views are available, as shown in Table 2-4. Table 2-3 Segment options
Option Description
Rename Prompts for a new name for the segment. Use this option if you have changed the results of the segment by joining it with another one and the default name no longer describes the segment accurately.
Delete Removes the segment from the scratchpad.
Edit Edits the segment in the Selections window that opens, making necessary changes or corrections.
Explore Display all relevant table columns of the selected database in the Data Explorer panel, filtering with the chosen segment.
Invert Change the segment to return results that exclude the selected segment. For example, to select all records from households that are not in London, select London and invert the selection. [Household].[Town] contains 1335 different towns. Selecting all towns, except London, one by one would be very time-consuming. Invert takes the category of London and returns all the records that do not belong to this category.
Make permanent
Save the segment as a new field. The field appears in the table currently being used for resolution. Save a segment to make it available in a subsequent BIRT Analytics session.
After refreshing the screen view, the new field appears in the table in which it belongs.
Change resolution level
You can resolve results at different levels in the database. These levels correspond to the tables that make up the segment. For example, resolve a category from the Customer table at the Household level to display the households of the customers. To interpret the results of changing the resolution, keep in mind the direction of the resolution change, either many (N) to one or one to N.
First discrete
Choose a record for each of the selection's attributes based on a field in the database.
View definition
Examine the definition of the segment. The definition contains all the operations applied to the segment, indicating the type of operation, the segment's total records, the records after performing the operation, and the query that obtains this segment. After you make a change in resolution, the operations performed are displayed in groups.
Sort Uses a field from the database to sort the segment. The result of the sort appears in Scratchpad and not in the data explorer.
Select sample
Returns a data sample with the size determined by the selection condition: Top, Bottom, Middle, 1 in N, Random.
Data Explorer enables you to export data as .csv files which can be opened in Microsoft Excel. To remove data from Data Explorer, choose Clear.
About Record View
Record View displays the records in the table you are exploring or the table that contains the field you are exploring. For example, when you explore the Customers table you see 50 of the 259,874 records. You can browse the pages into which the records are divided by using the arrows on the pagination bar. You can navigate to a specific page by typing the page number and pressing Enter.
Select the specific columns/fields you want to view exclusively in the Data Explorer main window by clicking on the small “Column Selector” icon in the upper right-hand corner of the window.
Double-clicking on a column/field in the Data Tree moves it into the main Data Explorer window on the right.
You can remove columns from the main Data Explorer panel by dragging them out.
To remove all data from the Data Explorer, click on “Clear”.
About Summary
Summary displays information about the database, table, or field you are exploring.
For a database, Summary displays the name of the database; the tables in the database; and the rows, columns, and cells in each table.
For a table, Summary displays the name of the table; the number of rows, columns, and cells it contains; other database tables to which it is joined; and information about each field in the table, such as data type, discrete values, and whether or not the column is indexed.
For a field, Summary displays the name field; the table containing it; and other information, such as data type, number of discrete values, and whether the column is indexed.
To export the contents of the Summary to a PDF file, choose the export icon in the upper-right corner.
About Discrete Values
Discrete Values shows the categories in a column, the occurrences or records for each category, and the percentage for each category. To export the contents of Discrete Values to a CSV file, choose Export. CSV format is compatible with Microsoft Excel and text editors, such as Ultraedit and Notepad++.
About Chart
Chart displays a graphical representation of the records of categories in a database column. The values are ordered from most frequently occurring to least frequently occurring. The Table 2-4 Data Explorer views for data selection types
Selection type Available Data Explorer view
Database Summary
Table Record, Summary
Unindexed field Record, Summary
Indexed textual field Record, Summary, Discrete Values, Chart
C h a p t e r 2 , U n d e r s t a n d i n g B I R T A n a l y t i c s w o r k a r e a s 15
■ Columns 3D (default)
■ Areas
■ Bars
■ Columns
■ Doughnut
■ Doughnut 3D
■ Lines
■ Pie
■ Pie 3D
To change the chart type, use the “chart” icon in the upper right corner.
To export a chart as an image file, choose the “image” icon.
The export icon displayed in the Chart view exports the full analysis (data and graphic) in PDF format.
Sorting Charts in Explorer
By default, and for performance reasons, the Chart view displays records sorted by Value (ascending). This default sort is determined by how the values are sorted in the Discrete Values view. To display your Chart sorted by Count (descending) instead of by Value (ascending), you need to go to the Discrete Values view and select Count. Your Chart then appears by Count (descending), as shown in Figure 2-7.
Figure 2-7 Sorting Charts in Explorer
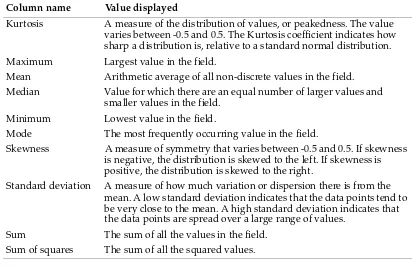
About Statistics
Statistics displays the following information in a tabular format for numeric fields.
Table 2-5 Information provided for a numeric field
Column name Value displayed
Count Total number of non-discrete values in the field.
(continues)
To export the contents of the Statistics tab to a PDF file, choose the export icon in the upper-right corner.
About Frequency
Frequency displays a graphical representation of the occurrences of values in a database column. The values are in ascending order. The following chart types are supported:
■ Areas (default)
■ Bars
■ Columns
■ Columns 3D
■ Lines
To change the chart type, use the chart icon in the upper-right corner. To export a chart to a JPG file, choose the export icon.
Exploring views of a database
Data Explorer supports viewing different levels of a database, depending on the level of data you choose to view. For example, you can choose a database to view summary information for that database. You can choose a column in a database table to view records, discrete values, a chart of values, or summary information about the column.
Note: When you minimize the size of a window, an icon appears that lists any buttons or tabs that are no longer accessible on the screen.
How to view a database summary
1 Drag a database from My Data and drop it in Data Explorer.
2 Examine the information appearing on Summary, as shown in Figure 2-8.
Kurtosis A measure of the distribution of values, or peakedness. The value varies between -0.5 and 0.5. The Kurtosis coefficient indicates how sharp a distribution is, relative to a standard normal distribution. Maximum Largest value in the field.
Mean Arithmetic average of all non-discrete values in the field. Median Value for which there are an equal number of larger values and
smaller values in the field. Minimum Lowest value in the field.
Mode The most frequently occurring value in the field.
Skewness A measure of symmetry that varies between -0.5 and 0.5. If skewness is negative, the distribution is skewed to the left. If skewness is positive, the distribution is skewed to the right.
Standard deviation A measure of how much variation or dispersion there is from the mean. A low standard deviation indicates that the data points tend to be very close to the mean. A high standard deviation indicates that the data points are spread over a large range of values.
Sum The sum of all the values in the field. Sum of squares The sum of all the squared values. Table 2-5 Information provided for a numeric field (continued)
C h a p t e r 2 , U n d e r s t a n d i n g B I R T A n a l y t i c s w o r k a r e a s 17 Figure 2-8 Viewing a database summary in Data Explorer
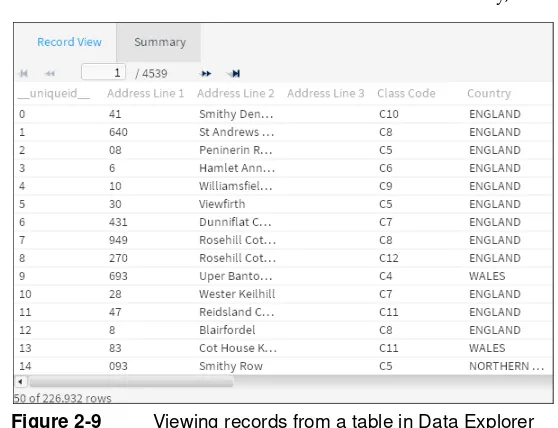
How to view a database table
1 From a database appearing in My Data, drag a table and drop it in Data Explorer.
2 Examine the information on Record View and Summary, as shown in Figure 2-9.
Figure 2-9 Viewing records from a table in Data Explorer
How to view a database column
1 From a database table appearing in My Data, drag a column and drop it in Data Explorer.
Figure 2-10 Viewing a database column using a chart in Data Explorer
Filtering views of a database
You can filter the view of a table or column appearing in Data Explorer using segments. Adding a segment to the view of a table or column limits the records shown to only those records having a value that matches the segment.
How to filter a database view using a segment
1 Drag a column from My Data and drop it in Data Explorer.
2 Select Discrete Values.
3 Drag a row in Discrete Values and drop it in Scratchpad. For example, from the Age Numeric column, drag Age Numeric EQ 25 under. A segment appears in Scratchpad.
4 In Data Explorer, select Record View.
5 Drag one or multiple segments from Scratchpad and drop the segments in Drag a segment. A view of data, filtered by the selected segment, appears in Data Explorer.
Understanding table resolution
BIRT Analytics supports saving your selections, queries and analyses for reuse. To retrieve records from a different part of your database, replace the table from which you retrieved records in a previous selection, query, or analysis, then recalculate the results. To demonstrate how the concept of table resolution works in practice, this section presents examples of viewing different tables in the BIRT Analytics demo database using Data Explorer.
Viewing results of simple queries
Examining results returned by a simple query from one database table shows the discrete values in that table. For example, using My Data, expand the Household table, then double-click Property Types Decode. In Discrete Values, you see 28,514 records for households having the type Bungalow.
C h a p t e r 2 , U n d e r s t a n d i n g B I R T A n a l y t i c s w o r k a r e a s 19 customers in the database. To resolve questions about customers in each household, you can change the resolution or perspective of your query.
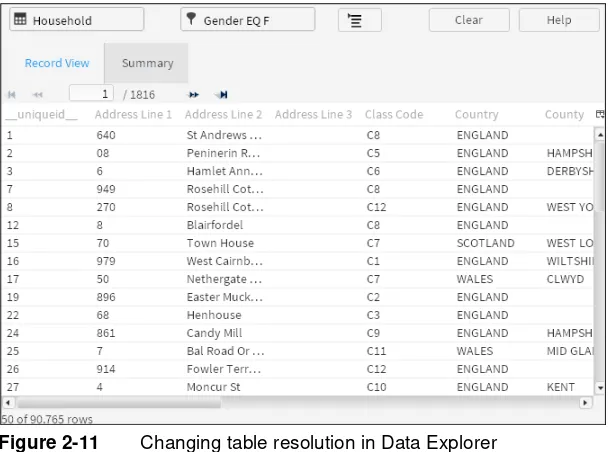
Changing table resolution
To demonstrate changing table resolution, modify the second example from the preceding section in the following way. Drag the Female value from Discrete Values and drop it in Record View of Data Explorer. You see complete records for 102,042 female customers. Choose My Data, then replace Customer with Household. To do this task, drag Household from My Data and drop it on Customer in Data Explorer. 90,765 records that represent households having one or more female customers appear in Record View, as shown in Figure 2-11.
Figure 2-11 Changing table resolution in Data Explorer
C h a p t e r 3 , W o r k i n g w i t h y o u r d a t a 21
C h a p t e r
3
Chapter 3
Working with your data
This chapter contains:
■ Using BIRT Analytics basic tools
Using BIRT Analytics basic tools
Basic tools appear throughout BIRT Analytics to support common data analysis operations such as calculating and saving results, clearing work spaces, selecting data, and importing and exporting files. Engineering tools support creating new data fields that support your analysis of existing data values. This chapter explains the fundamental tools provided in BIRT Analytics.
Understanding the basic tools
A toolbar appears in the window for each analysis type. Some or all the following basic tools are available in each window.
Calculate
Calculates, runs and displays the analysis using the parameter values.
Export modes
Exporting Table view data
Press the Export button in the analysis toolbar. In this case the results table is exported from the Crosstab, Venn, Bubble or Profile analysis. Values are exported to a comma-separated values (CSV) file, a standard format supported by Excel and text editors such as Notepad ++.
Exporting Charts
The image icon displayed in the Chart view enables exporting a chart as an image file.
Full export
The export icon displayed in the Chart view exports the full analysis (data and graphic) in PDF format.
Exporting a Crosstab to FastDB
:It is also possible to export a Crosstab analysis directly to the FastDB engine, creating a new table in the database. This is done by selecting the new option “Analytic DB” from the dropdown list of the “Export” tool found in the Crosstab toolbar..
Clear
Clear removes all entries from the window, without saving.
Convert
This option changes one analysis or indicator into another one with the same features.
Save or Save As
You can save all BIRT Analytics analyses you create using analysis tools or selections. The definition of the analysis is saved, but not the results themselves. Any modification to the database which affects its configuration is automatically applied when the saved analysis is run.
These analyses must always be saved in a folder. If a folder has not been created previously, it can be created when saving the first analysis. You can access saved analyses from Data Tree using My Folders.
Any folder or subfolder is personal, unless you indicate otherwise and give viewing
C h a p t e r 3 , W o r k i n g w i t h y o u r d a t a 23 If you run a saved analysis, make a change to its configuration, and want to keep both the initial and modified versions, use Save As to save a new version of the analysis.
Applying a filter
Filters are used throughout BIRT Analytics and are based on data segments.
You usually can drag a discrete value directly to a filter area. For example, in an analysis of recent orders, you can drag the Customer Gender discrete value “female” to the analysis filter to see only orders placed by female customers.
Some tools offer more advanced filters.
About advanced filters
Crosstab, bubble, and map analyses support the following three types of filters: universal, target, and baseline.
A universal filter is applied before any change in resolution occurs. A target filter is applied after a change in resolution occurs. For example, to view only records for female customers, add as a universal filter: Gender equals female. If you add Gender equals female as a target filter and change the resolution from Customer to Household, only records that include households with females appear. Some of those households can include males.
Target and baseline filters are used together to create comparative analyses. Be sure to use segments that can be compared. For example, compare one year with another or one
population group with another. When calculating a comparative analysis, you can choose to display a measure as:
■ Result
The default for measures is to produce the count of records in both filtered segments. This is not directly useful for most comparisons but can be used as a total when creating calculated fields.
■ Index
Shows the degree to which compared groups differ using an indicator. An index value greater than 0 means that the baseline is as many times greater than the value shown by the index with respect to the target. An index value less than 0 means the reverse is true. The formula for Index is:
(Target/Total) / (Baseline/Total)
■ Difference
Displays size differences between the baseline and the target as measured in units. A negative result means that the baseline has as many more values than the displayed number. A positive result indicates the opposite. The formula for Difference is:
Target - Baseline
More about filters and resolution changes
If you are using filters, specific situations require certain filter types. You must use a target filter for pivoted analyses when there is a change in resolution between the axes and the measures in the direction N-to-1. You must use a universal filter with a non-pivoted table when there is a change in resolution between the axes and the measures in the direction N-to-1. When no such size disparity exists between axes and measures, the type of filter used for each analysis does not matter.
Consider creating a Crosstab using axes from one table and resolving the results in another. Use, as a filter, a segment from the source table for the axes.
■ Universal filter. Apply the filter before carrying out the change in resolution. For example,
the field low salary [axis 1: customer table, salary field] is used with the filter. Next, change the resolution to a different table, such as Households. The filter conditions are met by the same household and person. The resolution unit of the filter is the unit indicated by the axes of the crosstab, in this case Customers.
■ Target filter. Apply the filter after carrying out the change in resolution. In other words,
select the segments from the table to which the selected axes belong, and carry out the change in resolution for a table chosen as the resolution level for the results. Next, apply the filter. For example, low salary [axis 1: customer table, salary field] and the resolution is changed to Household. In this example, you see all households with at least one customer whose salary is low. The filter is applied. For example, [customer tables, gender
field =female] gives a result qualitatively higher than the result from the universal filter. All households meeting the condition of low salary and female appear. The condition is not necessarily met by the same person. The filter's resolution unit is Households, the resolution table for the crosstab.
■ Baseline filter. Selecting a target filter activates a baseline filter. Use a baseline filter to
build a comparison. For example, compare two periods of time using the following two filters: 2008 target and 2007 baseline.
To configure the table, you must first select the axis or axes by dragging to the appropriate space, then dragging the measures. By default, when you drag the axes, the value count for the table to which they belong appears.
Creating a parametric filter
Include parameters used in filters if a table is calculated or in a situation where you introduce a new data table to calculate the final output. The filter is determined by prompting you for the value when the analysis is calculated. You can use either a pre-set filter or a prompted filter, but not both.
Defining a selection
A selection is a segment of data, a set of values chosen for a specific purpose. A database is made up of values, and these values internally form groups that have similar features, with these segments being homogeneous. For example, an organization’s customers can be gender=F or gender=M, but not both. You can combine these segments (gender=F, aged between 25 and 35, city=Barcelona, and average purchasing power, for example) and thus specify the target audience for a marketing campaign or promotional offer.
The BIRT Analytics Selections tool supports drag-and-drop configuration of elements in a selection. After configuring a selection, save it in Scratchpad or in a shared or private location for reuse. Calculate the selection to return all records meeting the condition defined in the selection. As with full analyses, BIRT Analytics saves any defined parameters for each selection and runs them in real time.
For example, a selection may include only one query returning all rows from a single database table. To create a more complex selection, define multiple blocks. Each block can return records from a specific table or column, use a specific operator to compare values, or define ordering and grouping conditions. By combining elements in logical blocks, you refine the set of records the selection returns.
How to define a selection
1 Choose Analytics—Selections.
2 Choose New to open a new Selections window.
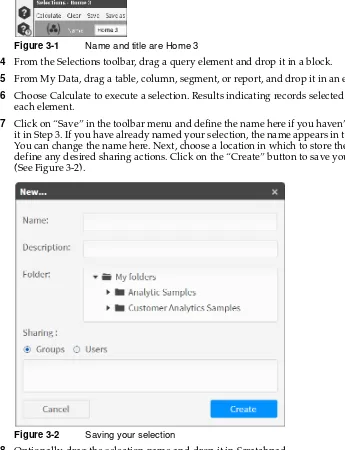
C h a p t e r 3 , W o r k i n g w i t h y o u r d a t a 25 Figure 3-1 Name and title are Home 3
4 From the Selections toolbar, drag a query element and drop it in a block.
5 From My Data, drag a table, column, segment, or report, and drop it in an element.
6 Choose Calculate to execute a selection. Results indicating records selected appear for each element.
7 Click on “Save” in the toolbar menu and define the name here if you haven’t already done it in Step 3. If you have already named your selection, the name appears in the Name field. You can change the name here. Next, choose a location in which to store the selection and define any desired sharing actions. Click on the “Create” button to save your selection. (See Figure 3-2).
Figure 3-2 Saving your selection
8 Optionally, drag the selection name and drop it in Scratchpad.
For example, Figure 3-3 shows a selection returning all rows from the Customer table in the BIRT Analytics Demo database in which the customer is over 65 years old.
Figure 3-3 Examining basic elements in a simple selection
Query element Block element
How to create a new query
1 Drag New query from Selections toolbar and drop it in a block.
2 Drag a field from the database, for example Gender, and drop it in the query element.
3 Select an operator from the following operators that appear in the drop-down list as shown in Figure 3-4.
Figure 3-4 New Query list of available operators
4 Drag a value, for example Female, from Discrete values and drop it after the operator.
5 Choose Calculate. Then follow the same procedure for any other value you want to use. Segments interact with each other by adding or excluding those records that do not match both values. For example, you have the value Female from the Gender field; if you drag the value 25 from the Age field, you can return:
■ All women and everyone aged 25, regardless of gender
■ All women aged 25
To accomplish this task, you select an operator from the drop-down list to the left of the dragged column. In the first example, the appropriate operator is Or. In the second example, it is And. By default, the And operator is used for values from different fields in the database. When the values are from the same field in the database, the default operator is Or. For example, if you combine the values Age =25 with Age=26, and the operator is And, the number of values that meet both of these conditions is zero.
You can also create a new query by dragging a segment from the data tree or the scratchpad to:
■ A query in the selection. The new query is entered.
■ A block. The new query is entered at the end of the block.
To parameterize a query, right-click the query and choose Parameter.
How to create a new parametric query
A parametric query is a query based on a value determined at calculation time, which can be the default value of the parameter. You create a parametric query the same way you create a non-parametric query.
For example, create a selection to calculate the number of customers under 25 years of age with occupation janitor. You can have a query with age, occupation and another third query sentence. In this particular example, our third query sentence is parametric gender. You can include a default value for the parameter, such as Female. When you run the selection, you are prompted to type a parameter value or accept the default. The result is a selection parameterized by gender.
C h a p t e r 3 , W o r k i n g w i t h y o u r d a t a 27
Adding a block
Use a block to group elements in a selection. For example, consider the following basic mathematical operation. If you want to determine the result of the sum of two values multiplied by the sum of two other values, group the sum operations as follows:
(34+89)×(23+65)
Now consider the following example as it applies to selections:
(Woman+salesperson) or (Woman+director)
If you do not include parentheses in this selection, you cannot be certain that the operators you use are invoked in the intended order. One block is (Woman + salesperson) and another block is (Woman + director). A new selection has one block, in which you name the selection, by default. Every block must include a query element.
How to add a block
1 Drag a block element from Selections toolbar and drop it in an existing block.
2 Drag and drop additional elements in the block, as necessary.
Returning all rows from a table
To return all rows from a database table, add a query, using the “All” element.
How to return all rows from a table
1 Drag All from Selections toolbar and drop it in a block.
2 Drag a database table from My Data and drop it in the All element.
3 Optionally, select an operator from the list.
4 Choose Calculate.
Note: You can create a new “Select All” query by dragging a whole table from the Data Tree and dropping it on a selection item.
Changing resolution
Adding a change resolution element to a selection or block changes the perspective of the selection. For example, to select customers who are both women and directors, you create a selection including query elements that return records for all customers who are female and directors. To see the households where the people who meet these conditions live, add a change resolution element to the selection.
A change resolution element cannot hold the top-level position in a selection. A change resolution element holding the last position in a selection causes the selection to return all records from the new table linked to all previous conditions. For example, the selection defined in the example shown in Figure 3-5 returns 868 records for households in which customers who are women directors live.
Figure 3-5 Examining a selection with one resolution change
Change resolution element
For a contrasting example, add a change resolution element for each query element. This approach changes the perspective of each query in the selection. The selection in the example shown in Figure 3-6 returns all houses where customers who are female live, intersected with all houses where customers who are directors live; a total of 1009 records.
Figure 3-6 Examining a selection with two resolution changes
Returning all rows and changing resolution level
You may choose to create a selection using query elements that return records from different tables. Placing an All query element as the first, or the last element in a selection returns different numbers of records. Placing the All element first in a selection affects all single queries added after the All element by changing the resolution level to the table defined in the All element. An example showing a selection created in this way appears in Figure 3-7. The selection returns all houses, intersected with houses where female customers live, intersected with houses where director customers live.
Figure 3-7 Selecting all records from a table first
Placing an All element last in a selection affects the selection by changing the resolution level to the table defined in the All element. In this case, the selection returns all female customers, intersected with director customers, intersected with all customers that have a house. In other words, this selection returns all female customers who are directors and have a house. In the BIRT Analytics Demo database, 868 records match this condition. An example showing a selection created in this way appears in Figure 3-8.
Inverting a selection
To return the inverse set of values in a selection, drag Invert and drop it in a selection. For example, consider a selection that returns customer records containing Woman and Director; in other words, the set of women who are directors. Adding Invert to this selection causes this section to return all records in the database for customers who are not women directors.
Selecting discrete values
Add a Discrete Values element to a selection to return specific values. Drag Discrete Values from the Selections toolbar and drop it in a block. Next, drag a database field name from My
Total records
All element
C h a p t e r 3 , W o r k i n g w i t h y o u r d a t a 29 Data and drop it in the element. Choose Calculate to return the field values. For example, a discrete values element using the Age field returns seventy two values from the Age field.
Figure 3-8 Selecting all records from a table last
Sorting values
Add a Sort element to a selection to sort the values in the selection. Drag a column and drop it in the Sort element, then select Ascending or Descending order.
Specifying a sample in a selection
Add a Sample element to a selection to return a defined range of N records for a block or a selection. Sample requires that you select a range parameter and number of values that define the sample. For example, select Top and type 10 to sample the top ten records of a selection.
Creating an inner selection
Use an Inner selection element to add an existing filter to a selection. For example, consider how to create a selection of female directors who are 50 years old, using an existing selection of female directors.
How to create an inner selection
1 Create a new selection and provide a name for the block.
2 Drag Inner selection from the toolbar and drop it in the block element.
3 From a shared location in My Folders, drag the Female directors selection and drop it in the Drag a report box in the inner selection element.
4 To the current selection, add a query element, Age=50.
5 Choose Calculate to return the number of female directors who are 50 years old.
Using import and export tools
Use these tools to import and export data and to create and delete links.
Using the import tool
Use this tool to import data to a new table created in the database currently loaded in the Engine. For example, this tool is useful when you want to create a Master table.
How to import a table
1 Select the source of the data to be imported. Options range from MS Access to text files.
2 For a text file, select file features and whether the first row contains the file header.
3 In the columns section, create the definition of the columns by selecting Get columns or Add columns. The definition of a column can be changed by double-clicking it. Define as many columns as there are in the file.
4 Use the Column up and Column down buttons to change the position of a column.
Understanding links
Use links to delete existing relations between columns in different tables and to create new relations between columns. Creating links is important when working with the Engine. If the links have not been created or have been created incorrectly, it is not possible to work with various levels of resolution in the analysis. You cannot obtain reliable results when you mix columns from different tables in the database in a Crosstab or a Venn diagram.
Note: In the case of links that have a 1 to 1 relationship, the first column automatically becomes the Parent table and the second column becomes the Child table.
Using the export tools
BIRT Analytics provides two export tools. Export File exports a segment to a plain text file. Export Database exports a segment to a table in the database. Supported export file formats are: CSV (comma-separated values) file, a standard format supported by programs such as Excel and text editors including Ultraedit and Notepad++, and PDF file. Both tools provide Save and Save As options.
When you save an export definition, both the segment and the export configuration are saved in your personal folders. You can share your folders with others by granting viewing
permission to a user or to a group or groups of users. Groups can contain from only one to any number of individuals. Permission granting is managed in the BA Admin tool.
How to export to a text file
1 In Enrichment—Import-Export, choose Export➛File.
2 Drag the segment you want to export from Scratchpad and drop it in Segment to export.
3 In Delimiter, select a column character separator: tab, pipe, flat, comma, colon, semicolon, at, sharp, quote, plus, minus, apos, tilde.
4 In End of line, select an end-of-line character: CR, LF, CRLF, or LFCR.
5 To save the file in the application server, choose Deferred. You can download this file from the application server by choosing Downloads.
6 To add a field containing the Uniform Resource Name (unique identifier) to the generated file, choose URN.
7 In Available columns, to select the fields to export, drag each field from the left pane to the right pane. To change the order of the fields, use the up and down arrow buttons.
How to export to a database
The export-to-database tool exports a segment to a new table in the analytical database engine. You must select the database in which you want to create the new table, the name of the new table, and the fields to create in the destination table.
Using downloads
This tool lists deferred export files. This list shows the date, type, name, and file size. To download or delete an export file from the application server, you must open it.
Using BIRT Analytics engineering tools
C h a p t e r 3 , W o r k i n g w i t h y o u r d a t a 31 the following engineering tools: Aggregates, Decodes, Expressions, Numeric Ranges, Quantile, Parametric, and Ranking.
Aggregating values
Aggregates supports aggregating, or grouping, values in a data field. You can aggregate values from one field in any table. For example, create an aggregate using the Count function in the Order field of the Customer table to see how many orders each customer placed.
How to create an aggregate
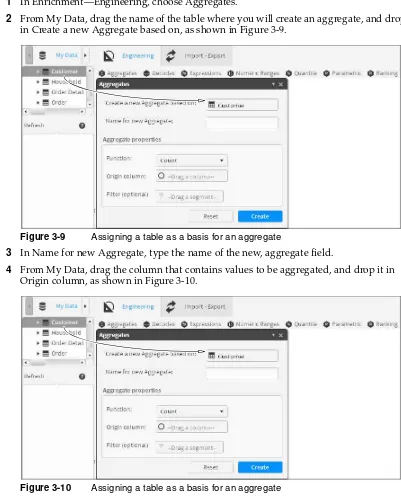
1 In Enrichment—Engineering, choose Aggregates.
2 From My Data, drag the name of the table where you will create an aggregate, and drop it in Create a new Aggregate based on, as shown in Figure 3-9.
Figure 3-9 Assigning a table as a basis for an aggregate
3 In Name for new Aggregate, type the name of the new, aggregate field.
4 From My Data, drag the column that contains values to be aggregated, and drop it in Origin column, as shown in Figure 3-10.
5 In Function, select one of the following aggregate functions:
■ Average
■ Count
■ First
■ Last
■ Maximum value
■ Mean (integer)
■ Mean (real)
■ Minimum value
■ Quadratic sum
■ Standard deviation
■ Sum
6 Choose Create.
7 In My Data, review the new aggregate to verify your selections.
For example, to aggregate orders placed by Customers in London, select Count in Function, drag Order No. from Customers and drop Order No. in the Origin column.
How to aggregate totals for a specific group
1 In Enrichment—Engineering, choose Aggregates.
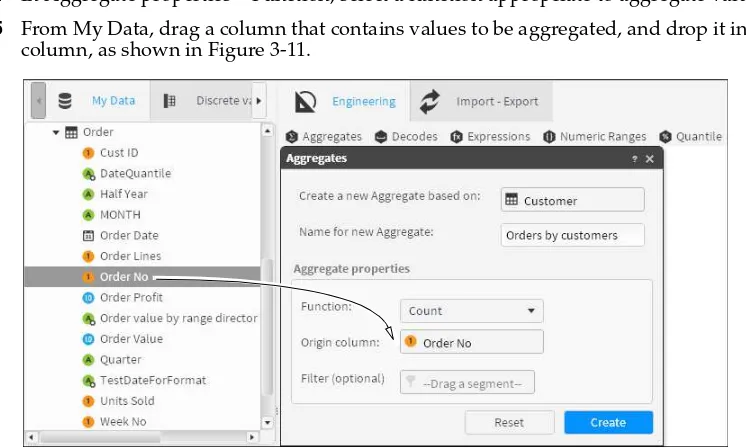
2 From My Data, drag a table on which to base the new aggregate, and drop it in Aggregates, as shown in Figure 3-11.
3 In Name for new Aggregate, type the name of the new, aggregate field.
4 In Aggregate properties—Function, select a function appropriate to aggregate values.
5 From My Data, drag a column that contains values to be aggregated, and drop it in Origin column, as shown in Figure 3-11.
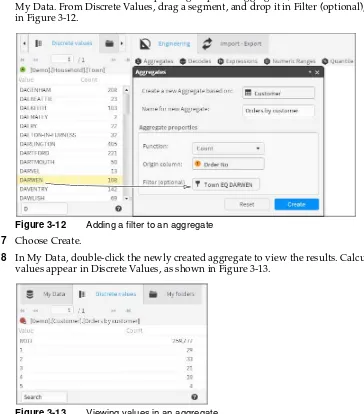
C h a p t e r 3 , W o r k i n g w i t h y o u r d a t a 33 6 To create a filter that defines a specific group to be aggregated, double-click a column in
My Data. From Discrete Values, drag a segment, and drop it in Filter (optional), as shown in Figure 3-12.
Figure 3-12 Adding a filter to an aggregate
7 Choose Create.
8 In My Data, double-click the newly created aggregate to view the results. Calculated values appear in Discrete Values, as shown in Figure 3-13.
Figure 3-13 Viewing values in an aggregate
Decoding a field name
You can decode any field that contains up to 100 discrete values. For example, gender is usually encoded as M and F, or even as 0 and 1. Decodes supports changing the name to something more recognizable, such as Male and Female.
How to create a decode
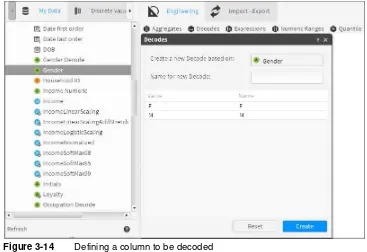
1 In Enrichment—Engineering, choose Decodes.
Figure 3-14 Defining a column to be decoded
3 In Name for new Decode, type a name for the decoded column.
4 To edit each field name, double-click a value in Name. Next, type any character, except the following characters, in the highlighted name field, as shown in Figure 3-15:
/ \ º ª - accents, dieresis,?, !, *, @, #, &, $, o, ñ
Figure 3-15 Providing a new name for a decoded column 5 Choose Create.
C h a p t e r 3 , W o r k i n g w i t h y o u r d a t a 35 Figure 3-16 Viewing values in a decoded field
Working with expressions
Use an expression to create a calculated field from one, or multiple fields in a database. You can create an expression that concatenates strings by joining several fields or a complex expression that uses mathematical operations, such as logarithms. For expressions generating a decimal field, you can specify precision up to six decimal places. For example, a typical calculated field can display customer orders based on the year in which each order was placed.
To further demonstrate, you can use the following equations to accomplish the listed tasks:
■ Concatenate Text (+): join two text fields.
[Demo].[Customer].[Title]+[Demo].[Customer].[Surname]
■ Concatenate (+): join two numeric fields or strings. STRING([CustomerID])+5+[DaysSinceLastOrder]-1
■ Mathematical functions (+, -, *, /): numeric fields can be added, subtracted, multiplied, or
divided.
STRING([Demo].[Customer].[Cust_ID]+[DEMO].[Customer].[Household_ID])
■ Boolean values: (logic 1, logic 0) assignment of Boolean values to fields, based on the
conditions that are established.
[Demo].[Customer].[Edats]EQ"Adults">0 or [Demo].[Customer].[Edats]EQ"Joves">0
■ Constants: a constant is a fixed value; in this case a constant function is one that gives a
single value for a set of variables.
[Demo].[Customer].[Household_ID]=1
This expression returns the value to position 1 in the Household_id field.
■ Conditional Boolean value (Boolean if statements): complex conditions can be tested, such
as whether the customer’s age has a specific characteristic. Returns either true or false. Instead of returning true or false, the expression can return other values, such as yes or no.
If([DEMO].[Order].[OrderDate]>[Demo].[Customer].[DOB],1,0)
To display help for a function, double-click the function. Figure 3-17 shows the help for the AGE function.
Expression grammar
The BIRT Analytics Loader supports the following operators described in Table 3-6.
Table 3-7 presents the complete list of the functions.
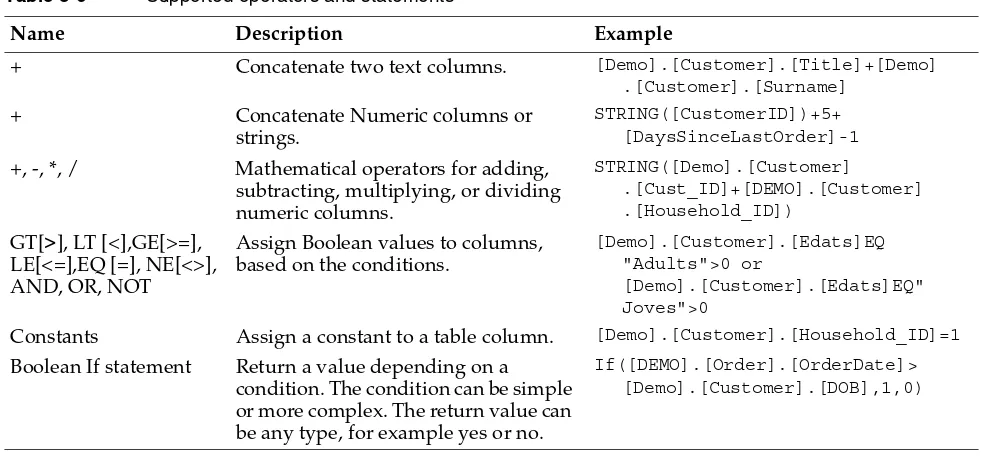
Table 3-6 Supported operators and statements
+, -, *, / Mathematical operators for adding, subtracting, multiplying, or dividing
Constants Assign a constant to a table column. [Demo].[Customer].[Household_ID]=1
Boolean If statement Return a value depending on a condition. The condition can be simple or more complex. The return value can be any type, for example yes or no.
If([DEMO].[Order].[OrderDate]> [Demo].[Customer].[DOB],1,0)
Table 3-7 Supported functions
Name and syntax Description
ABS ([db].[table].[column]) Returns the absolute value of a numeric column, regardless of sign. AGE ([db].[table].[column], date) Returns the age of each value on a specified date.
ALLMONTHS ([db].[table].[column])
Returns the year and the month of each one of the values of a date column.
ALLQUARTERS ([db].[table].[column])
Returns the year and the quarter of each one of the values of a date column.
CEIL ([db].[table].[column]) Given a continuous numeric column, it returns the next integer value. For example, given the value 3.6, the CEIL function returns 4.
CHR ([db].[table].[column]) Given an integer numeric column, it returns the associated ASCII (American Standard Code for Information Interchange) value.
CODE ([db].[table].[column]) Returns the ASCII code for the first value of the text string. It only works for ASCII string columns, not for Unicode columns.
COUNT ([db].[table].[column]) Returns the number of records in a table. DATE ([db].[table].[column],
format)
Creates a date column converting input data to a date. You can use the following syntax:
DATE(<string>|<unicode>,<date format:string>) DATETIME
([db].[table].[column], format)
Creates a date column converting input data to a datetime. You can use the following syntax:
DATETIME(<string>,<datetime format:string>) or DATETIME(<unicode>,<datetime format:string>) DAY ([db].[table].[column]) Returns the part for the day in a date column. DAYADD ([db].[table].[column],
[db].[table].[column2])
C h a p t e r 3 , W o r k i n g w i t h y o u r d a t a 37
DAYSTO ([db].[table].[column], date)
Returns the number of days between each value and a specified date.
DISTINCT
([db].[table].[column])
Returns the unique value or values in a column. For example, in a [Demo].[Customer].[Surname] column, it returns each surname stored in the column only once.
EXP ([db].[table].[column]) Returns the exponential value of each of the values of a numeric column. FLOOR ([db].[table].[column]) Returns the largest integer number less than or equal to the array. HOUR ([db].[table].[column]) Returns the time of each date.
IF (A, B, C) Returns a conditional function. A is the condition to be applied, B is the value to return if the condition is true, C is the value to return if the condition is false.
INSTR ([db].[table].[column], “string”)
Returns an integer that specifies the initial position of the first appearance of a string in another one. First value is 0.
INT ([db].[table].[column], format)
Returns the integer number that forms part of the value in a column, or converts the column that contains the numbers into a numeric column. You can use the following syntax:
INT(<string>|<unicode>, <thousands format:string>, <thousands grouping:integer|longint>)
ISNULL ([db].[table].[column]) Returns true for null values and false for not-null values. ISNOTNULL
([db].[table].[column])
Returns true for not-null values and false for null values.
KURT ([db].[table].[column]) Returns the kurtosis of a column, which represents how values are distributed around the mean.
LCASE ([db].[table].[column]) Returns a lowercase text string, turning uppercase characters into lowercase.
LEFT ([db].[table].[column], n) Returns the left part of a string of characters with the specified number of characters - where n is the quantity of characters.
The length of the strings in the column, resulting from an expression using the LEFT function, will be defined by the parameter provided in the function. The only exception that can occur is when the parameter is provided through a variable whose value is defined by a certain column. In this case the column result for LEFT has a length equal to the original column.
LEN ([db].[table].[column]) Returns the number of characters in a text column, returning a number for each value in the column.
LOG ([db].[table].[column]) Returns the natural logarithm (logarithm in base e) of the values of the column.
LOG10 ([db].[table].[column]) Returns the decimal logarithm (logarithm in base 10) of the values of the column.
LONGINT
([db].[table].[column], format)
Returns the long integer part of a column, or converts the column that contains a number into a numeric column. You can use the following syntax:
LONGINT(<string>|<unicode>, <thousands format:string>, <thousands grouping:integer|longint>)
LTRIM ([db].[table].[column]) Returns a string that is a copy of a string with no initial spaces (deletes any initial spaces).
(continues)
Table 3-7 Supported functions (continued)