Learning Python Data
Visualization
Master how to build dynamic HTML5-ready SVG charts
using Python and the pygal library
Chad Adams
Learning Python Data Visualization
Copyright © 2014 Packt Publishing
All rights reserved. No part of this book may be reproduced, stored in a retrieval system, or transmitted in any form or by any means, without the prior written permission of the publisher, except in the case of brief quotations embedded in critical articles or reviews.
Every effort has been made in the preparation of this book to ensure the accuracy of the information presented. However, the information contained in this book is sold without warranty, either express or implied. Neither the author, nor Packt Publishing, and its dealers and distributors will be held liable for any damages caused or alleged to be caused directly or indirectly by this book.
Packt Publishing has endeavored to provide trademark information about all of the companies and products mentioned in this book by the appropriate use of capitals. However, Packt Publishing cannot guarantee the accuracy of this information.
First published: August 2014
Production reference: 1180814
Published by Packt Publishing Ltd. Livery Place
35 Livery Street
Birmingham B3 2PB, UK.
ISBN 978-1-78355-333-4
www.packtpub.com
About the Author
Chad Adams
is a web and mobile software developer based in Raymore,About the Reviewers
Aniket Maithani
is a budding engineer and is currently pursuing a B.Tech in Computer Science and Engineering from Amity University. He is primarily interested in contributing to open source projects and believes in the FOSS/FLOSS ideology. He has been working in the field of embedded systems and openhardware for the last two years. Apart from coding and hacking around with regular stuff, he loves to play the guitar and write on his blog. He can be reached at [email protected].
There are a few people I would like to thank for helping me out. Firstly, my dad, who introduced me to the world of computers! Also, I would like to thank my professor Mr. Manoj Baliyan and my senior Mr. Anuvrat Parashar, who introduced me to the world of Python and its awesomeness. I would also like to thank my mentor, Satyakaam Goswami for always guiding me. Lastly, God Almighty for his kind grace and blessings.
Giuseppe Vettigli
is a data scientist who has worked in the research industry and academia for many years. His work is focused on the development of machine learning models and applications to utilize information from structured andunstructured data. He also writes about scientific computing and data visualization in Python on his blog at http://glowingpython.blogspot.com.
www.PacktPub.com
Support files, eBooks, discount offers, and more
You might want to visit www.PacktPub.com for support files and downloads related to your book.Did you know that Packt offers eBook versions of every book published, with PDF and ePub files available? You can upgrade to the eBook version at www.PacktPub. com and as a print book customer, you are entitled to a discount on the eBook copy. Get in touch with us at [email protected] for more details.
At www.PacktPub.com, you can also read a collection of free technical articles, sign up for a range of free newsletters and receive exclusive discounts and offers on Packt books and eBooks.
TM
http://PacktLib.PacktPub.com
Do you need instant solutions to your IT questions? PacktLib is Packt's online digital book library. Here, you can access, read and search across Packt's entire library of books.
Why subscribe?
• Fully searchable across every book published by Packt • Copy and paste, print and bookmark content
• On demand and accessible via web browser
Free access for Packt account holders
Table of Contents
Preface 1
Chapter 1: Setting Up Your Development Environment
7
Introduction 7 Setting up Python on Windows 7 Installation 9 Exploring the Python installation in Windows 15
Python editors 20
Setting up Python on Mac OS X 25 Setting up Python on Ubuntu 31 Summary 34
Chapter 2: Python Refresher
35
Python basics 35
Importing modules and libraries 40
Input and output 42
Generating an image 45
Creating SVG graphics using svgwrite 48
For Windows users using VSPT 48
For Eclipse or other editors on Windows 50
For Eclipse on Mac and Linux 50
Summary 59
Chapter 3: Getting Started with pygal
61
Why use pygal? 61
Installing pygal using pip 64
Installing pygal using Python Tools for Visual Studio 66
Building a line chart 67
Stacked line charts 69
Stacked bar charts 72
Horizontal bar charts 73
XY charts 74
Scatter plots 77
DateY charts 78
Summary 83
Chapter 4: Advanced Charts
85
Pie charts 85
Stacked pie charts 86
Radar charts 88
Chapter 5: Tweaking pygal
105
Country charts 105
Parameters 108
Legend at the bottom 109
Legend settings 111
Label settings 116
Chart title settings 120
Displaying no data 123
pygal themes 124
Summary 126
Chapter 6: Importing Dynamic Data
127
Pulling data from the Web 127
The XML refresher 130
RSS and the ATOM 131
Understanding HTTP 131
Using HTTP in Python 132
Parsing XML in Python with HTTP 134
About JSON 136
Parsing JSON in Python with HTTP 136
About JSONP 143
JSONP with Python 144
Chapter 7: Putting It All Together
145
Chart usage for a blog 145
Getting our data in order 146
Converting date strings to dates 149
Using strptime 150
Saving the output as a counted array 156
Counting the array 158
Python modules 160
Building the main method 161
Modifying our RSS to return values 162
Building our chart module 163
Building a portable configuration for our chart 164
Setting up our chart for data 165
Configuring our main function to pass data 167
Project improvements 168
Summary 170
Chapter 8: Further Resources
171
The matplotlib library 171
Installing the matplotlib library 172
matplotlib's library download page 173
Creating simple matplotlib charts 173
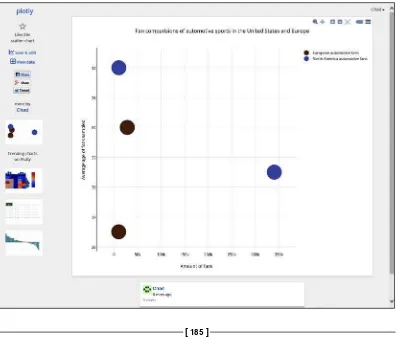
Plotly 179 Pyvot 186 Summary 187
Appendix: References and Resources
189
Links for help and support 189
Charting libraries 189
Editors and IDEs for Python 190 Other libraries and Python alternative shells 190
Preface
Greetings, this is Chad Adams, and welcome to Learning Python Data Visualization. In this book, we will cover the basics of generating dynamic charts and general graphics with code using the Python programming language. We will use the pygal library, a simple yet powerful graphing library written for Python, to explore the different types of charts we can create for various kinds of data.
We will also review the Python language itself and discuss working with file I/O and cover topics on working with data. We will then parse that data into a chart to create a dynamic charting application. We will also touch on more popular (and more advanced) libraries such as matplotlib and Plotly and build charts using these libraries and explore their features.
With this book, we will explore and build data visualizations using the basic toolsets used in many popular charting applications for the scientific, financial, medical, and pharmaceutical industries.
What this book covers
Chapter 1, Setting Up Your Development Environment, will discuss the installation process for Python on Windows, Mac, and Ubuntu. We will review the easy_install and pip package managers for Python and discuss common issues when installing third-party libraries for Python.
Chapter 3, Getting Started with pygal, will cover the basics of the pygal library, a simple charting library that generates charts in HTML5-ready SVG files. We will build some basic charts using the library, some of which include line charts, bar charts, and scatter plots.
Chapter 4, Advanced Charts, will cover more complex charts in the pygal library such as box plots, radar charts, and worldmap charts.
Chapter 5, Tweaking pygal, will discuss the optional settings we can give our pygal charts such as adjusting the font size and the positioning of labels and legends. We will also cover the French country map chart in the pygal library using it as an example.
Chapter 6, Importing Dynamic Data, will go over the finer points of pulling data from
the Web using the Python language and its built-in libraries and cover parsing XML, JSON, and JSONP data.
Chapter 7, Putting It All Together, will build a simple chart that takes what we learned from the past chapters and builds a dynamic pygal-based chart using data from the Web.
Chapter 8, Further Resources, will review some very popular charting libraries such as matplotlib and Plotly, go over building sample charts for each library, and cover resources for further reading.
Appendix, References and Resources, will list some popular data visualization libraries for Python as well as some helpful utilities.
What you need for this book
You will need Windows, Mac, or an Ubuntu system that is running Python 2.7 32-bit or Python 2.7 64-bit. You will need to have administrator rights on this system. You will also need a Python text editor such as Eclipse or Visual Studio with Python Tools. For Chapter 8, Further Resources, you will also need Python 3.4 or higher. Python 2.7 and 3.4 can be installed alongside each other.
Who this book is for
Conventions
In this book, you will find a number of styles of text that distinguish between different kinds of information. Here are some examples of these styles, and an explanation of their meaning.
Code words in text, database table names, folder names, filenames, file extensions, pathnames, dummy URLs, user input, and Twitter handles are shown as follows: "Create a text file called PyREADME.txt and save it to your project's directory."
A block of code is set as follows:
def main():
print("Hello, World") main()
Any command-line input or output is written as follows:
sudo pip install pygal
New terms and important words are shown in bold. Words that you see on the screen, in menus or dialog boxes for example, appear in the text like this: "Click on OK on both windows to save and reboot your PC again."
Warnings or important notes appear in a box like this.
Tips and tricks appear like this.
Reader feedback
Feedback from our readers is always welcome. Let us know what you think about this book—what you liked or may have disliked. Reader feedback is important for us to develop titles that you really get the most out of.
If there is a topic that you have expertise in and you are interested in either writing or contributing to a book, see our author guide on www.packtpub.com/authors.
Customer support
Now that you are the proud owner of a Packt book, we have a number of things to help you to get the most from your purchase.
Downloading the example code
You can download the example code files for all Packt books you have purchased from your account at http://www.packtpub.com. If you purchased this book elsewhere, you can visit http://www.packtpub.com/support and register to have the files e-mailed directly to you.
Errata
Although we have taken every care to ensure the accuracy of our content, mistakes do happen. If you find a mistake in one of our books—maybe a mistake in the text or the code—we would be grateful if you would report this to us. By doing so, you can save other readers from frustration and help us improve subsequent versions of this book. If you find any errata, please report them by visiting http://www.packtpub. com/submit-errata, selecting your book, clicking on the erratasubmissionform link, and entering the details of your errata. Once your errata are verified, your submission will be accepted and the errata will be uploaded on our website, or added to any list of existing errata, under the Errata section of that title. Any existing errata can be viewed by selecting your title from http://www.packtpub.com/support.
Piracy
Please contact us at [email protected] with a link to the suspected pirated material.
We appreciate your help in protecting our authors, and our ability to bring you valuable content.
Questions
Setting Up Your
Development Environment
Introduction
In this chapter, we will review how to set up the Python 2.7 32-bit edition on Windows, Mac, and Ubuntu Linux. We will walk through the Python interpreter and build a few Hello-World-style Python applications to ensure our code is working properly. This will be covered primarily in the Windows section of the chapter, but it will be reiterated in other OS sections.
We will also review how to install and use easy_install and pip, which are package managers that are commonly used in Python development. We will also review how to install lxml, which is a popular xml parser and writer that we will need in later chapters.
Setting up Python on Windows
If you're fairly new to Python, you might have heard that Python doesn't have the right build tools to run on Windows or that Python is optimized for Unix-based systems such as Mac OS X and Linux variations. In part, this is true; most libraries, including ones that are covered in this book, work better and are easier to install if you are on an operating system that isn't Windows.
The real problem that plagues developers is library compatibility, specifically, Python libraries that reference C-based code to achieve results that are not possible using the Python language directly. Unlike Mac OS X or Linux variations, Windows does not include a C compiler as a part of the OS. Typically, when a Python library author mentions Windows's "lack of build tools", this usually refers to Windows not including a C compiler.
Another issue is the command prompt; it's typical in Python development to install libraries and assets using the terminal or using the command prompt in Windows commands. The two common commands to install libraries are easy_install and pip. If you're not familiar, easy_install is a command-line based package manager for Python. It uses Python eggs, (a renamed .zip file specific to easy_install) to bundle
the scripts and required files for a library. The easy_install package manager is also an older package manager and has been in the Python tool belt for ages. It's typical to find older Python libraries using easy_install. The following screenshot shows you the PyPI website:
The following screenshot shows you the Python website:
Newer libraries are usually created using pip for two reasons. One, pip has more features than easy_install and two, pip libraries are searchable
on Python's official package site repository at https://pypi.python. org/pypi.
Installation
On the home page, you should see a download link as shown in the preceding screenshot. For Windows, we are looking for Python Version 2.7+ (the 32-bit Version). Go ahead and click on that link and you'll be taken to the download page:
Once you've downloaded the installer, double-click on the installer to run it. Follow the wizard and leave the defaults alone, particularly the path where Python is installed as shown in the preceding screenshot. Let the installer work through the installation and reboot your system.
Once you've done that, you'll want to click on Environment Variables, as shown in the preceding screenshot, and look for Path under System variables. These variables allow the command prompt to know what programs it has access to anywhere in your system. We have to edit the Path as shown in the following screenshot, select Path, and click on Edit:
With the Edit menu visible, type C:\Python27;C:\Python27\Lib\site-packages\;C:\Python27\Scripts\; (including the semicolon at the front to differentiate paths) at the end of the variable value. Click on OK on both windows to save the changes and reboot your PC again.
You are now in the Python interpreter; here, you can run simple one line scripts such as the following command:
print('Hello Reader!')
Downloading the example code
You can download the example code files for all Packt books you have
The next line will output Hello Reader!, showing your Python script print to the console, with the following >>> waiting for your next command. You can also process commands such as: 2 + 2, hit Enter, and you will see 4 on the next line. Let's try to save a variable to the prompt; type the following command on the next line:
authorsName = 'Chad'
Press Enter. Then, type the following command and press Enter again:
print(authorsName)
The output is shown in the next screenshot:
Now, your command prompt will look like the preceding screenshot. Notice on the resulting line that Chad is the output for the authorsName Python variable. This means that you've installed the Python compiler correctly! We've confirmed that Python works on Windows by testing the function object, the math object, and the variable objects.
Exploring the Python installation in
Windows
Now that we have reviewed the command line on Windows, we need to know a few other things before we start writing code. Let's start with where Python and any libraries are installed on your machine. Open Windows Explorer and navigate to C:\Python27, as shown in the following screenshot:
Inside the Python27 directory, you can see the python.exe file; this is the application that our Path in System variables looks for to run Python scripts and commands. This folder also contains other libraries that are to required be run by Python, including libraries downloaded from easy_install or pip.
Next, let's pull down a few libraries we will need for this book. Python 2.7 on Windows pip and easy_install are included with Python's Windows Installer by default. First, we will need the lxml library. Now, on Windows, the lxml library is a very popular C-based XML parser and writer library for Python libraries and is notoriously incompatible with Windows systems due to its C-based implementation. Let's install the lxml library before pulling packages that might depend on this, staring with lxml, as shown in the following screenshot:
[ 17 ]
After lxml is installed, we will set up easy_install and pip. First, let's download easy_install and install it. The steps are as follows:
1. Navigate your browser of choice to
https://pypi.python.org/pypi/setuptools.
2. Then, download the ez_setup.py file.
3. Save the file to C:\Python27\ez_setup.py. You can find the file on the page here, as shown in the following screenshot:
Now, open your command prompt again with administrator privileges, then type the following command, and press Enter:
cd c:\Python27
Next, type the following command and press Enter:
When you're finished, your command prompt should look like the following screenshot:
Now, let's test easy_install and install pip at the same time! Again, open the command prompt and set your directory like you did previously:
cd c:\Python27
Then, type the following command and press Enter:
If you're successful, your command prompt should look something like the following screenshot:
With that done, let's test pip! We want to try to install a library called
BeautifulSoup. It's a common Python library for scrapping HTML content. We won't be using BeautifulSoup but we need to test the pip installation, and BeautifulSoup is a good library that works with most installations. To install BeautifulSoup in your console while still it's open and the path is still pointing to your C:\Python27 directory, type the following command:
You'll see a message at the end, as shown in the following screenshot:
Python editors
We have now installed the necessary libraries and frameworks that are required to build Python scripts, so let's pick a code editor. For first-time (and even veteran Python) developers, I recommend an IDE as an editor of choice over a plain text editor. This is mainly for two reasons. One, an IDE typically includes code hinting of some kind to give the developer an idea of what Python packages are available or even installed on the developer's system. Two, most good IDEs include Python-specific code-documentation templates and helpers that help write large code bases.
To install Python Tools for Visual Studio, grab the installer from http://pytools. codeplex.com/ (shown in the preceding screenshot). Also, if you don't own Visual Studio, the Python Tools can be installed on Visual Studio for Desktop or Visual Studio for Web, which are free downloads by Microsoft. You can download the express editions at http://www.visualstudio.com/products/visual-studio-express-vs.
If you intend to use the express editions, I recommend that you download Visual Studio Express for Web, since we will use some HTML and CSS later in the book.
You might also notice IronPython at http://ironpython.net/. IronPython is Python optimized for Windows with access to the .NET libraries, which means that you can access .NET properties with Python, such as System.Windows.Forms.
For this book, we will use CPython, (typically referred to as normal Python libraries with nothing added). Keep in mind that some libraries written in Python might or might not work in IronPython, depending on its dependencies.
Once you've installed the Python Tools for Visual Studio, open Visual Studio, create a new project under Python, choose Python Application, and name it Pyname, as shown in the preceding screenshot. Right-click on the Pyname project and click on Properties. Set your interpreter to Python 2.7 and click on Save in the toolbar, as shown in the following screenshot:
Let's write our authorName script that we used earlier, and run it in Visual Studio. Type the following into the Pyname.py file:
authorName = ('Chad') print(authorName)
Now hit Start and you'll see the command prompt automatically launch with Chad printed on the screen. Success; you just wrote Python in Visual Studio!
In this section, we covered the following topics:
• Installing Python in Windows • Installing easy_install and pip
• Installing lxml, a common Python library
Setting up Python on Mac OS X
In this section, we will review the Eclipse IDE on OS X with PyDev 3.0 and review using easy_install and pip using OSX. First, install Python by going to https://www.python.org/ and downloading the 2.7.7 (or higher) 32-bit .dmg installer.
Once it's installed, open the terminal and test easy_install. Since easy_install is included by default, we can use easy_install to install pip. Type the following command in your console:
sudo easy_install pip
[ 27 ]
This should look something like the following screenshot; notice the version number in the interpreter to confirm which version is active.
Now, let's test the interpreter; try typing the following command:
print('Hello Reader!')
The output should be Hello Reader!. Now, let's try our authorName variable script (shown in the following screenshot) to confirm that variables in Python are being saved. Type both lines shown in the following screenshot, and it should look like the following example. If so, congrats; Python and its base libraries are installed!
With Python installed, we can now focus on an editor. There are several Python IDEs out for OS X, Aptana, and Pycharm, but the one we will use (and the one that tends to be popular among Python developers) is PyDev for Eclipse. At the time of writing this, Eclipse Kepler (4.3.2) has released, as has PyDev Version 3.0. Both require Java 7 and JDK 7 or higher installed for PyDev to work properly. So, before installing Eclipse and PyDev, install the latest JRE and JDK by visiting the following links:
• http://java.com/en/download/
Once you've installed both Java runtime and JDK, reboot your Mac and navigate your browser of choice to http://www.eclipse.org and download the Eclipse Kepler (4.3.2) classic edition (32-bit or 64-bit, depending on your system). The classic edition is Eclipse by itself, with no plugins or project types included. Once this is done, extract the Eclipse .zip file to a folder on your desktop and open the Eclipse
application. On launching Eclipse the first time, set your workspace path and click on OK. Eclipse will reboot and relaunch Eclipse. Also on Safari, we might get a Plug-in blocked for this site message. To continue, the user must click on Trust. This is a security measure to confirm that the user wants to install an external package or a plugin. Click on Trust to install.
Also, you'll need the JDK and Java 7 runtime or higher, since it's required for the current version of PyDev. The process for the OS X installation should be the same.
Click on Install Now and follow the prompts, including approving the certificate by selecting the I agree radio button for PyDev and clicking on Finish, followed by quitting Eclipse. Once Eclipse is restarted, you can change the IDE for Python development by navigating to Window | Open Perspective | Other | Pydev and clicking on OK.
Next, let's configure our interpreter so that when we run our Python code, the IDE can process our run requests. The easiest way is in Eclipse.
Navigate to Window | Preferences | PyDev | Interpreter (Python/Jython/ IronPython).
Then, run Auto Config by clicking on Auto Config in the interpreter window. Your paths will be set up automatically. If you run into an issue, you can set it manually and point to the executable by navigating to Library | Frameworks | Python. Framework | Versions | 2.7 | bin | python2.7-32.
Now, let's write some code with Eclipse. With Eclipse restarted, navigate to
Create a project with the Pyname name, as shown in the following screenshot. Next, create a pyname.py file in the project explorer on the right.
Finally, type the following code as shown in the following screenshot and click on Run. If successful, you will see Chad in the output window.
Setting up Python on Ubuntu
Linux-based operating systems such as Ubuntu are Python's home in many ways. The Ubuntu marketplace is written in Python, and many Linux apps usually have a Python code base. Ubuntu features many of the same terminal commands OS X uses, if not the same commands. For Ubuntu, we will focus on Ubuntu 13.10. If you're using a derivative of Ubuntu, Lubuntu, Xubuntu, or Linux Mint, there are a few points that need to be kept in mind.
Most of these commands should be the same, with a few minor differences depending on your setup. Reach out to your search engine of choice if you run into issues loading each software component. The same can be said for Debian or Red Hat-based Linux distros.
Like OS X, you'll need the Java 7 runtime or higher and JDK 7 runtime or higher. Ubuntu does not include these in its included package manager, but you can install them via the command line.
The good news is that Python 2.7 is included with Ubuntu 13.10, so we will not need to install Python. We can even test this by opening the terminal and typing python in the Bash prompt, as shown in the following screenshot:
The easy_install and pip Python package managers are commonly used to install and update our packages. Next, grab both easy_install and pip, and install both of these tools using the following commands:
sudo apt-get install python-setuptools sudo apt-get install python-pip
Remember, in Ubuntu the sudo command will ask for a password before installing the python-setuptools and python-pip. Now, if this is successful, the terminal should return the following message, as shown in the following screenshot:
Next, before installing Eclipse with PyDev, let's download Java 7 and JDK. To do this, we will add it to our system package repository and install Java. Open the terminal and type the following commands:
sudo add-apt-repository ppa:webupd8team/java sudo apt-get update
Be sure to use the keyboard keys on the licensing agreement in the terminal, as shown in the following screenshot:
When this is complete, you can test the installation by typing Java –version in the terminal. This command will return the installed version of Java.
Now, let's install Eclipse and PyDev. Navigate to http://www.eclipse.org/ using your browser of choice, and download Eclipse Classic. Unpack the download and open Eclipse, then select a workspace path, and click on OK.
At the time of writing this, there is a bug for Eclipse's menus being reskinned in Ubuntu. If you're experiencing this issue, check online for a command-line fix, as this can vary between updates. Ubuntu 14.04 LTS is
planned in order to have this bug resolved in the release.
Assuming everything is installed properly, you'll see PyDev in the Preferences section of Eclipse.
One final note on Ubuntu: since Ubuntu has its own package manager, apt-get, we can install packages for Python using it as well, for example, using lxml:
sudo apt-get install python-lxml
Notice that we add a python- prefix before our package. This helps apt-get specify package types, since apt-get works with multiple languages.
At this point, you should be all set for the Python development. Try recreating our authorName script from our OS X and Windows sections.
Summary
Python Refresher
In this chapter, we'll go over some Python programming basics and common Python first- and third-party libraries used in Python development. In this chapter, we'll be working on Python Tools for Visual Studio, which works well for new Python developers, using standard 2.7 CPython. It will be fine if you're working on Mac, Linux Eclipse, or an editor of your choice. We will be using pip and easy_install in Visual Studio, but I will include notes for Mac and Linux commands as well.Python basics
Next, navigate to Solution Explorer and click on Add/Remove Environments. You'll see the prompt as shown in the following screenshot. If you have multiple Python installs, you'll be able to select which one you want to specify. Click on the
Python 2.7 environment and click on OK.
So what does this do? A common problem with Python development is that libraries installed on your host system using pip or easy_install are kept outside your project files. This makes using Python scripts with different libraries installed on one system unable to run on another system without the exact same setup. It will also update Visual Studio's IntelliSense for any Python libraries installed as best as it can.
Now look at your Solution Explorer. You'll see that Python 2.7 has been added under Python Environments. You can see where the copied environment is saved in your project by right-clicking on Python 2.7 and clicking on Open Folder in File Explorer. You'll see a Lib folder with a subfolder called site-packages that has been created with its own lib structure for third-party modules and libraries.
Now let's write some code by starting with the canonical Hello World application for Python. Type in the following code in your editor and click on Start at the top:
[ 37 ]
Many small Python scripts are written this way with no structure or containment. This can be an issue as your application gets bigger. Let's wrap this in a function. Type the following code in your editor again, and click on Start at the top:
#A simple python function. def main():
print("Hello, World")
main() #Called after main() is loaded into memory.
Here, we have created a function called main() and included our print statement inside it. On the next line, we called main() to trigger the console to print Hello World. If you're coming from a C# or JavaScript background, this may look a little
funny, and you're right to think so. Python is a very loose language—there are no braces wrapping the function and no semicolons to terminate a line of code.
This keeps typing to a minimum, which is great, but for those who have never coded Python before, this can cause issues. Python is very specific on how its code is structured in order for it to work. Remember that at the start of the book, errors like these can trip up development. Let's look at an example:
#A simple python function. def main():
print("Hello, World") '''A function needs to be indented and not be further away more than one line break.'''
main()
So far, this is working well for a small Python script, but let's start moving our code to a more object-oriented structure. Now, we want to wrap our main()
function and have it trigger with one of our Python built-in script events, specifically, our __main__ event. Note the double underscores, which indicate that it's a built-in
event in Python. Here's an example of the __main__ event being triggered on the main() function:
#Same function as before. def main():
print("Hello, World")
if __name__ == '__main__': #Here Python checks if the runtime event __main__ is called if so run the code below.
main()
You can see that we check the __name__ event for __main__; if it is present, the function or functions are executed. This is similar to a private void function in C# or window.onload in JavaScript. It's also important to wrap functions this way should you want to create your own Python module library, so that each can be called only when the module is fully loaded and not before.
Now, let's add a parameter so we can reuse our main() function. Here, I'll add the username to the main() function so I can pass a string to our Helloprint statement:
#Main function with passed in parameter. def main(readersname):
print("Hello, " + readersname)
if __name__ == '__main__': main('Chad')
Note that you can append strings using + just as when using JavaScript or C#. You also have the option of string formatters in Python. Here's the preceding code with a string formatter passing in our readersname parameter:
#Here we use string formatting to better construct our strings. def main(readersname):
print("Hello, %s" % readersname)
Let's add another parameter to our main() method. This time, we will use a number, specifically an integer. Let's pass the number 35 as a set number of pages the reader has read and update our print() statement to include both:
#Main function with two passed in parameters. def main(readersname, amt):
print("Hello, " + readersname + ", you have read " + str(amt) + " pages.")
if __name__ == '__main__': main('Chad', 35)
Run the script and the output will be Hello, Chad, you have read 35 pages.. Next, let's use string formatting here rather than using string concatenation. I've changed the string concatenation to a string formatter using %i to indicate that the format is an integer:
#Here we use string formatting to better construct our strings. def main(readersname, amt):
print("Hello, %s, you have read %i" % (readersname, amt))
if __name__ == '__main__': main('Chad', 35)
String formatting can also help parameters output in unique ways. Let's say we wanted to show 35 as a float with decimal points. We can change our string integer formatter %i to a float formatter, %f. Look at this example:
#Let's format the string to output a float with decimal places. def main(readersname, amt):
print("Hello, %s, your total pages read are %f." % (readersname, amt))
If we run the Python script, you'll see the output Hello, Chad, your total pages read are 50.000000.. As we can see, the integer value we passed is now 50.000000 with our float formatter modifying our string without any conversion
code. Now what if we wanted this to display only two decimal points? Well, we can tweak our modifier and specify how many decimal points as shown in the following code:
#Let's format the string to output a float with two decimal places. def main(readersname, amt):
print("Hello, %s, your total pages read are %0.2f." % (readersname, amt))
if __name__ == '__main__': main('Chad', 50)
If we run the Python script now our output looks like this: Hello, Chad, your total pages read are 50.00.
Formatters work on floats to integers as well; look at this code sample:
def main(readersname, amt):
print("Hello, %s, your total pages read are %i." % (readersname, amt))
if __name__ == '__main__': main('Chad', 50.652)
Now, let's look at our result: Hello, Chad, your total pages read are 50.. We notice that it removed the decimal places and even though the .652 value should round our 50 integer to 51, it didn't. The integer formatter simply trimmed the value and didn't round up the value. This is very important to keep in mind for integer formatters.
This is great. Now we have a quick and easy way to convert values to floats (decimal points) and back to integers again should we need to convert values in our charts later on. Remember that Python is a dynamically-typed language, meaning that all variables can be any type without specification, and the Python interpreter assigns a type based on what's available. Now that we have a handle on functions and strings, let's take a look at some common libraries to help us understand file inputs and outputs.
Importing modules and libraries
Recall that in Chapter 1, Setting Up Your Development Environment, we covered installing pip and easy_install. Well, pip at least is a Python library, but one thing you may not recollect is that in that chapter, we in fact installed many libraries and modules. If you recall, we also installed the Python language interpreter and tools from https://www.python.org/. Our install came with hundreds of bundled libraries to be used. These are considered the general release libraries for Python. These are common language libraries used in Python development and tested by the Python Software Foundation for cross-platform development, which removes the need for OS-specific development in the core language.
Let's try importing the sys module. The sys module provides access to some variables used or maintained by the interpreter and to functions that interact strongly with the interpreter.
To import a module, type in the following on the topmost line of your Python script.
import sys
In Visual Studio, you can call up IntelliSense while you type by pressing Ctrl + Space bar. You can see IntelliSense filter more and more as you type. Also, whatever is highlighted will show Python docstrings that are written for that file to provide help and notes to the developer implementing those libraries.
If you're in Eclipse, the Eclipse PyDev also provides code hinting, just like
IntelliSense. Even the keyboard shortcut is the same, Ctrl + Spacebar. Now let's test
our import. Since sys can look up Python arguments and environment variables, let's check what platform we're running. Type in the following in your editor:
import sys
platform = sys.platform;
print("%s" % platform)
Now run the script and if you're in a Windows-based OS, your output would be win32; if you're on Mac OS X, your output would be darwin (this is referring to the FreeBSD Apple implementation of FreeBSD, which is the core of OS X). If you're on a Linux OS like Ubuntu, your output will be linux2.
Next, let's check the version using sys.version_info. The version_info list returns an array of what the current version used for this script, a major release number (int), a minor release number (int), and a micro release number (int). To test this, let's run the script shown in the following code:
import sys
pyversion_major = sys.version_info[0]; pyversion_minor = sys.version_info[1]; pyversion_micro = sys.version_info[2];
print("Python version: %s.%s.%s" % (pyversion_major, pyversion_minor, pyversion_micro))
Run the script and your output should be Python version: 2.7.6 or a newer version of Python 2.7. Now that we have a grasp on imports, let's start with the basics of Python file I/O using the os module with its user and path functions.
Input and output
The os module is one of the most used modules in Python mostly because of how it handles getting common filepaths cross-platform. Let's demonstrate how we can read files. Create a text file called PyREADME.txt and save it to your project's directory. Copy the following text in the PyREADME.txt file and save the file:
Hello Reader,
This copy is being read in Python, and saved as a string to a variable.
Once saved, it should look like the following screenshot:
Now, in your Python editor, we will import the os module by including import os on the topmost line and then add the following code. Be sure your PyREADME.txt file is in the same directory as your running Python script.
import os
#Open the file to be read.
openFile = os.open('PyREADME.txt', os.O_RDONLY )
#Save the file's inner content to a Python variable string. This take two parameters, the file to be opened and how many characters to read. readmeText = os.read(openFile, 100)
If everything is successful, your output window should show what's in the next figure.
If you are having issues, double-check your file type and see if you have file extensions such as PyREADME.txt.
Now let's review our code. We open our file using the open() function, and we have two parameters: our file name with an extension and an r string. The r string tells the open() method what permissions we have when working with the file. After
we open the file, we read the file and print it to the console. Lastly, we close our
openFile; this keeps us from having a potential memory leak, since our file I/O
won't close until we tell it to close.
Next, let's create a text file. We will have Hello World as its content, and name it content.txt. Replace your Python file with this bit of code:
import os
txtContent = 'Hello World'
openFile = open('content.txt', 'w') #Open the file to be written. readmeText = openFile.write(txtContent) #Write the file's inner content to the text file.
If successful, you should have a new text file with Hello World written in the file,
as shown in the next screenshot. You can find the file in the same directory as your Python script. Let's review the code. You'll notice that we changed our open()
permission's parameter to w, which means write-only, and we've set the filename to content.txt to indicate the name of the file (even if it doesn't exist prior to running the script). Beyond that, the only code that's changed is because we've swapped
openFile.read() with openFile.write(), telling Python to write a content string to the file rather than the output from a file.
Generating an image
To install PIL, we will need to use easy_install. If you have Mac OS X or Linux, the command is as follows:
sudo easy_install PIL
On Windows, you can run the following in the command line as the administrator in the Python directory:
easy_install PIL
Better yet, if you're using Visual Studio as your editor, set your project to Python 2.7 and click on Install Python Package under the Python Environments 2.7 instance. Type in pil under easy_install and check Run as Administrator as shown in the following screenshot:
If successful, you should be able to see pil included in your environments, as shown in the following screenshot:
In other environments such as Eclipse, you can check your import by using the following command:
[ 47 ]
This will import all modules from the PIL library. Now that we have that set, we are going to reuse the content.txt file we created earlier and generate an image with
its content. Since this is a bit more complicated, I'll move both steps into their own functions, as shown in the following code:
from pil import *
'''Save the file's inner content to a Python Variable string.''' readmeText = openFile.read()
'''Close the file to save memory.''' openFile.close()
'''Return the results to each as a reference variable.''' return openFile, readmeText
def generateImage():
'''Create our references.'''
img = Image.new("RGBA", (100, 80), "white")
'''Draw the images size and background to the screen.''' draw = ImageDraw.Draw(img)
'''Position the text with an x/y of 10 x 10, assign it the text value and text color of red.'''
output = draw.text((10, 10), readmeText, fill=(255,0,0,255)) '''Draw the text to the screen.'''
draw = ImageDraw.Draw(img) '''Save the image.''' img.save("output.png")
'''Return the results to each as a reference variable.''' return draw, img, output
'''trigger the read content function.''' openFile, readmeText = readcontent()
'''Generate our image.'''
We should now have a simple image like the one shown in the following screenshot. Feel free to modify the content.txt file for different results if you want to set the font size and font.
There is a bug in the current version of PIL through easy_install.
Some of the C-based code doesn't install properly. You may want to
check out pillow (a bundled version of PIL), which you can download here: https://code.google.com/p/rudix/downloads/
detail?name=pillow-1.7.7-0.pkg&can=2&q.
Creating SVG graphics using svgwrite
Before we close this chapter, let's take a look at how to generate SVG graphics that are based on vectors and computer-drawn lines and shapes that are scalable. To do this, we are going to use a Python library called svgwrite, which you can find here: https://pypi.python.org/pypi/svgwrite. Since this is a Python library on PyPi, we can use pip to install it.
For Windows users using VSPT
For Eclipse or other editors on Windows
Type in the following command in your command prompt with admin rights:cd C:\Python27 pip install svgwrite
The following is a screenshot of a command prompt for Windows:
For Eclipse on Mac and Linux
Open the terminal and type in the following command:sudo pip install svgwrite
Once you're ready, we will create a new project and Python file to generate our SVG file. Start by creating an import of svgwrite (in lowercase) as shown in the following code:
import svgwrite
Now let's reference the root svgwrite library and assign it to a variable that we can output as an SVG file. For this, we will use the Drawing method in svgwrite. The Drawing method enables us to create an SVG file. It's where we will drop our other objects such as text, lines, circles, and so on.
Let's take a look at the following example:
drawObj = svgwrite.Drawing('username.svg', profile='tiny', width=444, height=300)
Here, we have a drawObj variable and we have created an instance of the svgwrite object and called the Drawing method with a few parameters. Our first parameter is
a string where we declare our filename; in this case, username.svg. Note that we are not including a path, so for this script, the file will be saved in our project directory.
The profile attribute sets the base profile for SVG. You have two values that you can use: tiny and full. We can also set the width and height of the SVG tag with the width and height attributes.
Now, we have the base drawing object to draw shapes on. We will append the drawObj variable with an SVG text node. Take a look at the following line:
drawObj.add(drawObj.text('Test', insert=(0, 0), fill='red', font_ size=70, font_family='sans-serif', font_weight='bold'))
So here we have a series of parameters for our line. The first is a string for the text copy we want to write into the node and the next is a map (a map is a group of two parameters). This map sets the X and Y coordinates for our top-left text block element in the SVG node.
Following that is our fill color for this text block; in this case, we have a value of red. We can also use hex values here if we need it to be similar to a color hex in CSS. We also have three more parameters here: font_size, font_family, and font_weight, all of which are pretty self-explanatory. The font_size parameter uses simple int values to increase or decrease size. The font_family parameter will work with any regular font included on the system (no file path needed). And
Lastly, we will save the drawObj variable to a file using the save() function. This will save the file with the parameters we added. With that added, here's a completed script ready to run. Here's our save() function:
drawObj.save()
Now let's run the application from our IDE. Check your code as you follow along with the drawObj sample shown in the previous code, and assuming no errors are encountered, you should see a terminal (or a command prompt) window with Press Enter to continue… displayed just like the previous example, indicating success.
We can check this by going into our project directory and opening our newly generated username.svg file in our browser of choice and taking a look:
We're almost there. It looks like our SVG file is fine, but our text node is off-center. Remember our insert map, where we defined our X and Y coordinates? Let's tweak that; also, if you are working on Ubuntu or any other Linux distro, you may need to format the X and Y coordinates to fit your platform's browser:
drawObj.add(drawObj.text('Test', insert=(15, 64), fill='red', font_ size=70, font_family='sans-serif', font_weight='bold'))
There is our text, showing up as an SVG we generated. Note that we can even select the text. Since this is a text node, we should be able to highlight and even search it inside the web content. Having the output as SVG gives us a range of uses to create graphics.
Let's add a few lines around our text node, like an X and Y chart baseline, just to show some basic drawing. Before your save() function, include the line() functions as shown in in the following example:
import svgwrite
drawObj = svgwrite.Drawing('username.svg', profile='tiny', width=444, height=300)
drawObj.add(drawObj.text('Test', insert=(15, 64), fill='red', font_ size=70, font_family='sans-serif', font_weight='bold'))
drawObj.add(drawObj.line((10, 10), (10, 70), stroke=svgwrite.rgb(0, 0, 0, '%')))
drawObj.add(drawObj.line((10, 70), (370, 70), stroke=svgwrite.rgb(0, 0, 0, '%')))
drawObj.save()
Now we have the start of what would be a very simple chart exported as an SVG file that we can manipulate in HTML (using an SVG-compliant browser). Take a look at the following screenshot. Here, we can change the fill color using Chrome's Web Inspector:
Neat! So now we can print text and objects to an SVG file! We can draw lines, boxes, and circles in SVG, and as you see this come along, you start to get an idea how to build charts and graphs from scratch. Let's make this script a bit more functional, as though we were using this as an application. Let's reuse our text file reader module from our Hello World image script.
Before starting with this code, ensure your content.txt file is at the root of your
project directory. Next, let's reuse our readcontent() function from our earlier script. Breaking up that code in a module early on helps us reuse the code in new projects by copying and pasting!
Firstly, include your imports, which will contain svgwrite, just like before to access your text file:
import svgwrite
def readcontent():
[ 57 ]
openFile = open('content.txt', 'r')
'''Save the file's inner content to a Python Variable string.''' readmeText = openFile.read()
'''Close the file to save memory.''' openFile.close()
'''Return the results to each as a reference variable.''' return openFile, readmeText
'''trigger the read content function.''' openFile, readmeText = readcontent()
Now let's wrap our svgwrite in its own function and give it a parameter; in this case, username, to pass our content.txt file's output. Your Python script should resemble the following code:
drawObj = svgwrite.Drawing('username.svg', profile='tiny', width=444, height=300)
drawObj.add(drawObj.text(usrname, insert=(15, 64), fill='red', font_size=70, font_family='sans-serif', font_weight='bold'))
drawObj.add(drawObj.line((10, 10), (10, 70), stroke=svgwrite. rgb(0, 0, 0, '%')))
drawObj.add(drawObj.line((10, 70), (400, 70), stroke=svgwrite. rgb(0, 0, 0, '%')))
drawObj.save() return drawObj
openFile, readmeText = readcontent()
'''Grab the 'readmeText' file content and pass that into our createSVGText function.'''
drawObj = createSVGText(readmeText)
Rerun the script and let's take a look at our username.svg file:
There we are! We have created a dynamic script that pulls in data from a local text file and imports it into a chart-like layout and updates dynamically for each run. Play around with the options and see what you can make, and type other words into the content.txt file.
Summary
To wrap up, in this chapter, we reviewed some basic Python skills, variables, functions, and parameters; saw how to import libraries and how to install libraries on multiple IDEs; and generated PNG graphics using the Python Imaging Library, a common Python library.
We took a moment to understand paths and file I/O in Python, reading and writing to files and variables in our Python code. We also learned about SVG graphics: how to work with them and generate them in Python using the svgwrite library.
Now that we have done some basic generation of graphics with Python and worked with some basic imaging libraries, we are ready to start the data visualization part of this book.
As you now know, building graphics, let alone charts, can be a monumental task to perform without some helper libraries. Fortunately, Python provides library after library of tested and great-looking charting tools that are ready for your Python projects.
Getting Started with pygal
In this chapter, we will start with building some basic SVG charts using the pygal charting library for Python and look at common chart types and styles.
Why use pygal?
This is where pygal comes in; pygal (http://pygal.org/) is a Python-based SVG Charts Creator, developed by the Kozea Community (http://community.kozea. fr/), as shown in the following screenshot. This is a group dedicated to building quality open source libraries (mainly Python based, but for HTML5 projects as well).
The pygal library offers multiple charting options beyond what I consider standard charts: bar charts, line charts, and pie graphs. It includes a world map, funnel charts, radar charts, and box plots, to name just a few.
Take a look at the following screenshot of the documentation page for http://pygal.org/:
Many Python frameworks have some very picky dependencies that you might need for your project, but they might or might not work with your system.
The lxml library is the only library required for pygal, but it has a few issues depending on which operating system you are running your Python code on. I encourage you to reread the notes on lxml (specifically if you're running Windows) before we cover the installation of pygal.
With that covered, let's install pygal and build some charts!
Installing pygal using pip
First and foremost, if you haven't installed lxml, if you're working on Windows,
If you are a Windows user, type the following command:
pip install pygal
If you are a Mac or Ubuntu user, type the following command:
sudo pip install pygal
Next, open Eclipse with PyDev and create a new Python project, followed by a new file (the settings aren't important since this is a test project). Once the project is created, create the new file, call it importtest.py, and type the following:
import pygal
If successful, you should be able to press Ctrl + Space bar and see PyDev's code
Installing pygal using Python Tools for
Visual Studio
If you plan on working in Visual Studio for the remainder of the book, here's a note on installation: first, if you haven't already installed lxml, as noted in Chapter 1,
Setting Up Your Development Environment, then run easy_install with your Python environment in the Install Python Package window, as shown in the following screenshot:
Lastly, install the pygal library. Right-click on your environments and select Install Python Package, this time with pygal, as shown in the following screenshot:
Building a line chart
Line charts typically show how particular data changes at different intervals of time. In charting, this is the simplest chart that you can make, typically with the x and
y axes and each axis on the chart indicating time, value, or another parameter. Let's build a simple chart, in this case, on how many hits a website has received in the past two years (2012–2014). Take a look at the first line in the following code; this is a declarative line by the Python interpreter to specify the type of string encoding to the file. Also, you'll notice on line.x_labels that we use an inline function called range(). This lets us create an array of numbers, starting from the lowest number to the highest number; in the following case, 2012 and 2014 would print as 2012, 2013, 2014 in an array. Now, copy the following code into your project's main Python file:
# coding: utf-8 -*-import pygal
#create a new line chart. line = pygal.Line()
The following screenshot shows a basic pygal line chart output:
In your main project file where you ran your script, you can see the linechart.svg
file created. Open it, and your chart will look like what's shown in the preceding screenshot. To find the file, open the directory your project is in and find the
We will also see that the chart's timeline starts from 0.0 on 2013. If you take a look at the line.add() statement, the first parameter is None; this adds a spacer in our chart to push the chart data out a little bit rather than forcing the chart to start at 2012. This is a common trick to setting up chart layouts.
Another feature is that if you hover over the line label (in this case, Page views) the entire line will be highlighted, indicating which dataset you're viewing with that label. The pygal library will also review your data and emphasize certain lines on the data axis, such as 0.0, 50.0, and 100.0, to break up some of the chart lines for easier readability.
Code hinting support for the appearance of the line() function for pygal depends on the IDE you are using. The pygal library is written in a slightly unusual way when compared to most Python libraries. The library generates each chart type dynamically using a for loop, which checks each chart class in the pygal library. Due to this, IDEs that require static, hardcoded functions in Python will throw an error, but not break when they are run. In other words, using code hinting might or might not
work well depending on the editor you're using.
Stacked line charts
Stacked line charts work in a manner similar to traditional line charts, but they stack multiple sets of data over each other to show the specific values for a group. Copy the following code into your project's main Python file and run the file. Also, take note of the multiple add() functions on our chart. Since the chart has multiple datasets in one chart, we need to create a dataset for each:
# coding: utf-8 -*-import pygal
#create a new stacked line chart. line = pygal.StackedLine(fill=True)
line.title = 'Web hits in the past 2 years' #set chart title
line.x_labels = map(str, range(2012, 2014)) #set the x-axis labels. line.add('Site A', [None, 0, 12, 32, 72, 148]) #set values.
The following screenshot shows the results of our script:
Once rendered, your stacked chart will look like what's shown in the preceding screenshot. Open the directory your project is in to find the linechart.svg file.
Simple bar charts
Bar charts are typically used like line charts, but they fill the full area of the chart. They also help show values to categories of information. Let's build a simple bar chart, copy the following code into a new file called bar_chart.py, and run the script:
# coding: utf-8 -*-import pygal
#create a new bar chart. bar = pygal.Bar()
bar.title = 'Searches for term: sleep' bar.x_labels = map(str, range(2011, 2015)) bar.add('Searches', [81, 88, 88, 100]) bar.render_to_file('bar_chart.svg')
Stacked bar charts
Just like the line chart, stacked bar charts overlay different bars one over the other by data order. Let's copy the following code example and run this script:
# coding: utf-8 -*-import pygal
#Create a new stacked bar chart. bar = pygal.StackedBar()
bar.title = 'Searches for term: sleep' bar.x_labels = map(str, range(2011, 2015)) bar.add('Men', [81, 88, 88, 100])
bar.add('Women', [78, 84, 69, 92]) bar.render_to_file('bar_chart.svg')
The following screenshot shows the results of our script:
Horizontal bar charts
For the last bar chart type offered by pygal, we will use a horizontal chart and reuse our data from the simple bar chart. Horizontal bar charts are designed more to show data at one point in time. For this, we will remove our x_labels property since we only want a single month displayed, hence removing the years. Now, copy the following code and run the script:
# coding: utf-8 -*-import pygal
#create a new bar chart. bar = pygal.HorizontalBar()
bar.title = 'Searches for term: sleep in April' bar.add('Searches', [81, 88, 88, 100])
bar.render_to_file('bar_chart.svg')
XY charts
XY charts are typically used in scientific data to show multiple values at various points. They can display negative values as well. They also overlay multiple sets of values for easy readability. Let's build a simple XY chart with two points. Copy the following code into your Python file and run the application, and save your SVG file output as xy_chart.svg:
# coding: utf-8 -*-import pygal
xy_chart = pygal.XY()
xy_chart.add('Value 1', [(-50, -30), (100, 45)])
xy_chart.render_to_file("xy_chart.svg")
Note how pygal highlights the 0 lines on both the x and y coordinates; again, this is free styling provided by the pygal library to indicate negative values. Also, take note of the add() function, of how each value is noted as an (x, y) coordinate, grouped together in an array. Let's build another chart, this time with two plots; in this case, we build with Value 1 and Value 2. Copy the following code and run it:
# coding: utf-8 -*-import pygal
xy_chart = pygal.XY()
xy_chart.add('Value 1', [(-50, -30), (100, 45)]) xy_chart.add('Value 2', [(-2, -14), (370, 444)]) xy_chart.render_to_file("xy_chart.svg")
We will now see how to make a basic line plot in an XY chart, but what if we have multiple values on one line? Let's write one more XY chart with three values and six points per value. Let's look at the following code for this and run it:
# coding: utf-8 -*-import pygal
xy_chart = pygal.XY()
xy_chart.add('Value 1', [(-50, -30), (100, 45), (120, 56), (168, 102), (211, 192), (279, 211)])
xy_chart.add('Value 2', [(-2, -14), (370, 444), (391, 464), (399, 512), (412, 569), (789, 896)])
xy_chart.add('Value 3', [(2, 10), (142, 164), (184, 216), (203, 243), (208, 335), (243, 201)])
xy_chart.render_to_file("xy_chart.svg")
When it is finished, open the xy_chart.svg file; it should look like what is shown in the following screenshot:
Note how we can easily read each dataset. We can discern that Value 2 has the most values that are on the higher side, and also that Value 3 reached a higher point than Value 1 but dropped down quickly, which makes XY charts great for scientific data.
Scatter plots
Scatter plots work the same as XY charts, but they do not have lines that link together. In the pygal library, there is no "scatterplot" function to use this time. Instead, we simply reuse the XY chart function and set a parameter; in this case, stroke is equal to False (the default for stroke is True). Let's reuse our XY code from the last chart, add the stroke parameter, and take a look:
# coding: utf-8 -*-import pygal
xy_chart = pygal.XY(stroke=False)
xy_chart.add('Value 1', [(-50, -30), (100, 45), (120, 56), (168, 102), (211, 192), (279, 211)])
xy_chart.add('Value 2', [(-2, -14), (370, 444), (391, 464), (399, 512), (412, 569), (789, 896)])
xy_chart.add('Value 3', [(2, 10), (142, 164), (184, 216), (203, 243), (208, 335), (243, 201)])
xy_chart.render_to_file("xy_chart.svg")