DAFTAR LAMPIRAN
Pengungkapan ERM COSO
No. Enterprise Risk Management Dimentions A. Internal Environment
1 Is there a charter of the board?
2 Information on the code of conduct/ethics?
3 Information on how compensation policies align interest of managers with shareholders?
4 Information on individual performance targets?
5 Information on procedures for hiring and firing of board member and management?
6 Information on remuneration policy of board members and management? 7 Information on training, coaching, educational programs?
8 Information on training in ethical values? 9 Information on board responsibility?
10 Information on audit committee responsibility? 11 Information on CEO responsibilities?
12 Information on senior executive responsible for risk management? 13 Information on supervisory and managerial oversight?
B. Objective Setting
14 Information on company‟s mission? 15 Information on company‟s strategy?
16 Information on company‟s business objectives?
17 Information on adopted benchmarks to evaluate results? 18 Information on approval of the strategy by the board?
19 Information on the link between strategy, objectives, and shareholder value?
C. Event Identification Financial Risk
20 Information on the extent of liquidity? 21 Information on the interest rate?
22 Information on the foreign exchange rate? 23 Information on the cost of capital?
24 Information on the access to the capital market? 25 Information on long-term debt instruments? 26 Information on default risk?
27 Information on solvency risk? 28 Information on equity price risk? 29 Information on commodity risk?
Compliance Risk
30 Information on litigation issues?
31 Information on compliance with regulation? 32 Information on compliance with industry codes? 33 Information on compliance with voluntary codes?
34 Information on compliance with recommendation of Corporate Governance Technology Risk
35 Information on data management? 36 Information on computer systems?
37 Information on the privacy of information held on customers? 38 Information on software security?
Economical Risk
39 Information on the nature of competition?
40 Information on the macro-economy events that could affect the company? Reputational Risk
41 Information on environmental issues? 42 Information on ethical issues?
43 Information on health and safety issues?
44 Information on lower/higher stock or credit rating?
D. Risk Assessment
45 Risk assessment of the extent of liquidity? 46 Risk assessment of the interest rate?
47 Risk assessment of the foreign exchange rate? 48 Risk assessment of the cost of capital?
49 Risk assessment of the access to the capital market? 50 Risk assessment of long-term debt instrments? 51 Risk assessment of default risk?
52 Risk assessment of solvency risk? 53 Risk assessment of equity price risk? 54 Risk assessment of commodity risk? 55 Risk assessment of litigation issues?
56 Risk assessment of compliance wih regulation? 57 Risk assessment of industry codes?
58 Risk assessment of compliance with voluntary codes?
59 Risk assessment of compliance with recommendation of Corporate Govenance?
60 Risk assessment of data management? 61 Risk assessment of computer systems?
62 Risk assessment of the privacy of information held on? 63 Risk assessment of on software security?
64 Risk assessment of the nature of competition? 65 Risk assessment of environmental issues? 66 Risk assessment of ethical issues?
68 Risk assessment of lower/higher stock or credit rating?
69 Information on techniques used to asses the potential impact of events combining?
E. Risk Response
70 General description of processes for determining how risk should be managed?
71 Information on written guidelines about how risk should be managed? 72 Response to the liquidity risk?
73 Response to the interest rate risk?
74 Response to the foreign exchange rate risk? 75 Response to the risk related cost of capital? 76 Response to the access to the capital market? 77 Response to long-term debt instruments? 78 Response to litigation risk?
79 Response to default risk? 80 Response to solvency risk? 81 Response to equity price risk? 82 Response to commodity risk?
83 Response to compliance with regulation? 84 Response to compliance with industry codes? 85 Response to compliance with voluntary codes?
86 Response to compliance with recommendation of Corporate Governance? 87 Response to data risk?
88 Response to computer systems risk?
89 Response to the privacy of information held on customers? 90 Response to risk of software security?
91 Response to risk of competition? 92 Response to environemntal risk? 93 Response to ethical risk?
94 Response to health and safety risk?
95 Response to risk of lower/higher stock or credit rating?
F. Control Activites 96 Information on sales control?
97 Information on review of the functioning and effectiveness of controls? 98 Information on authorization issues?
99 Information on documents and record as control? 100 Information on independent verification procedures? 101 Information on physical controls?
102 Information on process control?
G. Information and Communications
104 Information on channels of communication to report suspected breaches of laws, regulations or other improprieties?
105 Information on channels of communication with customers, vendors, and other external parties?
H. Monitoring
106 Information on how processes are monitored? 107 Information on about internal audit?
34 NIRO
35 OMRE Sampel 27
36 PLIN Sampel 28
37 PUDP
38 PWON Sampel 29
39 PWSI
40 RBMS Sampel 30
41 RDTX Sampel 31
42 RODA Sampel 32
43 SIIP
44 SCBD Sampel 33
45 SMDM Sampel 34
46 SMRA Sampel 35
47 TARA 48 ACST
49 ADHI Sampel 36
50 DGIK Sampel 37
51 NRCA
52 PTPP Sampel 38
53 SSIA Sampel 39
54 TOTL Sampel 40
55 WIKA 56 WSKT
Perusahaan Yang Menjadi Sampel
5 BIPP Bhuwanatala Indah Permai Tbk
6 BKDP Bukit Darmo Property Tbk
7 BKSL Sentul City Tbk
8 BSDE Bumi Serpong Damai Tbk
9 COWL Cowell Development Tbk
10 CTRA Ciputra Development Tbk
11 CTRP Ciputra Property Tbk
12 CTRS Ciputra Surya Tbk
13 DART Duta Anggada Realty Tbk
14 DILD Intiland Development Tbk
15 DUTI Duta Pertiwi Tbk
16 ELTY Bakrieland Development Tbk 17 FMII Fortune Mate Indonesia Tbk
18 GMTD Gowa Makassar Tourism Development Tbk
19 JRPT Jaya Real Property Tbk
20 KIJA Kawasan Industri Jababeka Tbk
21 LAMI Lamicitra Nusantara Tbk
22 LPCK Lippo Cikarang Tbk
23 LPKR Lippo Karawaci Tbk
24 MDLN Modernland Realty Ltd Tbk
25 MKPI Metropolitan Kentjana Tbk
26 MTLA Metropolitan Land Tbk
27 OMRE Indonesia Prima Property Tbk 28 PLIN Plaza Indonesia Realty Tbk
29 PWON Pakuwon Jati Tbk.
30 RBMS Ristia Bintang Mahkotasejati Tbk
31 RDTX Roda Vivatex Tbk
32 RODA Pikko Land Development Tbk
33 SCBD Danayasa Arthatama Tbk.
34 SMDM Suryamas Dutamakmur Tbk
35 SMRA Summarecon Agung Tbk
36 ADHI Adhi Karya (Persero) Tbk
37 DGIK Nusa Konstruksi Enjiniring Tbk
38 PTPP PP (Persero) Tbk 39 SSIA Surya Semesta Internusa Tbk
2011 2012 2013 2011 2012 2013 2011 2012 2013 2011 2012 2013 2011 2012 2013 2011 2012 2013
1
APLN
0,33 0,33 0,33 3,00 3,00 3,00 0,47 0,47 0,62 0,53 0,30 0,63 30,01 30,35 30,61 0,50 0,51 0,48
2
ASRI
0,40 0,40 0,40 3,00 3,00 3,00 0,17 0,25 0,27 0,54 0,57 0,63 29,42 30,02 30,30 0,39 0,46 0,43
3
BAPA
0,33 0,33 0,33 3,00 3,00 3,00 0,38 0,34 0,34 0,45 0,45 0,47 25,72 25,79 25,89 0,37 0,39 0,37
4
BCIP
0,33 0,33 0,33 3,00 3,00 3,00 0,52 0,53 0,52 0,23 0,44 0,48 26,19 26,56 26,79 0,53 0,51 0,38
5
BIPP
0,50 0,33 0,33 3,00 3,00 3,00 0,37 0,31 0,40 0,62 0,53 0,23 26,01 25,91 27,05 0,50 0,51 0,37
6
BKDP
0,50 0,50 0,50 3,00 3,00 3,00 0,36 0,36 0,36 0,27 0,28 0,30 27,61 27,53 27,46 0,40 0,39 0,37
7
BKSL
0,50 0,43 0,38 3,00 3,00 3,00 0,30 0,34 0,34 0,13 0,22 0,35 29,30 29,45 30,00 0,48 0,44 0,43
8
BSDE
0,38 0,38 0,38 3,00 3,00 3,00 0,25 0,25 0,25 0,35 0,37 0,41 30,18 30,45 30,75 0,32 0,37 0,44
9
COWL
0,50 0,33 0,33 3,00 3,00 3,00 0,66 0,95 0,85 0,58 0,36 0,39 26,68 28,21 28,30 0,44 0,49 0,39
10 CTRA
0,50 0,40 0,50 3,00 3,00 3,00 0,31 0,39 0,31 0,34 0,44 0,51 30,08 30,34 30,63 0,42 0,40 0,42
11 CTRP
0,40 0,40 0,40 3,00 3,00 3,00 0,58 0,58 0,58 0,16 0,33 0,40 29,09 29,41 29,67 0,44 0,49 0,46
12 CTRS
0,50 0,50 0,50 3,00 3,00 3,00 0,63 0,63 0,63 0,45 0,50 0,57 28,89 29,12 29,38 0,42 0,44 0,36
13 DART
0,33 0,33 0,33 3,00 3,00 3,00 0,34 0,45 0,45 0,45 0,34 0,39 29,04 29,09 29,19 0,53 0,54 0,43
14 DILD
0,33 0,33 0,33 4,00 4,00 3,00 0,22 0,22 0,22 0,32 0,35 0,46 29,37 29,44 29,65 0,52 0,44 0,42
15 DUTI
0,33 0,33 0,33 3,00 3,00 3,00 0,85 0,89 0,89 0,31 0,22 0,19 29,28 29,52 29,64 0,33 0,39 0,43
16 ELTY
0,40 0,33 0,40 3,00 3,00 3,00 0,12 0,10 0,10 0,38 0,40 0,42 30,51 30,35 30,14 0,63 0,65 0,61
17 FMII
0,33 0,33 0,33 3,00 3,00 3,00 0,47 0,47 0,47 0,29 0,30 0,34 26,59 26,60 26,79 0,44 0,43 0,38
18 GMTD
0,40 0,20 0,33 3,00 3,00 3,00 0,33 0,33 0,33 0,65 0,74 0,69 26,90 27,53 27,90 0,43 0,41 0,31
19 JRPT
0,40 0,40 0,60 3,00 3,00 3,00 0,66 0,66 0,64 0,53 0,56 0,56 29,04 29,24 29,45 0,46 0,48 0,34
20 KIJA
0,50 0,33 0,50 3,00 3,00 3,00 0,23 0,18 0,13 0,37 0,44 0,49 29,35 29,59 29,74 0,41 0,40 0,36
FIN_LEV
FRM_SZE
ERM
No Kode Saham
IND_COM
AUD_COM
OWN_CON
2011 2012 2013 2011 2012 2013 2011 2012 2013 2011 2012 2013 2011 2012 2013 2011 2012 2013
21 LAMI
0,33 0,33 0,33 3,00 3,00 3,00 0,93 0,93 0,93 0,52 0,47 0,41 27,11 27,14 27,14 0,38 0,34 0,31
22 LPCK
0,60 0,50 0,57 3,00 3,00 3,00 0,42 0,42 0,42 0,60 0,57 0,53 28,34 28,67 28,98 0,47 0,54 0,50
23 LPKR
0,71 0,71 0,75 3,00 3,00 3,00 0,18 0,18 0,18 0,48 0,54 0,55 30,54 30,84 31,07 0,57 0,56 0,60
24 MDLN
0,50 0,50 0,40 3,00 4,00 3,00 0,22 0,30 0,30 0,51 0,52 0,52 28,51 29,16 29,90 0,35 0,47 0,50
25 MKPI
0,32 0,32 0,32 4,00 4,00 4,00 0,47 0,47 0,47 0,30 0,33 0,32 28,39 28,57 28,67 0,43 0,38 0,31
26 MTLA
0,33 0,33 0,33 3,00 3,00 3,00 0,38 0,38 0,38 0,22 0,23 0,38 28,18 28,33 28,67 0,51 0,50 0,51
27 OMRE
0,50 0,50 0,40 3,00 3,00 3,00 0,72 0,90 0,90 0,32 0,31 0,35 27,33 27,34 27,44 0,44 0,44 0,34
28 PLIN
0,33 0,33 0,33 3,00 3,00 3,00 0,25 0,38 0,30 0,46 0,43 0,48 29,07 29,00 29,05 0,45 0,53 0,48
29 PWON
0,33 0,33 0,67 3,00 3,00 3,00 0,22 0,21 0,21 0,59 0,59 0,56 29,38 29,65 29,86 0,44 0,47 0,50
30 RDTX
0,33 0,33 0,33 2,00 2,00 2,00 0,38 0,38 0,38 0,23 0,21 0,26 27,71 27,82 28,07 0,39 0,47 0,51
31 RBMS
0,33 0,33 0,33 3,00 3,00 3,00 0,36 0,36 0,36 0,08 0,07 0,20 25,64 25,75 25,79 0,40 0,44 0,45
32 RODA
0,33 0,33 0,33 3,00 3,00 3,00 0,69 0,69 0,68 0,36 0,44 0,37 28,43 28,52 28,64 0,42 0,53 0,53
33 SCBD
0,33 0,50 0,40 3,00 3,00 3,00 0,82 0,82 0,82 0,25 0,25 0,23 28,88 28,90 29,34 0,35 0,41 0,34
34 SMDM
0,33 0,67 0,33 3,00 3,00 3,00 0,74 0,74 0,62 0,16 0,20 0,27 28,53 28,60 28,71 0,45 0,44 0,41
35 SMRA
0,50 0,50 0,50 3,00 3,00 3,00 0,25 0,24 0,25 0,69 0,65 0,66 29,72 30,02 30,25 0,49 0,48 0,52
36 ADHI
0,40 0,33 0,33 3,00 3,00 3,00 0,52 0,51 0,51 0,84 0,85 0,84 29,44 29,69 29,91 0,53 0,56 0,60
37 DGIK
0,40 0,40 0,40 3,00 3,00 3,00 0,33 0,33 0,33 0,35 0,43 0,50 28,03 28,20 28,37 0,46 0,47 0,49
38 PTPP
0,33 0,33 0,33 4,00 4,00 4,00 0,51 0,51 0,51 0,79 0,81 0,84 29,57 29,78 30,15 0,54 0,41 0,51
39 SSIA
0,40 0,40 0,40 3,00 3,00 3,00 0,12 0,09 0,09 0,59 0,66 0,55 28,71 29,21 29,39 0,39 0,37 0,48
40 TOTL
0,33 0,33 0,29 3,00 3,00 3,00 0,57 0,57 0,57 0,64 0,66 0,63 28,27 28,36 28,43 0,60 0,56 0,56
FIN_LEV
FRM_SZE
ERM
No Kode Saham
IND_COM
AUD_COM
OWN_CON
Universitas
Sumatera
Hasil Olah Statistik
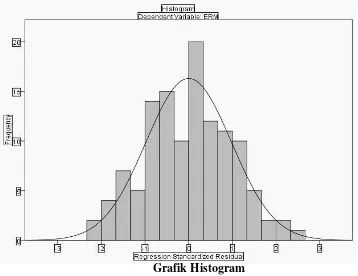
Grafik Histogram
Grafik Normal Probability Plot
Hasil Uji Kolmogorov - Smirnov
a. Dependent Variable: ERM
One-Sample Kolmogorov-Smirnov Test
Unstandardized
Residual
N 120
Normal Parametersa,b Mean ,0000000
Std. Deviation ,06737608
Most Extreme Differences Absolute ,043
Positive ,041
Negative -,043
Kolmogorov-Smirnov Z ,474
Asymp. Sig. (2-tailed) ,978
a. Test distribution is Normal.
b. Calculated from data.
Model Collinearity Statistics
Diagram Scatterplot
Hasil Uji Glejser
Coefficientsa
Model
Unstandardized Coefficients
Standardized
Coefficients
t Sig.
B Std. Error Beta
1 (Constant) ,034 ,084 ,401 ,689
IND_COM -,054 ,038 -,137 -1,425 ,157
AUD_COM -,009 ,011 -,072 -,769 ,444
OWN_CON -,023 ,017 -,129 -1,359 ,177
FIN_LEV ,030 ,022 ,132 1,361 ,176
FRM_SZE ,002 ,003 ,081 ,803 ,424
Hasil Uji Runs
Runs Test
Unstandardized
Residual
Test Valuea ,00574
Cases < Test Value 60
Cases >= Test Value 60
Total Cases 120
Number of Runs 65
Z ,733
Asymp. Sig. (2-tailed) ,463
a. Median
Hasil Uji Durbin – Watson
Hasil Analisis Regresi Berganda
Coefficientsa
Model
Unstandardized Coefficients
Standardized
Coefficients
T Sig.
B Std. Error Beta
1 (Constant) ,182 ,152 1,195 ,234
IND_COM -,004 ,068 -,006 -,065 ,948
AUD_COM -,023 ,021 -,097 -1,087 ,279
OWN_CON -,055 ,030 -,166 -1,834 ,069
FIN_LEV ,078 ,039 ,183 1,993 ,049
FRM_SZE ,011 ,005 ,209 2,188 ,031
\
a. Predictors: (Constant), FRM_SZE, AUD_COM, OWN_CON, IND_COM, FIN_LEV
Nilai Koefisien Determinasi
b. Predictors: (Constant), FRM_SZE, AUD_COM, OWN_CON, IND_COM, FIN_LEV
Hasil Uji Sginifikansi Simultan
ANOVAb
Model Sum of Squares df Mean Square F Sig.
1 Regression ,096 5 ,019 4,037 ,002a
Residual ,540 114 ,005
Total ,636 119
a. Predictors: (Constant), FRM_SZE, AUD_COM, OWN_CON, IND_COM, FIN_LEV
b. Dependent Variable: ERM
Hasil Uji Signifikansi Parsial
Coefficientsa
Model
Unstandardized Coefficients
Standardized
Coefficients
T Sig.
B Std. Error Beta
1 (Constant) ,182 ,152 1,195 ,234
IND_COM -,004 ,068 -,006 -,065 ,948
AUD_COM -,023 ,021 -,097 -1,087 ,279
OWN_CON -,055 ,030 -,166 -1,834 ,069
FIN_LEV ,078 ,039 ,183 1,993 ,049
FRM_SZE ,011 ,005 ,209 2,188 ,031