Volume 12, Number 6, June 2015 (Serial Number 116)
Jour nal of US-China
Public Administration
Dav i d
David Publishing Company
Publication Information:
Journal of US-China Public Administration is published every month in print (ISSN 1548-6591) and online (ISSN 1935-9691) by David Publishing Company located at 1840 Industrial Drive, Suite 160, Libertyville, IL 60048, USA.
Aims and Scope:
Journal of US-China Public Administration, a professional academic journal, commits itself to promoting the academic communication about analysis of developments in the organizational, administrative and policy sciences, covers all sorts of researches on social security, public management, educational economy and management, national political and economical affairs, social work, management theory and practice etc. and tries to provide a platform for experts and scholars worldwide to exchange their latest researches and findings.
Editorial Board Members:
Andrew Ikeh Emmanuel Ewoh (Texas Southern University, USA) Beatriz Junquera (University of Oviedo, Spain)
Lipi Mukhopadhyay (Indian Institute of Public Administration, India)
Ludmila Cobzari (Academy of Economic Studies from Moldova, Republic of Moldova) Manfred Fredrick Meine (Troy University, USA)
Maria Bordas (Corvinus University of Budapest, Hungary) Massimo Franco (University of Molise, Italy)
Patrycja Joanna Suwaj (Stanislaw Staszic School of Public Administration, Poland) Paulo Vicente dos Santos Alves (Fundação Dom Cabral—FDC, Brazil)
Robert Henry Cox (University of Oklahoma, USA) Sema Kalaycioglu (Istanbul University, Turkey)
Manuscripts and correspondence are invited for publication. You can submit your papers via Web Submission, or E-mail to [email protected]. Submission guidelines and Web Submission system are available at http://www.davidpublisher.com
Editorial Office:
1840 Industrial Drive, Suite 160, Libertyville, IL 60048
Tel: 1-323-984-7526; 323-410-1082 Fax: 1-323-984-7374; 323-908-0457 E-mail: [email protected]; [email protected]
Copyright©2015 by David Publishing Company and individual contributors. All rights reserved. David Publishing Company holds the exclusive copyright of all the contents of this journal. In accordance with the international convention, no part of this journal may be reproduced or transmitted by any media or publishing organs (including various websites) without the written permission of the copyright holder. Otherwise, any conduct would be considered as the violation of the copyright. The contents of this journal are available for any citation, however, all the citations should be clearly indicated with the title of this journal, serial number and the name of the author.
Abstracted / Indexed in:
Chinese Database of CEPS, Airiti Inc. & OCLC
Chinese Scientific Journals Database, VIP Corporation, Chongqing, P.R.China Database of EBSCO, Massachusetts, USA
Google Scholar
Index Copernicus, Poland
Norwegian Social Science Data Services (NSD), Norway
ProQuest/CSA Social Science Collection, Public Affairs Information Service (PAIS), USA Summon Serials Solutions
Subscription Information:
Print $560 Online $360 Print and Online $680 (per year)
For past issues, please contact: [email protected], [email protected]
David Publishing Company
1840 Industrial Drive, Suite 160, Libertyville, IL 60048
Journal of US-China
Public Administration
Volume 12, Number 6, June 2015 (Serial Number 116)
Contents
Economical Issues and Innovation
Research on the Top-Down Design of China’s Economic Reform and National
Governance Modernization 431
Jie Gao, Yunlong Ding
Flying Geese Pattern and Central and East European Countries 440
Yoji Koyama
Factor Analysis and Construction of Resource-Based Cities’ IUR Cooperative
Collaborative Innovation System 454
Ping Xu, Qiushi Zhang, Zhihong Zhu
Political Studies and Social Governance
Through Knowledge to Power: How Modern Transformations of Society Create New
Dimensions of Political Power 460
Oleg Lyakhovenko
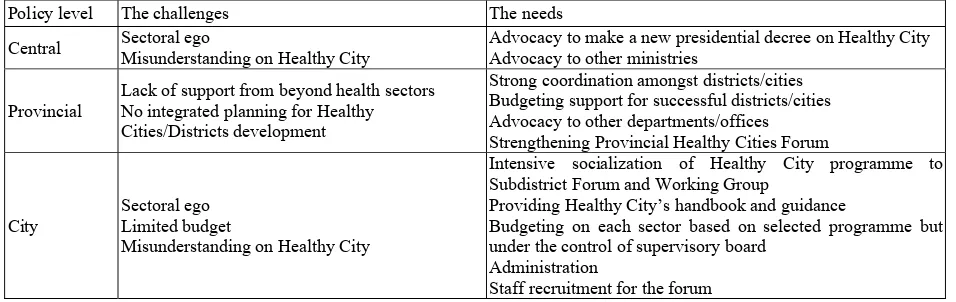
The Challenges and the Needs of Partnership in the Implementation of Healthy
Cities in Indonesia: A Case Study of Makassar 469
Sukri Palutturi, Shannon Rutherford, Peter Davey, Cordia Chu
About Drugs in the Cities: Is There Something New 477
Olivier Lefebvre
Management Issues and Practice
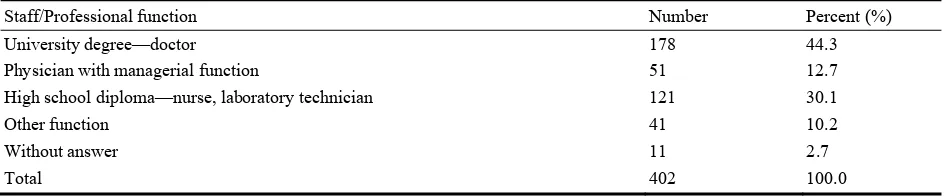
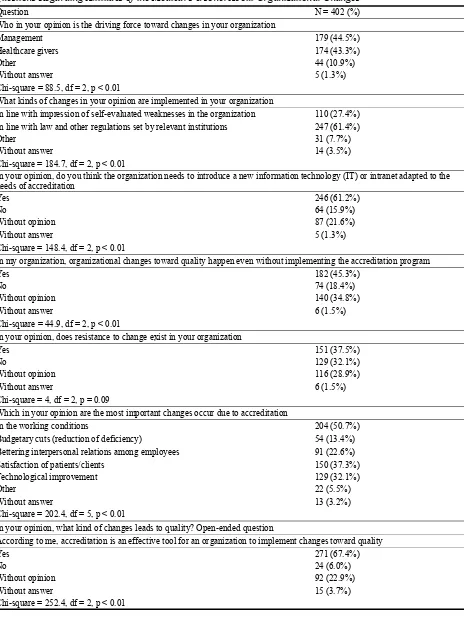
Evaluating Perceptions of the Healthcare Providers Concerning Accreditation
in Healthcare Organizations in the R. Macedonia 485
Aneta Petrusevska, Elena Kjosevska, Rosalinda Isjanovska, Beti Zafirova, Mome Spasovski, Elizabeta Zisovska
Analyzing of Customer Satisfaction and Customer Loyalty Based on Brand Image
and Perceived Service Quality 497
Journal of US-China Public Administration, June 2015, Vol. 12, No. 6, 431-439 doi: 10.17265/1548-6591/2015.06.001
Research on the Top-Down Design of China’s Economic
Reform and National Governance Modernization
Jie Gao, Yunlong Ding Harbin Institute of Technology, Harbin, China
China’s economy shifts from rapid growth stage into slower “new normal” stage. With growth and stability of the stage, China needs to gradually transfer from the exploration of “crossing the river by feeling the stones” and “bottom-up design”, into the “top-down design” of reform and the whole promotion of system. The general objective proposed in the Third Plenary Session of 18th Congress of Communist Party of China is to improve and develop the socialist system with Chinese characteristics, and promote the modernization of national governance system and governance capacity. In the face of the economic downturn pressure of “new normal” and comprehensive reform needs, China needs to introduce a series of strategic planning and top-down design work, focus on economic reform and give play to its role as a driving force, make top-down design well and realize national governance modernization. In continuing to take economic development as the central task, it is essential to maintain an unswerving commitment to focusing on economic reform and governance modernization.
Keywords: GDP (gross domestic product), new normal, top-down design, economic reform, national governance modernization
When the world has come into the 21th century, there have been many major shifts in the global economic landscape. China’s economy has kept a high growth rate. Even after the financial crisis of 2008, the impact is relatively small. In 2010, China’s total GDP (gross domestic product) surpassed Japan, and China became the world’s second largest economy. However, behind the rapid growth, there are all sorts of problems. China’s economy has gradually into the deep water area and the period of transition. With fully aware of these problems, the new central government has stressed to reinterpret GDP and economic growth in perspective, deepen all-round reform, make top-down design well, and economic work should adapt to the “new normal” economic development.
The Background and Meaning of “Top-Down Design”, “New Normal”, and
National Governance Modernization
“Top-down design” is a terminology of system engineering, network engineering. Its migration and introduction into the field of Chinese politics and the reform, is the enrichment and improvement of “scientific development”. The Fifth Plenary Session of 17th CPC (Communist Party of China) National Congress and the
Corresponding author: Jie Gao, Ph.D. candidate, School of Management, Harbin Institute of Technology; research fields: public administration, governance, policy and management of science and technology. E-mail: [email protected].
Yunlong Ding, Ph.D., professor, School of Management, Harbin Institute of Technology; research fields: public administration, governance, policy and management of science and technology. E-mail: [email protected].
DAVID PUBLISHING
“Twelfth Five Year Plan” proposed to “pay more attention to the top-level design and overall planning”, and deepen the reform comprehensively. China’s economy shifts from rapid growth stage into slower “new normal” stage. With growth and stability of the stage, China needs to gradually transfer from the exploration of “crossing the river by feeling the stones” and “bottom-up design”, into the “top-down design” of reform and the whole promotion of system (Gao & Ding, 2015).
In November 2012, the new central government with Xi Jinping as general secretary steered the ship of the collective economic development and noticed the major change and potential influence of China’s economy. At the end of 2013, the central made important judgment on the economic situation of “three period superimposed” (the speed shifting period of economic growth, the structural adjustment pains period, and the digestion period of stimulus policy), and it was the first time the central unified decision-making cognition: China’s economy was shifting from the high speed to mid-high speed development period. On the first half of 2014, General Secretary Xi Jinping emphasized “Economic work should adapt to the new normal of economic development” in the Political Bureau of the Central Conference, and the investigation in Henan Province. In November 2014, at the APEC (Asia-Pacific Economic Cooperation) summit in Beijing, he explained the China’s economy “new normal” had the speed change, structural optimization, and power conversion three characteristics. At the end of 2014, in the Central Economic Work Conference, he meticulously analyzed nine trends of changes of China’s economy “new normal” (Wang, 2015).
The General Secretary of CPC Xi Jinping published an article entitled “Unifying the Thinking in the Spirit of the Third Plenary Session of 18th Central Committee of the CPC”, and he explained the basic and specific meaning of the national governance system and governance capacity.
A country’s national governance system and governance capacity represent a concentrated embodiment of that country’s systems and its capacity to enforce those systems. China’s national governance system can be understood as a full set of closely linked and coordinated national systems through which the country is governed under the leadership of the party. It consists of institutions, mechanisms, laws, and regulations with regard to economy, politics, culture, society, ecological progress, and party building. China’s national governance capacity refers to our capacity to administer various social affairs through the application of national systems. This includes promoting reform, development, and stability, handling domestic affairs, foreign affairs, and national defense, and governing the party, the state, and the armed forces. A country’s national governance system and governance capacity complement one another to form an organic whole. We say this because a sound governance system is essential for the improvement of governance capacity, while the improvement of governance capacity is a necessary precondition for fully exerting the effectiveness of a governance system.
He also points out, China’s political stability, rapid economic growth, social harmony, and ethnic solidarity come in stark contrast to the continuous turmoil that has been seen in certain countries and regions of the world. This demonstrates that our national governance system and governance capacity are generally sound, and that they are geared to our national situation and to the needs of our national development (Xi, 2014).
work in new normal stage. The general objective proposed in the Third Plenary Session of 18th Congress of Communist Party of China is to improve and develop the socialist system with Chinese characteristics, and promote the modernization of national governance system and governance capacity. In the face of the economic downturn pressure of “new normal” and comprehensive reform needs, China needs to focus on economic reform and give play to its role as a driving force, make top-down design well, and realize national governance modernization.
The Interpretation of Top-Down Design of China’s Economic Reform and
National Governance Modernization
The Interpretation of China’s Economy From the Multiple Aspects of GDP
GDP is an important indicator to measure the economic condition of a country. Since the reform and opening-up, China has experienced 30 years’ development, made full use of resources, labor force, and other advantages, introduced of advanced Western technology, carried out the policy of “bringing in” and “going out”, and finally achieved a rapid economic growth.
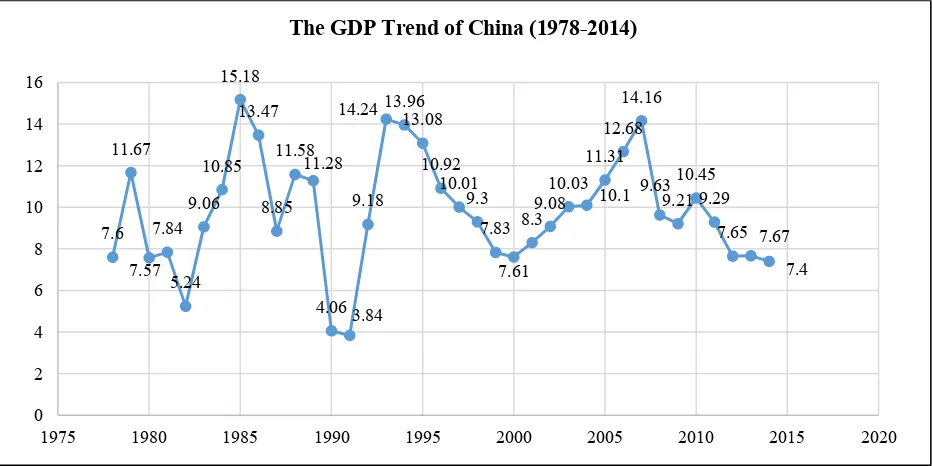
As shown in Figure 1, in 1992-2011 years, despite of occasional fluctuations, Chinese GDP growth rate is still at an average annual growth rate of almost 10%. But since 2012, the GDP growth rate has fell below 8%, and has been in the range around 7%-8%.
Figure 1. The GDP trend of China (1978-2014). Source: World Bank.
As shown in Table 1, the total GDP growth far exceeds the GDP per capita growth from 2004 to 2013. There is a saying, “guojin mintui (the state advances and the private sector retreats, or the government gets richer and the people get poorer)”. This view is not comprehensive and not accurate. Given the rapid growth of GDP and lower GDP per capita, China has a large population, and will remain in the developing state for a long time. But after 2011 and 2012, the growth of per capita GDP is fast and stable in the “new normal” stage. The GDP and GDP per capita together are slow growing, and the gap between them is narrowing.
7.6
1975 1980 1985 1990 1995 2000 2005 2010 2015 2020
Table 1
The GDP and GDP per Capita of China (2004-2013)
Indicator 2004 2005 2006 2007 2008
GDP per capita (yuan) 12,400 14,259 16,602 20,337 23,912
GDP (100 million yuan) 160,714.4 185,895.8 217,656.6 268,019.4 316,751.7
Indicator 2009 2010 2011 2012 2013
GDP per capita (yuan) 25,963 30,567 36,018 39,544 43,320
GDP (100 million yuan) 345,629.2 408,903 484,123.5 534,123 588,018.8
Note. Source: National Bureau of Statistics of PRC (People’s Republic of China).
China’s economy overtakes Japan in the second quarter of 2010 and becomes the world’s second largest, and is growing at three times the pace of USA. In 2012, China’s GDP growth is slowing down, and keeps low speed similar to USA. In these countries, the GDP growth rate of China is always the largest. After 2011, both China and India’s growth rate start to slow down, but the slowing trend of China is relatively more stable.
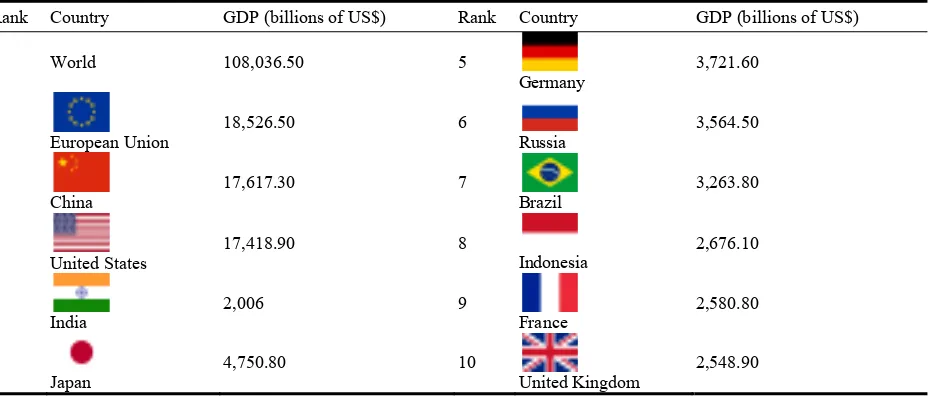
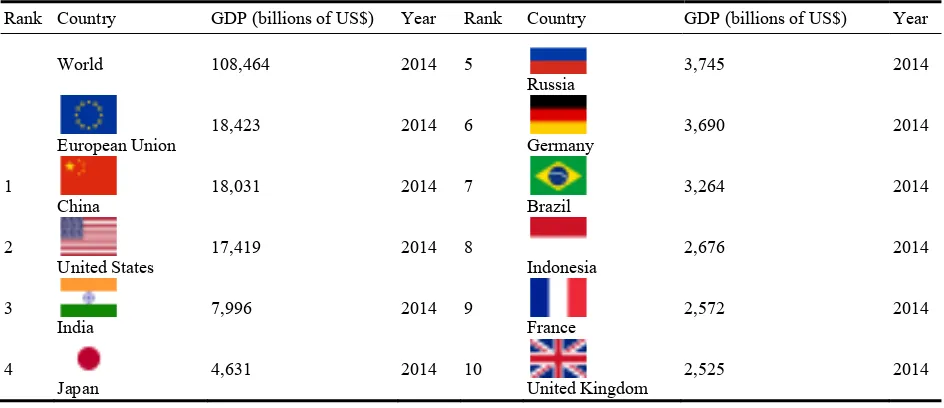
In comparison with some low income, lower middle income, upper middle income, and high income countries, GDP per capita of China still belongs to the middle and lower levels, which determines that China will remain developing state in a long period. Although there are differences in the GDP based on PPP (purchasing power parity) valuation ranking table and data from different organizations and groups, the GDP based on the PPP evaluation of China surpasses USA for the first time and tops the world’s most in 2014, and this trend will continue (see Tables 2-4). PPP is another GDP calculation method, but also can show trend of the total and rate of China GDP growth in a certain extent.
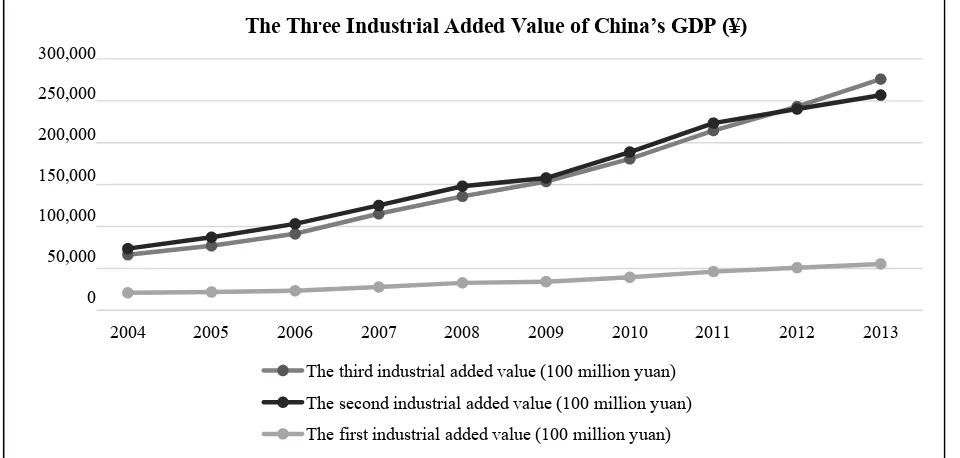
Figure 2 shows the three industrial added value of China’s GDP (¥), of which third industrial contribution in 2012 (also known as the “new normal” stage) beyond the second industrial for the first time. Under the China economy “new normal”, China economic structure is in the gradual transition and adjustment. While in active speed reduction economic growth, China creates space for transfer mode, adjusts the structure, and promotes reform. There is a certain amount of improvement in the “new normal”.
Table 2
GDP Based on PPP Valuation Ranking Table and Data From the International Monetary Fund (2014)
Table 3
GDP Based on PPP Valuation Ranking Table and Data From the World Bank (2005-2014)
Rank Country GDP (billions of US$) Year Rank Country GDP (billions of US$) Year
GDP Based on PPP Valuation Ranking Table and Data From the CIA (Central Intelligence Agency) World Factbook (1993-2014)
Rank Country GDP (billions of US$) Year Rank Country GDP (billions of US$) Year
World 107,500 2014 5
Notes. Economic and political unions that are not countries, and are therefore not ranked. Source: International Monetary Fund (IMF), World Bank, and CIA World Factbook.
Figure 2. The three industrial added value of China’s GDP (¥). Source: World Bank.
The Top-Down Design and Some Measures of China’s Economic Reform and National Governance
Modernization
The reform of the economic system is the key and focus of all the efforts to deepen the all-round reform and governance modernization. To carry out economic reform and governance needs to make the top-level design, overall planning well and implement layer by layer.
From the report and spirit of the Third Plenary Session of 18th Central Committee of the CPC, the first step of economic reform roadmap is to further free our minds, further release and develop productive forces, and further unleash and boost the vigor of our society.
China’s economic system is one with public ownership serving as its main body but allowing for the development of all types of ownership. Both public and non-public ownership are key components of China’s socialist market economy. One of the key works of economic reform roadmap is to uphold and improve the basic economic system: complete the property rights protection system, and actively develop a diversified ownership economy; push for a modern system for state-owned enterprises, and support the healthy development of the non-public economy, which will play an important role in fostering growth, promoting innovation, expanding employment, and increasing tax revenues. All these measures are the specific performance of upholding and improving the basic economic system.
The other key work of economic reform roadmap is to accelerate the improvement of modern market system. Make market rules that are fair, open, and transparent, and perfect a mechanism where prices are determined by the market; form a construction-land market that unifies urban and rural areas; improve financial markets and further open up the financial industry; deepen science and technology system reform. All these measures are efforts, which are to be made to build a market system that is uniform but open, orderly, and competitive.
To make the top-down design well, and in continuing to orient our economic reform toward the socialist market economy, an important work and governance is to balance the relationship between the government and
0 50000 100000 150000 200000 250000 300000
2004 2005 2006 2007 2008 2009 2010 2011 2012 2013
The Three Industrial Added Value of China’s GDP (¥)
The third industrial added value (100 million yuan) The second industrial added value (100 million yuan) The first industrial added value (100 million yuan) 300,000
250,000
200,000
150,000
100,000
50,000
the market, so that the market is able to play the decisive role in the allocation of resources while the government is able to exert its own role more effectively. Accelerating the transformation of government functions is necessary. Chinese government needs to improve macroeconomic regulation and control, and perform government duties comprehensively and correctly; streamline government structure and actively and steadily carry out reform that merges ministries that have overlapping functions.
To realize governance modernization, deepening fiscal and taxation system reform is another one of the key works and important guarantees: improve the budgetary system and establish a standard and reasonable debt management system for central and local governments and a risk-alert system; improve the taxation system, and perfect the local taxation base by gradually raising the share of direct taxation; establish a system in which the government’s administrative authority is commensurate with its spending responsibility and so on. All these measures are the specific performance of deepening fiscal and taxation system reform and modernize national governance.
China’s economic boom benefits from the reform and opening-up policy. Building an open economy new system and promoting further opening-up is helpful to the top-down design work and governance modernization: widen investment access and speeding up the construction of free-trade zones, with adherence to the rules of world trade system and insistence on bilateral, multilateral and regional cooperation; further opening-up inland and border areas, and establishing financial institutions focusing on development to accelerate infrastructural connections among neighboring countries and regions, such as Asian Infrastructure Investment Bank, New Development Bank, and so on.
The government has already introduced a series of strategic planning and top-down design work. The release of the Vision and Actions on Jointly Building Silk Road Economic Belt and 21st-Century Maritime Silk Road, the establishment of AIIB (Asian Infrastructure Investment Bank), BRICS (Brazil, Russia, India, China, and South Africa) Bank, new FTA (Free Trade Agreement) and Yangtze River economic belt, the integration Beijing, Tianjin, and Hebei, the revitalization of the northeast and so on. These are the specific performances and measures to achieve the goal of economic reform and national governance modernization.
Final Thoughts
After the rapid GDP growth rate (> 10%) that defined the first decade of the 21st century, China’s GDP growth rate for the first time was less than 10% in 2011. In 2012, the rate was below 8% and approached lowest rate in the 21st century. The rate has been around 7%-8% these three years and there is a trend of economic downturn. In difficult times, policymakers realize that although the economic growth slows down, its rate is still at a reasonable interval, and then continue to take a diametrically opposite approach through analysis and research, the most important challenge and problem to the current China’s economy is the “three periods superimposed”: (1) growth rate shift period is decided by the objective laws of economic development institute; (2) structural adjustment pains period is the active choice of speeding up the transformation of economic development mode; and (3) stimulus policy digestion period is a necessary stage to resolve the deep-seated contradictions accumulated over the years.
growth rate is generally showing a unilateral downward trend, reaching the lowest value in 2015. This trend clearly reflects the economy shifts from high speed to mid-high speed, but also shows that the current slowdown is further confirming (Wang, 2015). In the coming period, China’s economy will inevitably face the pressure of economic slowdown, which is a feature of the “three periods superimposed” of the new normal. In the face of pressure, we need to maintain sufficient confidence and strategic concentration to reform (Liu, 2014).
Many of the institutional and structural barriers that are constraining scientific development are found in our economic system. This indicates that our tasks in economic reform are far from being fulfilled, and that the potential of economic reform has yet to be fully unleashed. Therefore, in continuing to take economic development as our central task, it is essential that we maintain an unswerving commitment to focusing on economic reform. The economic base determines the superstructure. Economic reforms are able to play a major role in influencing and guiding reforms in other areas. That is to say, the progression of major economic reform determines the progression of structural reforms in many other areas, with a single step having the potential to affect the overall situation (Xi, 2014).
Economic development of China is in the mid-high speed growth, and transferring from the exploration of “feeling stone to cross a river” and “bottom-up design”, into the “top-down design” of reform and promotion of national governance modernization. It means that Chinese socialism will make a solid foundation and promotion to the overall layout of “five in one” (economic construction, political construction, cultural construction, social construction, and ecological civilization construction).
Conclusions
The purpose of this paper attempts to start from the policy-making and economic development process of “new normal”, “top-down design” and deepening the reform policy comprehensively, and through analysis of GDP’s different level and the specification and interpretation from the angle of “top-down design” and governance modernization, to prove that China’s economy “new normal” is neither the end of “Chinese miracles”, nor “Chinese economic recession or deflation”, and it is a period of transition and shift of China’s economy growth.
Compared with GDP trends of the G7 (Group of Seven), the BRICS, and other countries, China’s GDP growth rate is relatively high and fast. Because of the relatively independent economic, monetary policy, and the unique Chinese plus model of economic development, with small effects of the economic cycle and the exchange rate by America leading, China has always maintained a high speed of economic growth for nearly 20 years. While in active speed reduction economic growth, China creates space for transfer mode, adjusts the structure, and promotes reform. There is a certain amount of improvement in the “new normal”.
From the perspective of originality/value, the paper emphasizes on index analysis of the “new normal”, “top-down design”, governance modernization, and other related areas. With respect to both developed and developing countries, China should give full play to their own advantages to achieve development and adhere to socialism with Chinese characteristics rigidly. The results may help to understand the Chinese GDP, “top-down design”, governance modernization, and to have further understanding of “new normal” of China’s economy.
government documents. The future research focus needs from the perspectives of multi-level data and phenomenon reflect the economic to discuss China’s economy and governance.
References
Cai, F. (2004). Demographic transition, demographic dividend and sustainability of economic growth. Population Research, 28(2), 2-9.
Gao, J., & Ding, Y. L. (2015). Visualization analysis of “top-down design of reform” research hotspot and frontier. Reform & Opening, 416(11), 46-48.
Guo, X. H. (2015). Research on the mid-high growth of China’s GDP in the background of economic “new normal”. Social Science in Hubei, 2, 88-92.
Liu, Y. C. (2014, June 12). Maintain the concentration adapt and regulate the “new normal”. People’s Daily, p. 10.
Simon, J. (2000). Has population growth been a drag on economic growth? The revolution of development economics. Shanghai: Shanghai Sanlian Press.
Wang, J. (2015, March 2). China’s economy: New normal big logic. Outlook Weekly, 9, 8.
Wang, L. L., & Zhang, Y. Y. (2013). 2013 world economic situation and forecast. Beijing: Social Science Literature Press. Wang, Y. (2015). The GDP change in the “new normal”. Zhejiang Economy, 557(3), 37.
Xi, J. P. (2014, January 1). Unifying the thinking in the spirit of the Third Plenary Session of 18th Central Committee of the CPC.
Qiushi, 1, 3-6.
Journal of US-China Public Administration, June 2015, Vol. 12, No. 6, 440-453 doi: 10.17265/1548-6591/2015.06.002
Flying Geese Pattern and Central and East European Countries
Yoji Koyama
Niigata University, Niigata, Japan
This paper compares the economic development in East Asia and CEECs (Central and Eastern European Countries), especially the Western Balkans from perspective of economic history. Korea was colonized by Japan (1910-1945). Although Korea regained its independence after World War II, the country was separated by the Korean War (1950-1953). The country was completely devastated by the Korean War. As of 1960, South Korea was less developed than North Korea. Later, however, South Korea experienced a high economic growth with about 10 years lag behind Japan. South Korea has had a close economic connection with Japan and was able to introduce capital and technology from Japan. South Korea’s high economic growth can be to a considerable extent explained by “Flying Geese Pattern” as well as “Advantage of Backwardness”. It seems that the relation between Japan and East Asia is similar to the relation between Germany [not only Germany but also some other core countries in the European Union (EU)] and post-socialist East European countries. Central European and as well as Romania and Bulgaria (new EU member states of CEECs) attracted capitals and technologies from developed countries including the EU countries and attained rapid economic development. A problem is whether the Western Balkan countries will be able to attain rapid economic development with capitals and technologies absorbed from developed countries as new EU member states have experienced. In this paper, not only common characteristics but also differences in the conditions between East Asian countries and the West Balkan countries will be examined.
Keywords: Flying Geese Pattern, East Asia, Central and Eastern Europe, Western Balkans, economic history
It seems that the relation between Japan and East Asia is similar to the relation between Germany [not only Germany but also some other core countries in the European Union (EU)] and post-socialist East European countries. Central European countries as well as Romania and Bulgaria attracted capitals and technologies from developed countries including the EU countries and attained rapid economic development. A problem is whether the Western Balkan countries will be able to attain rapid economic development with capitals and technologies absorbed from developed countries as the above mentioned new EU member states of Central and East European countries (CEECs) have experienced.
In this paper, the Flying Geese Pattern is briefly explained at first. Then, experiences of South Korea and East Asia are explained, and secrets of South Korea’s economic success are analyzed. Not only common characteristics but also differences in the conditions between East Asian countries and the West Balkan countries are examined. Finally, the paper reaches conclusion.
Corresponding author: Yoji Koyama, Ph.D., professor emeritus, Niigata University; research fields: area studies of Central and Eastern Europe, EU and Eurozone enlargement, and comparative economic system. E-mail: ZAC00343@nifty. com.
DAVID PUBLISHING
Flying Geese Pattern
In the 1970s, labor-intensive industries such as textile industry and assembly of radio, television, and other home appliances were relocated from Japan to South Korea. Along with the economic development in Newly Industrializing Economies (NIES) such as South Korea, Taiwan, etc., labor costs in these countries have increased to a considerable level. Labor-intensive industries in these countries relocated their production bases to Association of Southeast Asian Nations (ASEAN) countries such as Thailand, Malaysia, etc., in pursuit of cheaper labor costs. These phenomena can be explained by the Flying Geese Pattern, which was originally presented by Kaname Akamatsu before World War II and was later developed and modified by the younger generations (Inada, Ohashi, Kozaki, & Muroi, 2000, pp. 67-68).
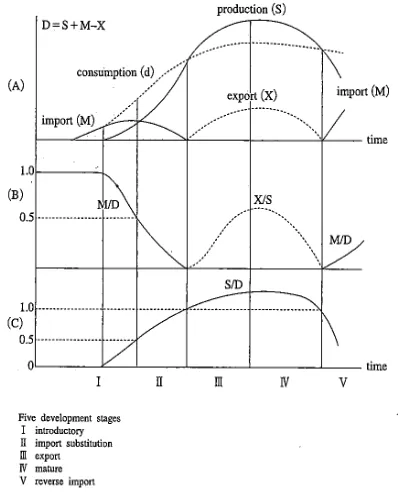
According to Yamazawa et al. (1993), it originally referred to the typical development pattern of modern industries in Japan, which, as a late-starting industrializing country in the late 19th century, introduced modern industries at first through import, then started domestic production to substitute import, and finally exported its product abroad as it became competitive internationally. It focuses on an efficient interaction between international trade and industrial growth and the sequence of inverse V-shaped growth curves of import, domestic production, and export resembles the flying formation of wild-geese returning to the south in late autumn.
The Flying Geese Pattern is also called the Catching-up Product Cycle (CPC) by younger generations. Yamazawa et al. (1993) further explains Figure 1 as follows: In Figure 1, Panel A illustrates CPC by means of the schematic forms of four growth curves of import (M), domestic production (S), domestic consumption (D), and exports (X) of a modern industry product. Statistically domestic production is derived as apparent consumption, i.e., production plus import minus export (D = S + M X), but theoretically its growth curve sets the pace of the CPC development of a particular industry, through its impact on domestic entrepreneurs. Panel B illustrates the change of the two key ratios in the process of the CPC development, import/consumption ratio (M/D) and export/production ratio (X/S) which are often used to measure the progress of import of substitution and export expansion respectively. Although export starts only after import finishes in this schematic diagram, in reality, products are differentiated within the same products group and the export of lower quality product starts while the import of sophisticated one still continues. Panel C illustrates the CPC by a single growth curve of production/consumption ratio (S/D). Five development phases: Introductory, import substitution, export, mature, and reverse import, are distinguished by the specific value of S/D, namely 0.5, 1.0, maximum, 1.0 again (Yamazawa et al., 1993, p. 17).
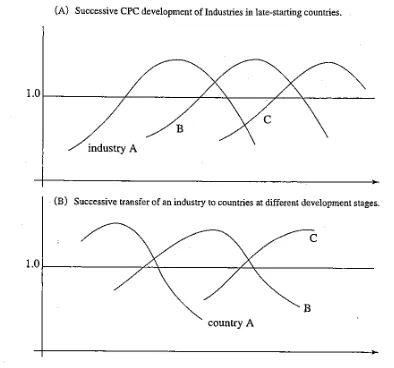
Figure 2. Variations of the CPC development. Source: Yamazawa et al. (1993, p. 21).
Economic Development in South Korea and East Asia
A Miracle of the Hang River
In 1996, per capita gross domestic product (GDP) in South Korea reached US$ 10,000. It is in 1996 that South Korea was admitted to the Organization for Economic Co-operation and Development (OECD), a group of advanced countries. As the country was hit by the Asian Economic Crisis and came under the control of the International Monetary Fund (IMF) in the following year (1997), the period 1996-1997 is considered to be an epoch-making. Let us take a general view of the economic history of South Korea until 1996.
Korea was under the rule of the Japanese Empire as its colony from 1910 to 1945. As expressed by words “agriculture in South and industry in North” (Lee, 1980, p. 72), during Japan’s rule, industry was not developed in the southern part of Korean Peninsula compared with the northern part where mineral resources were rather abundant.
damages amounted to two years’ GDP of South Korea at that time (Watanabe, 1996, p. 38).
Government led by Lee Sung Man spent all its time in ceaseless political strife and completely lacked ability to manage economic recovery. More than anything else, the national land has been completely destroyed by the three-year war, and almost no resource was left for economic reconstruction. (Watanabe, 1996, p. 40)
South Korea’s last resort was aid from the USA. Its aid was mainly supply of goods, the majority of which being raw materials such as wheat, raw sugar, raw wool, raw cotton, etc. The aid goods were sold off by the government for the domestic production. A part of the proceeds was included in the general budget, and other part was utilized for financing companies through the Korean Industrial Bank. It was only flour milling, sugar refining, and textile industry that was brisk. These big companies succeeded in obtaining these articles of disposal by the government not because of their entrepreneurial efforts but because they behaved as businessmen with political contacts. Government had no economic policy for overcoming poverty, while a handful of big companies were enjoying privileges and prospering. People’s disillusion and irritation about the government and such companies were increasing day after day.
There occurred a military coup d’etat led by General Park Chung Hee on May 16, 1961. General Park ran the presidential election in 1963 and he defeated an old and experienced politician. “Korean people chose president who came from the army” (Watanabe, 1996, p. 48). Although the declaration of democratization was made in June 1987 and the presidential election was held in December in the same year, the military regime practically continued until 1993 because General Noh Tae Woo was elected president. According to Watanabe, civil bureaucrats’ way of thinking was conservative and abstract and their way of behavior was worship of the powerful and formalism, which was contrary to enterprising spirit. The military coup d’etat was an epoch-making event that broke down the civil bureaucracy which has been warmly fostered in the Confucian climate as well as thoughts and ethics which have supported the former. The author would like to add that he was very critical toward the military regime in South Korea 45 years ago. At present, however, he has to admit that the regime of development dictatorship has played a positive role in the modernization of South Korean society, although it of course had negative aspects too. Not only did the military itself appear as a driving force of the modernization, but also the military regime appointed young able bureaucrats to high-ranking positions of ministries. The mainstay of economic related ministries was composed of fresh bureaucrats in their thirties with young economists educated in the USA as a center.
According to Watanabe, the new government aimed at “export-oriented industrialization”. In order to pursue it, protective policies were abolished. Main goods of South Korea’s exports were labor-intensive assembled and processed products. South Korean companies assembled and processed materials and interim products which were imported from advanced countries, by using machines and equipments which were imported also from advanced countries, and they exported the final products. In spite of rapid heavy and chemical industrialization, the country had still fragile production on the basis of interim goods such as parts as well as capital goods such as heavy machines. The country had to strive for expanding exports, relying on imports of interim goods and capital goods.
Noteworthy was the problem of the Basic Treaty between Japan and South Korea. People’s feeling toward the treaty was complicated in South Korea. Many people took it as “humiliating”. The public opinion was split into two concerning the pros and cons of signing the treaty. Suppressing people’s opposition even by proclamation of martial law, the government concluded the treaty in December 1965.
Park Administration perceived it a better choice in diplomatic strategy toward Japan to dare to introduce capital from Japan and accomplish self-supporting economy through this rather than to stick to “bonds of life” in the past, being forced to fall into a slump. (Watanabe, 1996, pp. 74-75)
According to Watanabe (1996), by this treaty, Japan decided to offer aid totaling US$800 million including aid gratis and private loans. With this as priming water, accelerated expansion of the introduction of foreign capital proceeded since 1965. In the second half of the 1960s, commercial loans surged. In the 1970s, foreign direct investment (FDI) increased. Not only foreign capital but also foreign technology has been introduced on a massive scale. Until mid-1960s, foreign technology was introduced mainly to spinning and weaving industries, however, as early as in the second half of 1960s, the introduction of foreign technology to these industries has almost ceased. Since mid-1970s, the shipbuilding and the petrochemical industries also have relatively decreased in the total introduction of foreign technology. In contrast, other heavy and chemical industries remained at high level for a while in the introduction of foreign technology. At the same time, the introduction of foreign capital to metal, electronic, and machine industries increased. Watanabe pointed out similarity of the system of technology between Japan and South Korea. Due to Japan’s colonial rule before the war, the number of engineers who were able to easily understand technological literature written in Japanese was overwhelmingly large in South Korea and Taiwan, compared with any other countries. Watanabe mentioned a fact that there were 1,486 cases out of 2,293 cases of technological introduction between 1962 and 1983, it means that 63% of them came from Japan (Watanabe, 1996, pp. 77-78).
introduction of the most up-to-date foreign technology. Watanabe said, “The construction of this steelworks was, at least at the beginning, a state ‘venture business’ attempted at any risk rather than a project planned on the basis of a rational cost-benefit analysis” (Watanabe, 1996, p. 86). Why were they in such a hurry? We should take into account that this country has always been confronted with North Korea. In the 1970s, the size of the US Army in South Korea was gradually scaled down. This fostered consciousness of urgent necessity for establishing self-reliance both economically and militarily among people and the military. People’s national passions together with feelings of danger have supported the rapid heavy and chemical industrialization.
Rural areas have drastically changed. Rural areas in South Korea were extremely poor until early 1960s. As early as mid-1970s, however, peasants’ income reached almost the same level as workers’ household in urban areas. The industrialization in South Korea has been so strongly pulling employment that migration from the rural areas began. Since the second half of the 1960s, the tendency of a decrease in the rural population and the number of peasant families was remarkable. Labor markets in the rural areas became tight. Accordingly, the average labor hours of peasants became longer, the percentage of incomplete employment in agriculture was decreasing and the participation of women in labor was increasing, and at the same time, real wages of agricultural labor were rapidly increasing. The “Semaul Movement”, the plan for modernization of villages led by the government, also supported the improvement of living conditions of peasants. According to Watanabe, most of soldiers who participated in the military coup d’etat came from villages. One of the factors behind the military coup d’etat was poverty in rural areas. The military regime has kept a kind of “Nohonshugi” (the belief that agriculture forms a basis of the nation’s economic and social life) as its identity. The Semaul Movement had three major goals: The first goal was to remove peasants’ conception to accept their fate with resignation and foster diligence, self-support, and cooperation. For this purpose, peasants should cooperate on small projects for improvement of their environment such as repair of banks of small rivers in their villages, construction of public wells, etc., with the financial support from the government; the second goal was improvement of the environment. This included government-supported projects such as electrification of rural areas, improvement of village structure, and construction of water supply facility as well as the national land improvement plan such as improvement of big rivers, soil-erosion control, forestation, etc.; the third goal was an increase in peasants’ income. In order to increase the production of rice and wheat, big projects such as improvement of irrigation facilities, utilization of ground water, improvement of agricultural machines and implements, and breed improvement were carried out. In order to increase income, peasants were encouraged to do side business. Lucrative cash crops were cultivated, and peasants’ group work as well as joint use of fertilizers and agricultural machines was actively encouraged. Thus, enriched rural areas became markets for industries (Watanabe, 1996, pp. 89-93).
Compressed Industrial Development
Although there was the oil shock in 1973, the manufacturing kept developing with 18% of average annual rate of growth. In the course of the industrialization, the dependence on import has gradually decreased in manufacturing industries such as textile, electric, electronic, shipbuilding, petrochemical, steel industries, etc., and at the same time, the dependence on export has gradually increased in these industries. The speed of the decrease in the dependence on import as well as the speed of the increase in the dependence on export in these industries was higher than in the case of Japan (Watanabe, 2002, pp. 136-138).
The GDP grew at more than 12% for three consecutive years from 1986 through 1988. While the Japanese economy was suffering from Yen appreciation after the Plaza Accord in 1985, South Korea improved its price competitiveness because of Won pegged to US Dollar and significantly increased its export to the US markets. South Korea’s trade balance turned to positive in 1986, however, it turned to negative again in 1990. Because wages in South Korea continued to increase at around 20% every year from the second half of the 1980s to the early 1990s, and the wage level became higher compared with not only ASEAN countries and China but also other NIES. Consequently, the domestic demand expanded, but at the same time, the export competitiveness of labor-intensive goods decreased remarkably (Watanabe, 2002, p. 150). Therefore, South Korean enterprises came to give high priority to high-tech industries. In the 1990s, South Korean enterprises became more actively involved in outward FDI in foreign countries, including CEECs.
Watanabe called such a miraculously high economic growth in South Korea “compressed industrial development”1. According to him, it was enabled by “advantages of backwardness” which South Korea has enjoyed in terms of foreign capital, transfer of technology, invitation of private companies from developed countries, etc. Being situated in the least developed part of the capitalist developed world, NICs (Newly Industrializing Countries) including South Korea have benefited “advantages of backwardness” deriving from the developed world and succeeded in “internalize” them effectively (Watanabe, 2002, pp. 142-143).
East Asian Countries
Not only Japanese enterprises but also Korean enterprises have actively invested in China as well as ASEAN countries. However, we should not overlook these countries’ efforts to attract FDI. Malaysia, for example, enacted Law on Encouragement of Investment in 1968, thereby the country sought overseas market for its industrial products, replacing the hitherto import substituting industrialization. The country became more positive to introduce foreign capitals. In 1986, the country enacted Law on Promotion of Investment, thereby aiming at more active introduction of foreign capitals to promote exports. The law also aimed at location of small and medium-sized enterprises in rural areas and making full use of private capitals (Maruyama & Narita, 1995, pp. 230-232). Similarly, Thailand launched measures for encouragement of investment for industrialization in the 1970s. A socialist country Vietnam also launched measures for encouragement of investment in the 1980s. All of them pursued the export-oriented industrialization. The author would like to add that in the case of Malaysia in 1981, the government under Prime Minister Mahathir launched the Look East
1
Policy—which encouraged learning of experiences of Japan and South Korea—and aimed at introduction of not only advanced technology but also Japanese style of managerial administration.
Secrets of the Miracle of the Hang River
Advantages of Backwardness
A term “advantages of backwardness” is a concept coined by Alexander Gerschenkron (1966). Watanabe explained as follows: A late-comer country has advantages that it can make use of industrial technology, which advanced countries have elaborated in the long history of their technological development, as “existing technology” at the starting time of its economic development. In addition, it is blessed with an advantage that it can shorten the period of capital accumulation through the import of capital. Moreover, a present late-comer can introduce not only technology and capital individually but also talents and ability of the enterprise management that effectively organize this technology and capital. The introduction of direct investment by private companies from advanced countries is the case (Watanabe, 1996, p. 207).
In connection with this, another important factor is industrialism. Industrialism that was created in advanced countries was transmitted to less developed countries, which in turn internalized the transmitted industrialism and became able to begin the process of rapid development. The process of internalization of the industrialism which originated in developed countries is the process of the so-called “modern economic growth” of Kuznetz (Watanabe, 2002, pp. 22-23).
Not all developing countries were able to enjoy “advantages of backwardness”. Watanabe mentioned Bangladesh as an example of regression. According to him, in order to internalize industrialism, countries must possess suitable “social ability”. Namely, especially the three points: (1) technical ability of workers; (2) managerial ability of managers; and (3) bureaucrats’ administrative ability, i.e., ability to draft and implement policies are important (Watanabe, 2002, p. 25).
At the moment when the high economic growth started in the early 1960s, although South Korea was among the poorest countries, the educational level was not low in the world comparison. During the period of the Japanese colony, the literacy rate improved remarkably and at the same time, many specialists with practical knowledge such as teachers of physics and mathematics, specialist of taxation business and bookkeeping, specialists of railways, etc., were trained. Accordingly, potential managerial ability of future managers also improved. As mentioned above, the military government which came to power by the coup d’etat in 1961 picked out young bureaucrats including economists educated in the USA. They had a rational way of thinking without adhering to the old custom. Thus, bureaucrats’ administrative ability improved remarkably compared with the previous period.
Big Roles Which Entrepreneurs Have Played
with his savings. In 1950, he acquired a motor vehicle repairing factory and brought the two businesses into one, starting “Hyundai” Construction Company. Making the best use of his entrepreneurial foresight, swift judgment, and energetic acting power, in a single generation, he has developed “Hyundai” into one of the greatest concern in South Korea. The author thinks that economic animal-like behavior of proprietors represented by Mr. Jeong Juyeong was very important in South Korea’s postwar economic recovery and its high economic growth.
Government’s Strong Leadership
Initially, there was very little investment from foreign countries, because the infrastructure was of very poor quality. Foreign companies were not willing to invest in South Korea which stood face to face with North Korea. There was very little, if any, investment in South Korea by Japanese companies. Foreign funds came mainly in the form of loans from Japan and West Germany with guarantee by the government of South Korea. Let us mention typical government’s strong leadership, for example, “8.3 emergency financial measures” announced on August 3, 1972, thereby loans were frozen and their repayment could be postponed for several years. There were state projects represented by POSCO. The government even intentionally created an oligopolistic condition of enterprises on the ground that it would be better to make enterprises have enough strength to compete on the world market rather than competition by a large number of enterprises on a small market leading their exhaustion. There was a “Big Deal” in which the Lucky Gold handed over its semiconductor production to the Hyundai and the Hyundai handed over a branch which overlapped that of the Lucky Gold to the Lucky Gold. The “Big Deal” was made under the government’s guidance. These are typical cases which the government dared to intervene in markets and materialized what could not be realized by market.
New EU Member States of Central and Eastern Europe and the Western Balkans
Analogies
It seems that the relation between Germany (not only Germany but also other core countries of the EU) and new EU member states is similar to the relation between Japan and Asian NIES. Especially, Central European countries have had close cultural and economic relations. In addition, there were bases of technology and skill which were represented by Skoda in the Czech Republic. In the 1990s, these countries actively attracted foreign capitals. Also, many companies of manufacturing industries from advanced countries paid attention to the fact that the wage levels in these countries were much lower than those in the EU core countries and took into consideration that these countries would be admitted to the EU soon, established assembly factories there to supply the whole market of enlarged EU with finished goods. By the early 2000, the share of foreign capital-owned enterprises in capital, employment, investment, sales, and export sales in these countries except Slovenia2 increased rapidly. It may be fairly said that new EU member states of CEECs attained the economic growth led by foreign capitals. It seems that they reached the same position as South Korea and Taiwan occupied in the 1980s and that the former countries are stepping up to a more advanced stage. In this way, the Flying Geese Pattern occurred in new EU member states of CEECs. This is the first wave. It seems that the Western Balkan countries are similar to ASEAN countries such as Thailand, Malaysia, Vietnam, etc., 20-30 years ago. A question is whether another Flying Geese Pattern will occur or not. If it occurs that would be the second wave.
2
The Western Balkans
After the regime change in the late 1980s to the early 1990s, in the process of the transition to a market economy, all the countries of the Western Balkans3 experienced transformational depression. In addition, there were severe ethnic conflicts in 1991-1995 and the Kosovo War4 in 1999. These events caused turbulence, economic stagnation, and a delay in EU accession. Compared with new EU member states of CEECs, the amount of FDI inflow in the Western Balkan countries has been quite limited. Their economies except Albania were stagnating in the 1990s. The Stabilization and Association Process, which was initiated by the EU in 1999, created brighter prospects for their EU accession.
All the countries of the Western Balkans have a common weak point, i.e., structural weakness: (1) low labor participation rates and employment rates. In the case of Croatia, for example, the labor participation rate is 50.2% (in 2003) while it is 65.9% in EU-27 (in 2008). In 2004, the employment rate in Croatia is 54.7% while it is 64.7% in EU-15; (2) high unemployment rates ranging from 8.4% in Croatia to 33.8% in Macedonia; (3) large sizes of the informal economies (they exceeded 30% of GDP in all countries of the Western Balkans). Revenues from the informal economies supplemented low wages or lack of jobs and enabled people to subsist; (4) a high share of remittance from abroad. The amount of remittance as a percentage of GDP exceeds 10% in Serbia, Montenegro, Bosnia and Herzegovina, and Albania in 2006; and (5) low saving rates. All of the countries have rather low saving rates (in 2005, gross domestic saving as a percentage of GDP ranged from -2.2% in Bosnia and Herzegovina to 23.3% in Croatia). In all the countries, investment rates (in 2005, gross domestic investment rate ranged from 15.9% in Bosnia and Herzegovina to 29.9% in Croatia) exceeded the saving rates, consequently causing chronic trade deficit and current account deficit. Therefore, their economic development has been heavily relying on foreign savings, i.e., FDI inflow, borrowings from abroad5.
The ratio of the populations of new EU member states of CEECs (Central Europe + Bulgaria and Romania) and the Western Balkans is 4:1 (93.33 million vs. 23.48 million). In 1995, however, the amount of FDI inflow in new EU member states was US$11,421 million, while the amount of FDI inflow in the Western Balkans was only US$210 million, i.e., the ratio was 54:1. In 1999, the former received US$19,125 million, while the latter received US$1,791 million, i.e., the ratio was 10.7:1. After 2000, FDI inflow in the Western Balkans from advanced countries (especially EU member states) increased remarkably. In 2005, new EU member states received US$30,394 million while the Western Balkans received US$4,409 million, and the gap further decreased to 6.9:1 (Transition Report, various years).
However, in contrast to new EU member states of CEECs and contrary to expectations by governments and people in the Western Balkans, not so much inward FDI flowed into the manufacturing industry, but instead, it flowed mostly into services, especially banking, telecommunication, and real estate. Greenfield investment has been small, because mostly inward FDI flowed into this region in connection with the privatization process. Since 2000, in parallel with increased FDI inflow, the economies of the Western Balkans expanded at relatively high growth rate, but it was the economic growth led by consumption. Consequently, their external debt has increased. In the case of Croatia, its external debt amounts to 98.5% of GDP in 2009 which is unsustainable level. This country is required to do switchover to export-led economic development
3 For more detailed information about the Western Balkans, see Koyama (2015), Chapter 4. 4
For the Kosovo War, see Koyama (2015), Chapter 3.
model6. This requirement more or less applies to other countries of the Western Balkans. These are uneasy challenges.
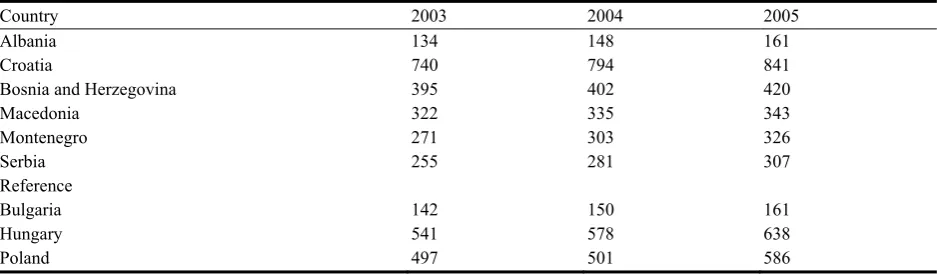
The countries of the Western Balkans are placed on the periphery of Europe, and generally speaking they are poor. Among them, however, Croatia is comparatively rich. The GDP per capita in 2009 is €10,100, the highest in the Western Balkans, far beyond the level in Bulgaria (€4,500) and Romania (€5,500) which joined the EU in 2007 (Gligorov et al., 2010). Croatia failed to join the first wave. The gross labor cost in Croatia is the highest in the Western Balkans. Not only that, its labor cost is higher than that in Central European countries like Hungary and Poland (see Table 1). It would be impossible for Croatia to become a basis for production of labor-intensive industries with lower wage as a weapon. Instead, the country should aim to become a basis for production of high value added goods, but unfortunately, the author does not tell what kind of goods that should be concretely. In Albania, there is processing on commission for Italian enterprises. It seems that besides Albania, Serbia, Macedonia, and Bosnia and Herzegovina, still have a possibility to become bases for production of labor-intensive industries.
Table 1
Gross Labor Cost in the Western Balkans (All Sectors, in Euros)
Country 2003 2004 2005
Albania 134 148 161
Croatia 740 794 841
Bosnia and Herzegovina 395 402 420
Macedonia 322 335 343
Montenegro 271 303 326
Serbia 255 281 307
Reference
Bulgaria 142 150 161
Hungary 541 578 638
Poland 497 501 586
Note. Source: Kathuria (2008, pp. 52-53).
Differences Between the Western Balkans and Asian (NIES and ASEAN) Countries
We should take into consideration several differences between the Western Balkans and Asian (NIES and ASEAN) countries: (1) a difference in times; (2) a difference in the development models; and (3) a difference in sizes of countries.
The world economy from the 1960s through the 1980s was not regulated so much by rules prescribed by the WTO [General Agreement on Tariffs and Trade (GATT)], the IMF, and the World Bank. In other words, governments’ intervention policies, protection of primitive industries, etc., were tolerated. In contrast, during the period from the 1990s to the present, strict conditionality based on the Washington Consensus has been imposed on developing and transition countries by the IMF, although it was a little bit modified in a more realistic way after the Asian Economic Crisis in 1997. During the period, custom tariffs were considerably decreased. The applied tariff rate (simple average) on imports of the Western Balkans in 2005 is 5.3% for all goods, 11.2% for agricultural products, and 4.7% for industrial products (Kathuria, 2008, p. 38). If a country is not allowed to protect its domestic industries by higher custom tariffs, the exchange rate policy would be very important.
The Western Balkan countries have attained the economic development led by consumption. It is necessary for these countries to pursue export-oriented economic development as Asian (NIES and ASEAN) countries did. For this purpose, it is necessary for these countries not only to attract foreign capitals and technologies, but also to mobilize domestic savings.
Sizes of the Western Balkans countries are very small compared with those of Asian countries. The Western Balkans in total has the population of only 23 million. However, Central European Free Trade Agreement (CEFTA)-2006 would be useful in overcoming the smallness of each domestic market and improving investment climates of the region.
Besides, as Watanabe (2001) said, in order to internalize industrialism, countries must possess suitable “social ability”. It seems questionable that Albania has suitable “social ability” because of its very short history of the market economy. It seems questionable too that Bosnia and Herzegovina has suitable “social ability”, because human capitals and physical capitals in the country were severely damaged by the ethnic conflicts in the first half of the 1990s and because the country still lacks cohesion. It may be said that other countries of the Western Balkans have suitable “social ability”.
Conclusions
After the transition to a market economy, new EU member states of CEECs have attained the export-oriented development with foreign capitals attracted from advanced countries and succeeded to a certain extent in catching-up with advanced countries. This shows a Flying Geese Pattern.
In order for the Western Balkan countries to attain a rapid economic development and catch up advanced countries, it would be indispensable for them to do a switchover from the hitherto consumption-led economic development model to the export-led economic development model. For such a switchover, it would be advisable to make efforts to attract FDI to manufacturing industries and at the same time to effectively mobilize domestic savings.
In this paper, we have seen experiences of South Korea and other East Asian countries. As the times and the background are quite different and the governments of the Western Balkans countries are facing various constraints, the experiences of the East Asian countries cannot be applied to the Western Balkans as they are. However, in the light of the experiences of the East Asian countries, it can be surely said that governments should exhibit strong leadership in a switchover to the export-led economic development model.
References
Akamatsu, K. (1962). A historical pattern of economic growth in developing countries. The Developing Economies, 1(1), 3-25.
Amsden, A. H. (1989). Asia’s next giant: South Korea and late industrialization. New York: Oxford University Press.
Bartlett, W., & Monastriotis, V. (Eds.). (2010). South Eastern Europe after the crisis: A new dawn or back to business as usual?
LSEE at the London School of Economics and Political Science.
Gerschenkron, A. (1966). Economic backwardness in historical perspective: A book of essays. Cambridge of Massachusetts: The Belknap Press of Harvard University Press. Its Japanese version (2005), published by Minerva Shobo.
Gligorov, V., Havlik, P., Landesmann, M., Poeschl, J., Richter, S., Pindyuk, O., … Urban, W. (2010). Crisis is over, but problems loom ahead. Current analyses and forecasts 5. Vienna: wiiw.
Inada, J., Ohashi, H., Kozaki, T., & Muroi, Y. (2000). Kokusaiteki Hatten no Chiikiteki Hikaku: Ajia, Afurika oyobi Raten Amerika niokeru Keiken (Regional comparison of international development: Experiences in Asia, Africa and Latin America). Tokyo: Chuo Keizaisha.
Kathuria, S. (Ed.). (2008). Western Balkan integration and the EU: An agenda for trade and growth. World Bank.
Koyama, Y. (2006). Slovenia’s competitiveness and the small country’s development strategy: Its enigma and an explanation. Proceedings from the International Conference “Future Competitiveness of EU and Its Eastern Neighbours”. September 1-2, Turku, Finland. [This paper was later included in Koyama (2008)].
Koyama, Y. (2008). Transition, European integration and foreign direct investment in Central and Eastern European countries.
Niigata University Scholar Series, 9.
Koyama, Y. (2015). The EU’s eastward enlargement: Central and Eastern Europe’s strategies for development. Singapore: World Scientific.
Lee, H. J. (1980). Kankoku Kogyoka no Rekishiteki Tenkai: Kogyoka Seisaku no Tenkai niokeru Kan Nichi Hikaku no Shiten (Historical development of industrialization in South Korea: A viewpoint of comparison between South Korea and Japan in implementation of industrialization policies). Tokyo: Zeimu Keiri Kyokai.
Maruyama, K., & Narita, Y. (Eds.). (1995). Nihon Kigyo no Ajia Senryaku: Kokusaibungyo to Kyosei no Kadai (Japanese enterprises’ strategies toward Asia: Challenges of international division of labor and coexistence). Tokyo: Chuo Keizaisha. Matsumoto, A. (2001). South Korea’s economic development and “the Japanese Model”: The limit of its strategy of copying. In A.
Matsumoto and T. Hattori (Eds.), Anatomy of South Korean economy: Was the theory of transition to an advanced country correct? Tokyo: Bunshindo.
Matsumoto, A., & Hattori, T. (Eds.). (2001). Anatomy of South Korean economy: Was the theory of transition to an advanced country correct? Tokyo: Bunshindo.
Ozawa, T. (1992). Foreign direct investment and economic development. Transitional Corporations, 1(1), 27-45.
Society for Contemporary Asian Studies. (Ed.). (1994). Higashi Ajia Keizai no Kyokuchiteki Seicho (Local areas’ development of East Asian economy). Tokyo: Bunshindo.
Taniura, T. (1989). Kankoku no Kogyoka to Sono Hatten Taisei (South Korea’s industrialization and its development regime). Tokyo: Institute of Developing Economy.
Vidovic, H., & Gligorov, V. (2006). Croatia: Growth slowdown and policy alternatives. wiiw Research Reports, No. 324. Retrieved from http://www.wiiw.ac.at/croatia-growth-slowdown-and-policy-alternatives-p-353.html
Watanabe, T. (1996). Introduction to Korean economy. Tokyo: Chikuma Shoboh.
Watanabe, T. (2001). Introduction to development economics. Tokyo: Toyo Keizai Shinposha. Watanabe, T. (2002). Growing Asia and stagnating Asia. Tokyo: Kodansha.
World Bank. (2010). Enhancing regional trade: Integration in Southeast Europe. World Bank Working Paper, No. 185.
Journal of US-China Public Administration, June 2015, Vol. 12, No. 6, 454-459 doi: 10.17265/1548-6591/2015.06.003
Factor Analysis and Construction of Resource-Based Cities’ IUR
Cooperative Collaborative Innovation System
Ping Xu, Qiushi Zhang, Zhihong Zhu Northeast Petroleum University, Daqing, China
Resource-based cities are often faced with the dilemma which cannot be sustainable development after depletion of resources, so how to achieve sustainable development of resource-based cities becomes the focus of scholars. Based on the definition of the concept related to the resource-based cities’ industry-university-research (IUR) collaborative innovation system, the paper analyzes the two main factors of innovation entity and innovation environment of the resource-based cities IUR collaborative innovation system. The innovation entities include enterprises, universities, research institutes, government, intermediary agencies of science and technology, and financial institutions. The factors of innovative environment include the environment of policy and legal, the level of development which represents regional pillar industries and high-tech industries and the perfection degree of resource-based cities’ cooperative innovation platform construction. Finally, this paper builds a resource-based cities IUR collaboration innovation system model. In this model, each party entity, in the context of low-carbon economy, are in the environment that policy, law, and regional pillar industries and high-tech industries growing fast, they also make collaborative innovation.
Keywords: industry-university-research (IUR), collaborative innovation, resource-based city, elements
The development of resource-based cities often relies on the energy and abundant resources in the region, and the establishment of industrial form is also dependent on the rapid development of large-scale energy sources, but along with the process of energy and resource-based cities’ development, the city need think earlier and plan in advance about some situations, e.g., the continued deterioration of the natural environment, the excessive development of energy, the bottle neck issues connected with the economic which has developed to a certain stage. Therefore, the research of resource-based cities’ industry-university-research (IUR) collaborative innovation system can enhance the source of innovation and provide a strong motivation for achieving the
This paper is supported by these fund projects: 2013 Youth Science Fund Project of Social Science of Northeast Petroleum University (2013QN201), Heilongjiang Province Philosophy Social Science Research Planning Project (13D007), Heilongjiang Province Philosophy Social Science Research Planning Project (12E144), 2014 Daqing Philosophy and Social Sciences Key Research Projects (DSGB 2014009), and 2013 Youth Science Fund Project of Social Science of Northeast Petroleum University (2013QN203).
Ping Xu, Ph.D. in management, Harbin Engineering University of China, professor, Secretary of the Commission for Discipline Inspection of Northeast Petroleum University, Daqing, China; research field: theory and practice of cooperative collaborative. E-mail: [email protected].
Qiushi Zhang, MA candidate, Institute of Economics and Management, Northeast Petroleum University, Daqing, China; research field: theory and practice of auditing. E-mail: [email protected].
Corresponding author: Zhihong Zhu, MA in management, associate professor, CPA of China, Petroleum Institute of Economics and Management, Northeast Petroleum University, Daqing, China; research field: theory and practice of auditing. E-mail: [email protected].
DAVID PUBLISHING