This content has been downloaded from IOPscience. Please scroll down to see the full text.
Download details:
IP Address: 59.77.43.191
This content was downloaded on 12/07/2015 at 06:37
Please note that terms and conditions apply.
Biosynthesis of silver and gold nanoparticles by novel sundried
Cinnamomum camphora
leaf
View the table of contents for this issue, or go to the journal homepage for more
Nanotechnology18(2007) 105104 (11pp) doi:10.1088/0957-4484/18/10/105104
Biosynthesis of silver and gold
nanoparticles by novel sundried
Cinnamomum camphora
leaf
Jiale Huang
1,2, Qingbiao Li
1,2,3, Daohua Sun
1, Yinghua Lu
1,2,
Yuanbo Su
1,2, Xin Yang
1,2, Huixuan Wang
1,2, Yuanpeng Wang
1,
Wenyao Shao
1, Ning He
1, Jinqing Hong
1and Cuixue Chen
11Department of Chemical and Biochemical Engineering, College of Chemistry and Chemical
Engineering, Xiamen University, Xiamen 361005, People’s Republic of China
2Key Lab for Chemical Biology of Fujian Province, Xiamen University, Xiamen 361005,
People’s Republic of China
E-mail:[email protected]
Received 27 October 2006, in final form 16 January 2007
Published 6 February 2007
Online at
stacks.iop.org/Nano/18/105104
Abstract
The synthesis of nanocrystals is in the limelight in modern nanotechnology.
Biosynthesis of nanoparticles by plant extracts is currently under
exploitation. Not only could silver nanoparticles ranging from 55 to 80 nm in
size be fabricated, but also triangular or spherical shaped gold nanoparticles
could be easily modulated by reacting the novel sundried biomass of
Cinnamomum camphora
leaf with aqueous silver or gold precursors at
ambient temperature. The marked difference of shape control between gold
and silver nanoparticles was attributed to the comparative advantage of
protective biomolecules and reductive biomolecules. The polyol components
and the water-soluble heterocyclic components were mainly responsible for
the reduction of silver ions or chloroaurate ions and the stabilization of the
nanoparticles, respectively. The sundried leaf in this work was very suitable
for simple synthesis of nanoparticles.
S
Supplementary data are available from
stacks.iop.org/Nano/18/105104
(Some figures in this article are in colour only in the electronic version)
1. Introduction
Proliferation of nanotechnology has opened up novel funda-mental and applied frontiers in materials science and
engi-neering, such as quantum dots [1], surface-enhanced Raman
scattering (SERS) [2] and nanobiotechnology [3]. Among
them, nanobiotechnology is the multidisciplinary integration of biotechnology, nanotechnology, chemical processing, physical methodology and systems engineering into biochips,
molec-ular motors, nanocrystals and nanobiomaterials [3]. In the
last decade, biosynthesis of nanoparticles as an emerging high-light of the intersection of nanotechnology and biotechnology has received increasing attention due to a growing need to de-velop environmentally benign technologies in material
synthe-3 Author to whom any correspondence should be addressed.
ses. The significance of such a synthetic protocol has been
well demonstrated [4,5]. For instance, a great deal of effort has
been put into the biosynthesis of inorganic materials, especially
metal nanoparticles, using microorganisms [5] and plants [6].
Both live microorganisms and dead microorganisms are gain-ing importance by virtue of their facile assembly of nanoparti-cles. Prokaryotic bacteria have primarily attracted the most
at-tention in the area of biosynthesis of metal nanoparticles [5]. A
significant demonstration of biosynthesis by prokaryotic
bacte-ria was reported by Klauset al, who described the phenomenon
of biosynthesis of silver-based single crystals at the cell poles
of propagating Pseudomonas stutzeri AG259 [7]. Fu et al
reported biosorption and bioreduction of silver ions by dried
Au alloy assisted by liveLactobacillusstrains and their SERS
applications [9]. It was very interesting that Macaskieet al
had showed the rapid reduction of Pd(II) to Pd(0) by using
Desulfovibrio desulfuricans NCIMB 9307 at the expense of
formate or H2 as electron donors [10]. Our group explored
biosorption and bioreduction of diamine silver complex by
driedCorynebacterium sp. SH09 and Aeromonas sp. SH10
isolated from a gold mine [11,12]. Importantly, Sastryet al
had opened an avenue to the synthesis of metal nanoparticles
by eukaryotic organisms [13,14]. Later, they continued to
ac-complish some excellent work based on fungi, especially
ex-tracellular synthesis of Ag or Au nanoparticles [15–18]. They
demonstrated that the shift from bacteria to fungi as a means of developing natural ‘nano-factories’ has the added advantage that processing and handling of the biomass would be much
simpler [16].
The biosynthetic method employing plant extracts has received some attention as a simple and viable alternative to chemical procedures and physical methods synthesizing
metal nanoparticles only in recent years. Jose-Yacamanet al
firstly reported the formation of gold and silver nanoparticles
by living plants [19, 20]. Sastry et al aforementioned
attained the biosynthesis of metal nanoparticles by plant leaf
extracts and their potential applications [21–29]. They studied
bioreduction of chloroaurate ions or silver ions by a broth
of geranium leaf [21, 22] or Neem leaf [23]. Further, they
had explored the formation mechanism of gold nanotriangles
by lemongrass extracts. The nanotriangles seemed to
grow by a process involving rapid reduction, assembly and room-temperature sintering of ‘liquid-like’ spherical gold
nanoparticles [24]. Then they had also synthesized gold
nanotriangles using Tamarind leaf extract and studied their
potential application in vapour sensing [26]. Very recently,
they have demonstrated synthesis of gold nanotriangles and
silver nanoparticles using Aloe vera plant extracts [29]. It
was explained that only biomolecules of MWs less than 3 kDa caused reduction of chloroaurate ions, leading to the formation
of gold nanotriangles. Nevertheless, the bioreduction of
silver ions proceeded merely in the presence of ammonia. Most of the above research on the synthesis of silver or gold nanoparticles utilizing plant extracts employed broths
resulting from boiling fresh plant leaves [21–29]. Here,
novel sundried C. camphora leaf, previously unexploited
for bioreduction and different from such boiling procedures, was used to synthesize silver and gold nanoparticles in aqueous solutions at ambient conditions, without any additive protecting nanoparticles from aggregating, template shaping
nanoparticles or accelerants like ammonia. Comparative
experiments were carried out to investigate the effect of the biomass dosage on bioreduction and uniformity of the nanoparticles. The pronounced difference of shape control between gold and silver nanoparticles was also discussed. To have a good insight into the bioreduction, FTIR analyses of the dried biomass and the dried nanoparticles were
conducted. The approach appears to be a cost-efficient
alternative to conventional methods of assembling silver and gold nanoparticles so that it would be suitable for developing a biological process for large scale production. It has been reported very recently by our group that some pharmacological
anticancer components could be extracted fromC. camphora
leaf [30].
2. Experimental details
2.1. Preparation of dried biomass
Cinnamomum camphoratrees were cultivated by Xiamen Peony Perfume&Chemicals Industry Co. Ltd, China. The
freshly harvestedC. camphoraleaves were exposed to the sun
until they were completely dried. The biomass used for the reduction was prepared by crushing the dried leaves and then screening the leaf powder by a 20 mesh sieve.
2.2. Synthesis for silver and gold nanoparticles
Two chemicals, silver nitrate (AgNO3) and chloroauric acid
(HAuCl4), were purchased from Sinopharm Chemical Reagent
Co. Ltd, China and were used as received. In a typical
synthesis for silver and gold nanoparticles using dried powder ofC. camphoraleaf, the carefully weighted biomass was added
to 50 ml of 1 mM aqueous AgNO3 and HAuCl4 solution,
respectively, in conical flasks of 100 ml content at room temperature. The flasks were thereafter shaken at a rotation
rate of 150 rpm in the dark at 30◦C.
2.3. UV–vis spectra analysis
The bioreduction of Ag+
or AuCl−
4 in aqueous solution was
monitored by periodic sampling of aliquots (0.2 ml) of the suspension, then diluting the samples with 2 ml deionized water and subsequently measuring UV–vis spectra of the resulting diluents. UV–vis spectroscopy analyses of silver or gold nanoparticles produced were carried out as a function of bioreduction time at room temperature on UNICAM UV-300 spectrophotometers (Thermo Spectronic) at a resolution of 1 nm.
2.4. XRD measurement
After bioreduction, the residual solutions consisting of
hydrosols and residual biomass were dried at 60◦C and the
dried mixture was collected for the determination of the formation of Ag or Au by an X’Pert Pro x-ray diffractometer (PANalytical BV, The Netherlands) operated at a voltage of
40 kV and a current of 30 mA with Cu Kαradiation.
2.5. TEM observation of silver and gold nanoparticles, and SEM and AFM observation of gold nanotriangles
by dropping the suspension onto clean electric glass (Xiamen Ito Photoelectricity Industry Co. Ltd, China) and allowing water to completely evaporate. SEM observations were carried out on a LEO-1530 electron microscope (LEO, Germany). The suspension of gold nanotriangles was cast onto a graphite substrate and they were measured by AFM in the contact mode on a multimode scanning probe microscope (Digital Instrument, USA) with a Nanoscope IIIa controller.
2.6. FTIR analysis of dried biomass before and after bioreduction
After bioreduction, the biomass residue was obtained by centrifuging the residual solution at 4800 rpm for 10 min. Then
the biomass residue was completely dried at 60◦C. The dried
biomass before bioreduction and the residue of C. camphora
leaf after bioreduction were analysed by FTIR Nicolet Avatar 660 (Nicolet, USA).
2.7. FTIR analysis of silver and gold nanoparticles
To remove any free biomass residue or compound that is not the capping ligand of the nanoparticles, the residual solution of 10 ml after reaction was centrifuged at 4800 rpm for 10 min and the resulting suspension was redispersed in 20 ml sterile distilled water. The centrifuging and redispersing process was repeated three times. Thereafter, the purified suspension was
completely dried at 60◦C. Finally, the dried nanoparticles were
analysed by FTIR Nicolet Avatar 660 (Nicolet, USA).
3. Results and discussion
3.1. Biosynthesis of silver nanoparticles by C. camphora leaf
It is generally recognized that UV–vis spectroscopy could be used to examine size- and shape-controlled nanoparticles in
aqueous suspensions [31]. Given the constant aqueous AgNO3
(50 ml, 1 mM), comparative experiments were carried out to investigate the effect of different amounts of the dried biomass on bioreduction and uniformity of target products. The amount of the dried biomass was found to play a critical role in
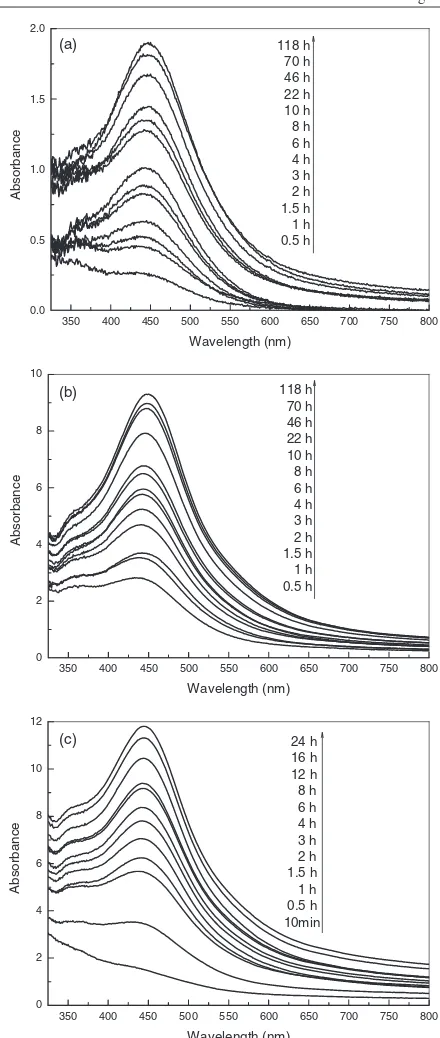
size dispersity of silver nanoparticles. Figure 1 shows the
absorption spectra of silver nanoparticles produced by different amounts of the dried biomass, revealing the production of silver nanoparticles within 1 h after silver ions came in contact
with the biomass. After addition of the biomass to the
solution of silver nitrate, the solution changed from colourless to pale green in about 1 h, the final colour deepening with
the increase of the dried biomass. The evolution of the
absorbance spectra emanating from silver nanoparticles over time manifests increasingly sharp absorbance with increasing time of reaction at around 440 nm. Only absorbance peaks
at about 440 nm may be identified in figure 1(a), obtained
by gently reducing AgNO3 with 0.1 g biomass. However,
distinguished from figure1(a), weak absorbance peaks at about
360 nm may be perceived in figure 1(b), acquired by mild
reduction of silver ions with 0.5 g biomass. The weak peaks
become more apparent in figure 1(c), prepared by rapidly
reducing AgNO3with 1.0 g biomass, than in figure1(b). The
difference may be explained by representative TEM images
shown in figure 2 recorded at different magnifications of
350 400 450 500 550 600 650 700 750 800 0.0 0.5 1.0 1.5 2.0 Absorbance Wavelength (nm) 118 h 70 h 46 h 22 h 10 h 8 h 6 h 4 h 3 h 2 h 1.5 h 1 h 0.5 h
350 400 450 500 550 600 650 700 750 800 0 2 4 6 8 10 Absorbanc e Wavelength (nm) 118 h 70 h 46 h 22 h 10 h 8 h 6 h 4 h 3 h 2 h 1.5 h 1 h 0.5 h
350 400 450 500 550 600 650 700 750 800 0 2 4 6 8 10 12 Absorbance Wavelength (nm) 24 h 16 h 12 h 8 h 6 h 4 h 3 h 2 h 1.5 h 1 h 0.5 h 10min (a) (b) (c)
Figure 1.Absorption spectra of silver nanoparticles after
bioreduction by dried powder ofC. camphoraleaf at 30◦C. The
biomass, (a) 0.1 g, (b) 0.5 g and (c) 1.0 g, was exposed to 50 ml,
1 mM aqueous solution of AgNO3.
particles resulting from the reaction of silver ions and different
amounts of the dried biomass. Figure2(a) displays the TEM
image of typical nanoparticles, produced by 0.1 g biomass, showing that the as-formed nanoparticles were quantitatively
sparse. It could be easily figured out from figure 1 that
insufficiency of the reductive biomolecules for reduction of silver ions was responsible for the formation of the few
particles, as the maximum absorbance in figure1(a) is much
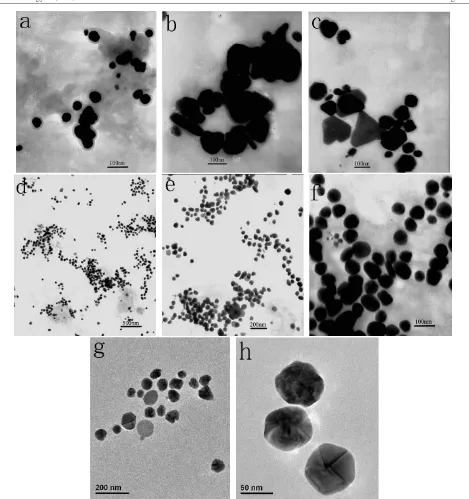
Figure 2.Transmission electron micrographs of silver nanoparticles after bioreduction. The biomass, (a) 0.1 g, (b) and (c) 1.0 g, and (d)–(h)
0.5 g, was exposed to 50 ml, 1 mM aqueous solution of AgNO3at 30◦C. Scale bars: (a)–(c) 100 nm; (d) 500 nm; (e) 200 nm; (f) 100 nm;
(g) 200 nm; (h) 50 nm.
exhibit the TEM images of typical nanoparticles, which were
obtained by 1.0 g biomass. The resulting nanoparticles,
however, were polydisperse. Some anisotropic nanostructures, such as nanotriangles or nanoparticles with irregular contours,
could be observed in figures 2(b) and (c). As a result,
they posed another detectable absorbance at around 360 nm,
besides the absorbance at about 440 nm as seen in figure1(c).
However, the overall morphology of the sample produced by mild reduction of silver ions with 0.5 g biomass is shown in
figure2(d), which indicates that the sample is composed of a
large quantity of largely uniform nanoparticles. According to
size distribution of the silver nanoparticles shown in figure3,
the nanoparticles, mostly ranging from 55 to 80 nm in size,
possess a narrow size distribution. Figures2(e) and (f) show
the morphology of the sample with higher magnification and the average diameter of these nanoparticles was evaluated to
be about 64.8 nm. The size distribution could be further
verified by high-resolution TEM images of the nanoparticles
in the same suspension, as depicted in figures2(g) and (h).
A few ellipsoidal nanoparticles observed in figure2(f) bring
about another weak absorbance at around 360 nm, besides
10 20 30 40 50 60 70 80 90 100 0
5 10 15
Part
icle
Number
Particle Size (nm)
Figure 3.A histogram of size distribution of silver nanoparticles synthesized by the experiment using 0.5 g biomass. The average particle size is 64.8 nm.
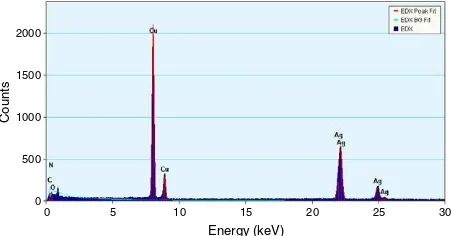
Energy (keV)
Counts
0 500 1000 1500 2000
0 5 10 15 20 25 30
Figure 4.Energy dispersive x-ray spectrum of silver nanoparticles resulting from the experiment using 0.5 g biomass. The different x-ray emission peaks are labelled.
nanoparticles in figures 2(d) and (e) tended to congregate
in solution into clusters, unlike quasi-linear superstructures
illustrated by Sastry et al [22]. It could be concluded that
silver nanoparticles from rapid bioreduction were polydisperse while those from mild reduction were nearly quasi-spherical.
In general, the particle size in figures2(d) and (e) was larger
than that reported by Sastryet alusing leaf broth [22,25,29].
The particles were verified to contain a great deal of Ag using
EDX analysis in figure4 and confirmed as elemental Ag(0)
using XRD as shown in figure5. Pattern 1 in figure5shows the
typical XRD pattern of the sundried leaf before bioreduction. Pattern 2, pattern 3 and pattern 4 are XRD results of silver nanoparticles and the biomass residue after completion of the reaction. In contrast to pattern 1, a couple of Bragg reflections are distinctly exhibited in pattern 2, pattern 3 and pattern 4, which may be indexed on the basis of the face-centred cubic structure of silver. The XRD patterns thus clearly show that the silver nanoparticles are essentially crystalline. Additionally,
the diffractions at around 2θ =22◦resulting from the biomass
or the biomass residue are also notable.
3.2. Biosynthesis of gold nanoparticles by C. camphora leaf
Likewise, given the constant aqueous HAuCl4(50 ml, 1 mM),
comparative experiments were performed to investigate the
10 20 30 40 50
2θ
60 70 80 90
(311) (220) (200)
(111)
In
ten
sity (a.u.
)
1 2 3 4
Figure 5.X-ray diffraction patterns of the as-prepared nanoparticles. Labelled peaks correspond to the characteristic diffraction peaks of elemental Ag(0). Pattern 1 was obtained by XRD analysis of the sundried leaf. Patterns 2, 3 and 4 were derived from XRD analysis of the dried mixtures after reaction of 0.1, 0.5 and 1.0 g biomass with
50 ml, 1 mM aqueous solution of AgNO3, respectively.
effect of different dosages of the dried biomass on bioreduction
and the properties of products. UV–vis spectra that were
recorded at different intervals for the reaction of 0.1 g biomass
with the aqueous HAuCl4 show the appearance of a surface
plasmon resonance (SPR) band at about 570 nm after 2 min of reaction, which increased in intensity with time, accompanied by the advent of a broad absorbance around 1000 nm after
60 min of reaction, as shown in figure6(a). Nevertheless, by
subjecting 0.5 g biomass to the same chloroauric acid, UV–vis
spectra, from curve 1 to curve 4 recorded in figure6(b), show
the appearance of a SPR band at about 570 nm after 2 min of reaction, which shifts to about 530 nm in increasing intensity with time, while the longer absorbance is not present. Curve 5 recorded at 60 min of reaction by exposing the biomass of 1.0 g
dosage to the aqueous HAuCl4still showed single absorbance
at about 520 nm. The prominent difference of the spectra may
be supported by representative TEM images shown in figure7
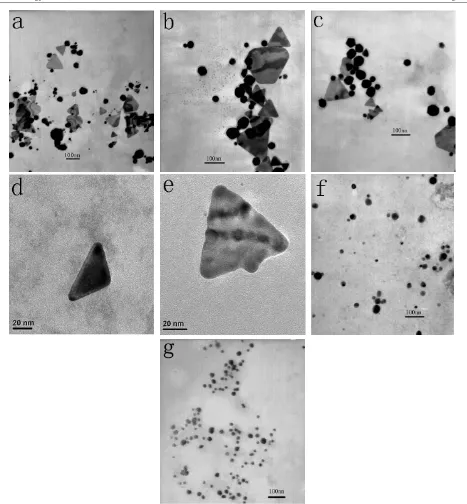
recorded at different magnifications of gold particles resulting from the reduction of chloroaurate ions by different amounts of the dried biomass. Gold nanotriangles with a flat, platelike
morphology, as described by Sastryet al[24], could lead to the
longer absorbance in the near-infrared (NIR) region [24]. We
observed that there were plenty of well-defined nanotriangles together with some quasi-spherical nanoparticles in a final
sample shown in figures7(a)–(c) as well as in the SEM image
(see supplementary online material, figure S1 available at
stacks.iop.org/Nano/18/105104). The coexistence of triangular and spherical particles in the observed hydrosol results in the
two absorbance at around 570 and 1000 nm in figure 6(a),
respectively. Figure7(d) displays an individual nanotriangle
tilting against carbon-coated copper grids. The thickness of typical nanotriangles could be measured to be about 7.0 nm by AFM (see supplementary online material, figure S2 available atstacks.iop.org/Nano/18/105104), comparable to the previous
results [24, 26, 27, 29]. All the nanotriangles under
low-resolution TEM observation are ostensibly flat. In essence, a
high-resolution TEM image, i.e. figure7(e), reveals a bumpy
400 500 600 700 800 900 1000 1100 0.0
0.4 0.8 1.2 1.6 2.0 2.4 2.8
Absorbance
Wavelength (nm) 60 min 30 min 2 min
400 500 600 700 800 900 1000 1100
0.0 0.5 1.0 1.5 2.0 2.5
Absorbanc
e
Wavelength (nm) 1
2 4 5
3
5 4
(a) (b)
Figure 6.Absorption spectra of gold nanoparticles after bioreduction by dried powder ofC. camphoraleaf at 30◦
C. (a) The biomass of 0.1 g
dosage was exposed to 50 ml, 1 mM aqueous solution of HAuCl4. (b) Curve 1–4 arise by exposing the biomass of 0.5 g dosage to 50 ml,
1 mM aqueous solution of HAuCl4. The reaction time of curves 1, 2, 3 and 4 corresponds to 2, 20, 60 and 90 min, respectively. Curve 5 is
recorded at 60 min of reaction by exposing the biomass of 1.0 g dosage to 50 ml, 1 mM aqueous solution of HAuCl4.
‘liquid-like’ colour [24]. However, by switching the amount
of the dried biomass from 0.1 to 0.5 g subjected to the same chloroauric acid, the particles shifted from nanotriangles to
spherical particles shown in figure 7(f). It is interesting
that spherical nanoparticles remain the dominant product in
figure7(g) when the dosage of dried biomass was increased
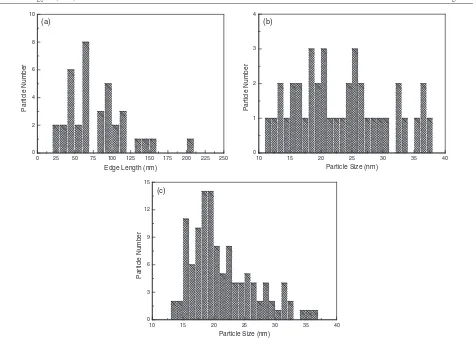
to 1.0 g. In the light of edge length distribution, as depicted in
figure8(a), of the nanotriangles in figures7(a)–(c), the average
edge length was ascertained to be about 80 nm, smaller than
previous studies [24,26–29]. The spherical nanoparticles by
the biomass of 0.5 g dosage in figure7(f) have a size range from
10 to 40 nm and the average particle size was calculated to be
around 23.4 nm, as shown in figure8(b). Although those by the
biomass of 1.0 g dosage in figure7(g) also have the same size
range, as shown in figure8(c), they fall within the narrow size
range from 15 to 25 nm with very high frequency and possess a narrower size distribution and smaller average diameter, about 21.5 nm, than that by 0.5 g biomass. The variation of the two average particle sizes is in good agreement with the shift from 530 nm absorbance of curve 4 to 520 nm absorbance of
curve 5 in figure6(b). The frequency and width of the surface
plasmon absorption depends on the size and shape of the metal nanoparticles as well as on the dielectric constant of the metal
itself and the surrounding medium [32]. Supposing the same
particle shape, medium dielectric constant and temperature, the mean diameter of gold nanoparticles strongly influences the
SPR band in aqueous solution [33]. The reduction of mean
diameter of the nanoparticles could induce a blue shift of the SPR band. The blue shift from 530 to 520 nm with the biomass dosage increasing from 0.5 to 1.0 g is attributed to the overall diminution of gold particle size. The triangular particles were verified to contain a great deal of gold using energy dispersive
x-ray spectrometry, as manifested in figure9. Figure10shows
typical x-ray diffraction patterns of the as-prepared sample and the sundried leaf before bioreduction, respectively. All the reflection peaks in pattern 2, pattern 3 and pattern 4 can be indexed to face-centred cubic gold. The XRD patterns show that the gold nanoparticles are also crystalline in nature.
Apparently, the reduction of chloroaurate ions was much
more rapid than that of silver ions. On adding the dried
biomass to aqueous chloroauric acid, the colour of the shaken solution changed from pale yellow to vivid ruby red, indicating formation of gold nanoparticles almost at
the beginning of the reaction. Merely the absorbance
peaks at ca. 570 nm were detected within 30 min of
reaction, as displayed in figure 6(a). Therefore, we make
sure that the quasi-spherical nanoparticles formed prior to
the nanotriangles. Obviously, gold nanotriangles had not
formed before 30 min of reaction. The longer wavelength absorbance settles at about 1000 nm after completion of reaction. Although the dried biomass fulfilled the reduction of chloroaurate ions, they failed to protect most of the quasi-spherical nanoparticles from aggregating because the water-soluble biomolecules that could specifically adsorb onto spherical nanoparticles to act as protecting agents
were deficient. Since the nascent nanocrystals devoid of
protection were unstable in the thermodynamic sense, the
spherical nanoparticles shown in figures 7(a)–(c) that were
produced early on might be stable owing to the shelter of
the protecting biomolecules. By contrast, those formed
later on might be less stable because such biomolecules
were less available. Gold nanotriangles might grow by
a process involving rapid reduction, assembly and
room-temperature sintering of spherical gold nanoparticles [24]. The
burst of smaller spherical nanoparticles prone to aggregation sped up their sintering into anisotropic particles with time, particularly in the later stage of the reaction. In other words, biomolecules as reductants have a significant advantage over their counterparts as protecting agents and weak passivation of surfaces of the nascent nanocrystals consequently promotes their chain amalgamation. It is evident that sintering of some nanoparticles and their adherence to the nanotriangle could be tracked as some particle-like protuberances were displayed
on the surface of the nanotriangle in figure7(e). The freshly
shaped nanotriangles had high surface energy and it should suffer a shrinking process in order to reduce their surface energy to a minimum level. The process did not produce sharp-angled nanotriangles, but blunt-angled nanotriangles.
Figure 7.TEM images illustrating the formation of gold nanoparticles by exposing (a)–(e) 0.1 g, (f) 0.5 g, biomass to 50 ml, 1 mM aqueous
HAuCl4at 30◦C. Scale bars: (a)–(c) 100 nm; (d) and (e)20 nm; (f) 200 nm; (g) 100 nm.
the biomolecules acting as capping agents strongly shaped spherical nanoparticles rather than nanotriangles though the reductive biomolecules were enhanced. The biomass offers sufficient protective biomolecules. Thus, strong interaction between such biomolecules and surfaces of the shaped nanoparticles prevent nascent gold nanocrystals from rapid sintering. When the biomass of 1.0 g dosage was employed, the interaction was intensified, leading to size reduction of the spherical nanoparticles in comparison with those by the
0.5 g biomass. Sastryet alelucidated that formation of gold
nanotriangles by the Turkevich method using citrate reduction
was highly favoured at low temperatures [34]. However, it
was found herein that formation of gold nanotriangles byC.
camphoraleaf at ambient temperature strongly depended on the amount of the dried biomass.
3.3. Pronounced difference of shape control between gold and silver nanoparticles by C. camphora leaf
The pronounced difference of shape control between gold and silver nanoparticles has not been well elucidated. Sastry
et al pondered that it could be due to the differences in weak binding of the biomolecules with the surface of silver
0 25 50 75 100 125 150 175 200 225 250 0
2 4 6 8 10
Part
icle Numbe
r
Edge Length (nm)
10 15 20 25 30 35 40
0 1 2 3 4
Part
icle Number
Particle Size (nm)
10 15 20 25 30 35 40
0 3 6 9 12 15
P
art
icle Number
Particle Size (nm)
(a) (b)
(c)
Figure 8.Size distribution of gold nanoparticles synthesized. (a) A histogram of edge length distribution of gold nanotriangles in
figures7(a)–(c). The average edge length is about 80.0 nm; (b) a histogram of size distribution of spherical gold nanoparticles by 0.5 g
biomass in figure7(f). The average particle size is about 23.4 nm; (c) a histogram of size distribution of spherical gold nanoparticles by 1.0 g
biomass in figure7(g). The average particle size is about 21.5 nm.
5000
4000
3000
2000
1000
0
0 10 20
Energy (keV)
Counts
30 40
Figure 9.Energy dispersive x-ray spectrum of gold nanotriangles resulting from the before-mentioned experiment using 0.1 g biomass. The different x-ray emission peaks are labelled.
nascent silver nanocrystals could lead to isotropic growth of the
crystals and thus formation of spherical particles [29]. As far as
silver ions are concerned, the biomass offers affluent protective biomolecules but comparatively lean reductive counterparts when the synthetic recipes employing 0.1 or 0.5 g biomass were adopted. Nascent silver nanocrystals produced gradually were enclosed by the protective molecules. As a result, it eliminated rapid sintering of smaller nanoparticles, which is mainly responsible for the formation of the nanotriangles. It is
10 20 30 40 50
2θ
60 70 80 90
In
ten
sity (a.u.)
1 2 3 4 (111)
(200)
(220) (311)
(222)
Figure 10.X-ray diffraction patterns of the as-prepared nanoparticles. Labelled peaks correspond to the characteristic diffraction peaks of elemental Au(0). Pattern 1 was obtained by XRD analysis of the sundried leaf. Patterns 2, 3 and 4 were derived from XRD analysis of the dried mixtures after reaction of 1.0, 0.5 and
0.1 g, biomass with 50 ml, 1 mM aqueous solution of HAuCl4,
respectively.
1000 1100 1200 1300 1400 1500 1600 1700 1800 Tran smittan ce (a.u .)
Wavenumber (cm-1) 1 2 3 110 9 1384 1517 1244 1317 1631 1726 1446 1630 1384 1076 1513 1316
Figure 11.Typical FTIR absorption spectra of the leaf biomass before bioreduction (1), after bioreduction of silver ions (2) and after bioreduction of chloroaurate ions (3).
was introduced into the same solution of silver nitrate. It would
promote the effect of Ostwald ripening [35]. Remarkable
augmentation of the reductive biomolecules makes some nascent crystals rapidly sinter into anisotropic nanostructures
under rapid bioreduction. Some anisotropic particles of
silver including a few quasi-nanotriangles could be produced,
as seen in figure 2(c). Conversely, for chloroaurate ions,
the reductive biomolecules dictated the formation of gold nanotriangles when the dosage of dried biomass was 0.1 g. When the dosage was increased to 0.5 or 1.0 g, it allowed the protective biomolecules to have control over the formation of the spherical nanoparticles. It would reduce the effect of
Ostwald ripening [35] and pose a diffusion-controlled process.
The diffusion current of gold atoms across the grain boundary would be curbed by the protective biomolecules. As reaction time elapses, the boundary of the produced particles expands in an isotropic fashion even though the reductive biomolecules augment enormously with the increase of biomass. Owing to the rich reductive biomolecules, however, the nuclei of gold species form simultaneously at the commencement of the bioreduction, with little subsequent nucleation of smaller
particles [35]. As a consequence, the nucleation process is
relatively fast while the growth process remains relatively
slow [34], resulting in gold nanoparticles with narrow size
distribution. In conclusion, the more the dosage of the
biomass, the stronger the interaction between biomolecules
and nascent nanocrystals. However, with the increase
of biomass dosage, the interaction between the protective biomolecules and nascent gold nanocrystals was remarkably enhanced so that the addition of gold atoms to the surfaces of the nanocrystals was slowed down. In contrast, with the dosage increasing, the interaction between the protective biomolecules and nascent silver nanocrystals was little strengthened while the addition of silver atoms to surfaces of the nanocrystals was expedited. It allows rapidly produced silver atoms to get through the protective biomolecules and reach the surfaces
of the nanocrystals in a drastic manner. In a word, the
marked difference of shape control between gold and silver nanoparticles may be attributed to the comparative advantage of protective biomolecules and reductive biomolecules in
1000 1100 1200 1300 1400 1500 1600 1700 1800 1900 2000
104
2
Transmittance (a.u.
)
Wavenumber (cm-1
)
1384
1042 1077 1606
1762 1622 1384 1077 1715 1 2
Figure 12.Typical FTIR absorption spectra of the dried silver nanoparticles (1) and gold nanoparticles (2).
the bioreduction of silver ions and chloroaurate ions by the biomass.
3.4. FTIR analysis results of the biomass before and after bioreduction
Our previous study on extraction of pharmaceutical
com-ponents from the C. camphora leaf showed that alkaloids,
flavones, hydroxybenzenes, anthracenes, steroids, terpenoids, coumarins, lactones, linalools, polysaccharides, amino acids
and proteins exist in such a leaf [30, 36]. FTIR absorption
spectra of the dried biomass ofC. camphoraleaf before and
after bioreduction, as shown in figure11, can offer
informa-tion regarding the chemical change of the funcinforma-tional groups involved in bioreduction. Some absorbance bands centred at
1109, 1244, 1317, 1384, 1446, 1517, 1631 and 1726 cm−1are
observed in the region 1000–1800 cm−1. Among them, the
absorbance bands at 1109, 1631 and 1726 cm−1 in curve 1
were associated with the stretch vibration of –C–O, –C=C,
RHC=O, respectively [37]. To a large extent, the band at
1109 cm−1 might be contributed by the –C–O groups of the
polyols such as flavones, terpenoids and polysaccharides in the biomass. It could be figured out by comparison of curve 1, curve 2 and curve 3 that the disappearance of the band at
1109 cm−1after bioreduction shows that the polyols are mainly
responsible for the reduction of silver ions or chloroaurate ions. It is speculated that the alcohol groups are oxidized to
car-bonyl groups, thus leading to the band 1726 cm−1. All in all,
the water-soluble fractions in the biomass played complicated roles in the bioreduction of the precursors and shape evolution of the nanoparticles.
3.5. FTIR analysis results of silver and gold nanoparticles
Representative FTIR spectra of the obtained nanoparticles are
shown in figure12, which manifests several absorption peaks
located at about 1042, 1077, 1384, 1606, 1622, 1715 and
1762 cm−1in the region 1000–2000 cm−1. The two
absorp-tion peaks located at around 1042 and 1077 cm−1 can be
assigned as the absorption peaks of –C–O–C– or –C–O–
and 1622 cm−1 may result from the stretching vibration of
–C=C– [37]. In addition, there are some weak absorption
spectra in the region 1700–1800 cm−1, which can be attributed
to the stretching vibration of –C=O [37]. For silver
nanoparti-cles, the absorption at about 1384 cm−1(curve 1) was notably
enhanced in that NO−
3 existed in the residual solution [38].
To a large extent, the bonds or functional groups, such as
–C–O–C–, –C–O–, –C=C– and –C=O, derive from the
heterocyclic compounds that are water-soluble components in the dried biomass. Therefore, it is thought that the water-soluble heterocyclic compounds, e.g. alkaloids, flavones and anthracenes, are the capping ligands of the nanoparticles. In the polyol synthesis extensively studied for silver or gold nanoparticles, both oxygen and nitrogen atoms of the pyrroli-done unit can facilitate the adsorption of PVP onto the surface of metal nanostructures to fulfil the protection of the
nanopar-ticles [39]. Likewise, the oxygen atoms herein might facilitate
the adsorption of the heterocyclic components onto the particle surface in stabilizing the nanoparticles.
3.6. Sundried leaf versus leaf broth
Most of the previous research on synthesis of Ag or Au nanoparticles using plant extracts employed a broth resulting from boiling fresh plant leaves. We deem that the sundried biomass has some advantages over the broth. The approach using the broth suffers from two main drawbacks. Firstly, most of the leaves are seasonal so that fresh leaves would not be readily available for the bioreduction all the time. Secondly, it is fairly difficult to control some parameters accurately such as the optimum boiling time when the broth is attained. However, our work demonstrated that the route using the sundried biomass could circumvent these two limitations. On the one hand, the sundried biomass could be preserved as an excellent bioreductant, conveniently available any time for biosynthesis of the nanoparticles. On the other hand, not only could silver nanoparticles with concentrated size distribution be fabricated, but also triangular or spherical nanoparticles of gold could be facilely controlled by simply adjusting the amount of dried biomass. The bioreduction above proceeded extracelluarly so that few nanoparticles were bound by the biomass residue and almost all nanoparticles were dispersed in the suspension. The approach to silver and gold nanoparticles byC. camphora leaf has the same advantage as downstream processing and handling of the nanoparticle suspension would be much easier. It would be of practical value to develop a cost-effective biochemical process for mass-producing the
nanoparticles by sundriedC. camphoraleaf. Beyond all doubt,
the utilization of sundriedC. camphora leaf for biosynthesis
of the nanoparticles has defects. For example, the drying
process of the leaf in the sun is time-consuming. Moreover, there is more biomass residue in the resulting hydrosols of nanoparticles using sundried leaf powder than fresh leaf broth.
4. Conclusions
In summary, we demonstrated a bioreductive approach to silver
and gold nanoparticles using novel sundried biomass of C.
camphora leaf. The size dispersity of quasi-spherical silver nanoparticles as well as triangular or spherical shapes of gold
nanoparticles could be facilely controlled by simple variation of the amount of biomass reacting with aqueous solution of
AgNO3 or HAuCl4. The marked difference of shape control
between gold and silver nanoparticles may be attributed to the comparative advantage of protective biomolecules and reductive biomolecules. The polyol components and the water-soluble heterocyclic components were mainly responsible for the reduction of silver ions or chloroaurate ions and the stabilization of the nanoparticles, respectively. Instead of the
boiled leaf broth from previous studies, sundriedC. camphora
leaf appears to be an environmentally friendly and low-cost candidate as reductant for synthesizing silver or gold nanoparticles.
Acknowledgments
This work is supported by the National Natural Science Foundation of China (Grant Nos 20576109 and 20376076). The authors thank the Analysis and Testing Centre of Xiamen University for the analysis and observation work, and Professor Zhaoxiong Xie, Dr Jianmei Li and Dr Haiming Zhang for their help in this study.
References
[1] Chan W C W and Nie S 1998Science2812016
[2] Tian Z and Ren B 2004Annu. Rev. Phys. Chem.55197
[3] Klefenz H 2004Eng. Life Sci.4211
[4] Debaditya B and Rajinder G 2005Crit. Rev. Biotechnol.
25199
[5] Mandal D, Bolander M E, Mukhopadhyay D, Sarkar G and
Mukherjee P 2006Appl. Microbiol. Biotechnol.69485
[6] Gardea-Torresdey J L, Tiemann K J, Gomez E, Dokken K,
Tehuacanero S and Jose-Yacaman M 1999J. Nanopart. Res.
1397
[7] Klaus T, Joerger R, Olsson E and Granqvist C 1999Proc. Natl
Acad. Sci.9613611
[8] Fu J, Liu Y, Gu P, Tang D, Lin Z, Yao B and Wen S 2000Acta
Phys.-Chim. Sin.16779
[9] Nair B and Pradeep T 2002Cryst. Growth Des.2293
[10] Yong P, Rowson N, Farr J P G, Harris I and Macaskie L 2002 Biotechnol. Bioeng.80369
[11] Zhang H, Li Q, Lu Y, Sun D, Lin X, Deng X, He N and
Zheng S 2005J. Chem. Technol. Biotechnol.80285
[12] Fu M, Li Q, Sun D, Lu Y, He N, Deng X, Wang H and
Huang J 2006Chin. J. Chem. Eng.14114
[13] Mukherjee Pet al2001Angew. Chem. Int. Edn403585
[14] Mukherjee Pet al2001Nano Lett.1515
[15] Mukherjee P, Senapati S, Mandal D, Ahmad A, Khan M I,
Kumar R and Sastry M 2002ChemBioChem3461
[16] Sastry M, Ahmad A, Khan M I and Kumar R 2003Curr. Sci.
85162
[17] Ahmad A, Mukherjee P, Senapati S, Mandal D, Khan M I,
Kumar R and Sastry M 2003Colloids Surf.B28313
[18] Ahmad A, Senapati S, Khan M I, Kumar R and Sastry M 2005 J. Biomed. Nanotechnol.147
[19] Gardea-Torresdey J L, Parsons J G, Dokken K, Peralta-Videa J,
Troiani H E, Santiago P and Jose-Yacaman M 2002Nano
Lett.2397
[20] Gardea-Torresdey J L, Gomez E, Peralta-Videa J, Parsons J G,
Troiani H and Jose-Yacaman M 2003Langmuir191357
[21] Shankar S S, Ahmad A, Pasricha R and Sastry M 2003 J. Mater. Chem.131822
[22] Shankar S S, Ahmad A and Sastry M 2003Biotechnol. Prog.
[23] Shankar S S, Rai A, Ahmad A and Sastry M 2004J. Colloid Interface Sci.275496
[24] Shankar S S, Rai A, Ankamwar B, Singh A, Ahmad A and
Sastry M 2004Nat. Mater.3482
[25] Ankamwar B, Damle C, Ahmad A and Sastry M 2005 J. Nanosci. Nanotechnol.51665
[26] Ankamwar B, Chaudhary M and Sastry M 2005Synth. React.
Inorg. Met.-Org. Nano-Metal Chem.3519
[27] Shankar S S, Rai A, Ahmad A and Sastry M 2005Chem.
Mater.17566
[28] Rai A, Singh A, Ahmad A and Sastry M 2006Langmuir
22736
[29] Chandran S P, Chaudhary M, Pasricha R, Ahmad A and
Sastry M 2006Biotechnol. Prog.22577
[30] Su Y, Li Q, Yao C, Lu Y and Hong J 2006Chin. Chem. Ind.
Eng. Prog.25200
[31] Wiley B J, Im S H, McLellan J, Siekkinen A and Xia Y 2006 J. Phys. Chem.B11015666
[32] Burda C, Chen X, Narayanan R and El-Sayed M A 2005Chem.
Rev.1051025
[33] Daniel M and Astruc D 2004Chem. Rev.104293
[34] Shankar S S, Bhargava S and Sastry M 2005J. Nanosci.
Nanotechnol.51721
[35] Cushing B L, Kolesnichenko V L and O’Connor C J 2004 Chem. Rev.1043893
[36] Gao J 2003Botanic Chemistry(Beijing: Scientific Publisher)
[37] Zhu M 2000Apparatus Analyses(Beijing: Higher Education
Press)
[38] Luo L, Yu S, Qian S and Zhou T 2005J. Am. Chem. Soc.
1272822