AN EFFICIENT DIMENSIONAL REDUCTION
METHOD FOR DATA CLUSTERING
Rahmat Widia Sembiring, Sajadin Sembiring and Jasni Mohamad Zain
Abstract. The current data tends to be more complex than conventional data
and need dimension reduction. Dimension reduction is important in cluster anal-ysis and creates a smaller data in volume and has the same analytical results as the original representation. A clustering process needs data reduction to obtain an efficient processing time while clustering and mitigate curse of dimensional-ity. This paper proposes a model for extracting multidimensional data clustering of health database. We implemented four dimension reduction techniques such as Singular Value Decomposition (SVD), Principal Component Analysis (PCA), Self Organizing Map (SOM) and FastICA. The results show that dimension reductions significantly reduce dimension and shorten processing time and also increased per-formance of cluster in several health datasets.
1. INTRODUCTION
The current data tends to be multidimensional and high dimension, and more complex than conventional data. Many clustering algorithms have been proposed and often produce clusters that are less meaningful. The use of multidimensional data will result in more noise, complex data, and the possibility of unconnected data entities. This problem can be solved by using clustering algorithm. Several clustering algorithms grouped into
Received 20-10-2011, Accepted 07-12-2011.
2010 Mathematics Subject Classification: 91C20; 62H30; 68T10.
Key words and Phrases: DBSCAN; dimension reduction; SVD; PCA; SOM; FastICA.
cell-based clustering, density based clustering, and clustering oriented. To obtain an efficient processing time to mitigate a curse of dimensionality while clustering, a clustering process needs data reduction. Dimension reduction is a technique that is widely used for various applications to solve curse of dimensionality.
Dimension reduction is important in cluster analysis, which not only makes the high dimensional data addressable and reduces the computational cost, but can also provide users with a clearer picture and visual examination of the data of interest [6]. Many emerging dimension reduction techniques proposed, such as Local Dimensionality Reduction (LDR) tries to find local correlations in the data, and performs dimensionality reduction on the lo-cally correlated clusters of data individually [3], where dimension reduction as a dynamic process adaptively adjusted and integrated with the clustering process [4].
Sufficient Dimensionality Reduction (SDR) is an iterative algorithm [8], which converges to a local minimum of p∗ = arg min
˜
p∈P θDKL[p|˜p] and
hence solves the Max-Min problem as well. A number of optimizations can solve this minimization problem, and reduction algorithm based on Bayesian inductive cognitive model used to decide which dimensions are advantageous [11]. Developing an effective and efficient clustering method to process mul-tidimensional and high dimensional dataset is a challenging problem.
This paper is organized into a few sections. Section 2 will present the related work. Section 3 explains the materials and method. Section 4 elucidates the results followed by discussion in Section 5. Section 6 deals with the concluding remarks.
2. RELATED WORK
ability to identify a small number of important inputs (for predicting the target) from a much larger number of available inputs, and is effective in cases when there are more inputs than cases or observations.
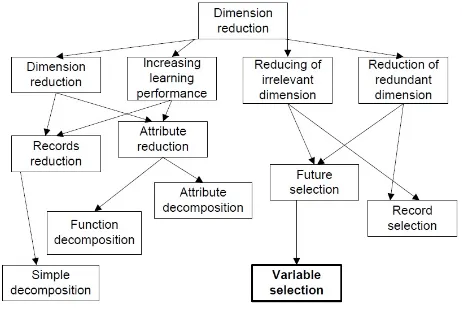
Figure 1: Taxonomy of dimension reduction problem
Dimension reduction methods associated with regression, additive mod-els, neural network modmod-els, and methods of Hessian [6], one of which is the local dimension reduction (LDR), which is looking for relationships in the dataset and reduce the dimensions of each individual, then using a multidi-mensional index structure [3]. Nonlinear algorithm gives better performance than PCA for sound and image data [14], on the other studies mentioned Principal Component Analysis (PCA) is based on dimension reduction and texture classification scheme can be applied to manifold statistical frame-work [3].
In most applications, dimension reduction performed as pre-processing step [5], performed with traditional statistical methods that will parse an increasing number of observations [6]. Reduction of dimensions will create a more effective domain characterization [1]. Sufficient Dimension Reduc-tion (SDR) is a generalizaReduc-tion of nonlinear regression problems, where the extraction of features is as important as the matrix factorization [8], while SSDR (Semi-supervised Dimension Reduction) is used to maintain the orig-inal structure of high dimensional data [27].
spaceℜdto lower dimension feature spaceℜddenotes asF(x) :ℜd→ ℜd[26,
15]. Dimension reduction techniques, such as principal component analysis (PCA) and partial least squares (PLS) can used to reduce the dimension of the microarray data before certain classifier is used [25].
We compared four dimension reduction techniques and embedded in DBSCAN, these dimension reduction are:
A. SVD
The Singular Value Decomposition (SVD) is a factorization of a real or complex matrix. The equation for SVD of X is X = U SVT [24], where
U is an m×n matrix, S is an n×n diagonal matrix, and VT is also an
n×n matrix. The columns of U are called theleft singular vectors,{uk},
and form an orthonormal basis for the assay expression profiles, so that ui·uj = 1 fori=j, and ui·uj = 0 otherwise. The rows of VT contain the
elements of the right singular vectors {vk}, and form an orthonormal basis
for the gene transcriptional responses. The elements of S are only nonzero on the diagonal, and are called thesingular values.Thus, S = diag(s1, ..., sn).
Furthermore, sk > 0 for 1 ≤ k ≤ r, and si = 0 for (r + 1) ≤ k ≤ n. By
convention, the ordering of the singular vectors is determined by high-to-low sorting of singular values, with the highest singular value in the upper left index of the S matrix.
B. PCA
PCA is a dimension reduction technique that uses variance as a measure of interestingness and finds orthogonal vectors (principal components) in the feature space that accounts for the most variance in the data [19]. Prin-cipal component analysis is probably the oldest and best known of the tech-niques of multivariate analysis, first introduced by Pearson, and developed independently by Hotelling [12].
The advantages of PCA are identifying patterns in data, and expressing the data in such a way as to highlight their similarities and differences. It is a powerful tool for analyzing data by finding these patterns in the data. Then compress them by dimensions reduction without much loss of information [23]. Algorithm PCA [7] shown as follows:
1. Recover basis: CalculateXXT =Pt
i=1xixiT and letU= eigenvectors
2. Encode training data: Y =UTX whereY is adxtmatrix of encodings
A self-organizing map (SOM) is a type of artificial neural network that is trained using unsupervised learning to produce a low-dimensional (typi-cally two-dimensional), discretized representation of the input space of the training samples, and called a map [14]. Self-organizing maps are different from other artificial neural networks in the sense that they use a neighbor-hood function to preserve the topological properties of the input space. This makes SOMs useful for visualizing low-dimensional views of high-dimensional data, akin to multihigh-dimensional scaling. The model was first described as an artificial neural network by the Finnish professor Teuvo Ko-honen, and is sometimes called a Kohonen map.
D. FastICA
Independent Component Analysis (ICA) introduced by Jeanny Hrault and Christian Jutten in 1986, later clarified by Pierre Comon in 1994 [22]. FastICA is one of the extensions of ICA, which is based on point iter-ation scheme to find the nongaussianity [9], can also be derived as ap-proximate Newton iteration, FastICA using the following formula: W+ = W +diag(αi)[diag(βi +E{g(y)yT}]W where y = Wx, βi = −E{yig(yi)}
and αi =−1/(βi−E{g′(yi)}) matricesW need to orthogonalizedafter each
phase have been processed.
3. MATERIAL AND METHOD
Figure 2: Proposed model compared based on dimension reduction and DBSCAN clustering
Table 1: Attribute Dimension Reduction
Dimension Number of attribute for each datasets
reduction E-coli Acute implant Blood transfusion Prostate cancer
with SVD 1 1 1 1
with PCA 5 4 1 3
with SOM 2 2 1 2
with FastICA 8 8 5 18
without
dimension 8 8 5 18
reduction
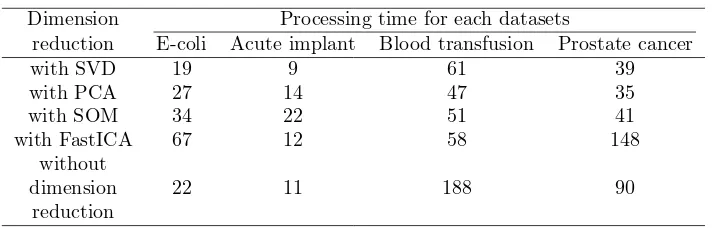
Table 2: Processing time
Dimension Processing time for each datasets
reduction E-coli Acute implant Blood transfusion Prostate cancer
with SVD 19 9 61 39
with PCA 27 14 47 35
with SOM 34 22 51 41
with FastICA 67 12 58 148
without
dimension 22 11 188 90
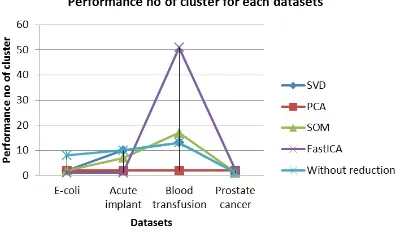
Table 3: Performance no of cluster
Dimension Performance no of cluster for each datasets
reduction E-coli Acute implant Blood transfusion Prostate cancer
with SVD 2 10 13 1
with PCA 2 2 2 2
with SOM 2 7 17 1
with FastICA 1 1 51 2
without
dimension 8 10 13 1
reduction
[21]. There are four dimension reduction techniques tested in the proposed model, namely SVD, PCA, SOM, FastICA.
Dimensions reduction result is processed into DBSCAN cluster tech-nique. DBSCAN needsε(eps) and the minimum number of points required to form a cluster (minPts) including mixed Euclidean distance as distance measure. For the result of DBSCAN clustering using functional data to similarity, it calculates a similarity measure from the given data (attribute based), and another output of DBSCAN that is measured isperformance-1, this simply provides the number of clusters as a value.
Result of data to similarity takes an exampleSet as input for filter examples and returns a new exampleSet including only the examples that fulfill a condition. By specifying an implementation of a condition, and a parameter string, arbitrary filters can be applied and directly derive a performance-2 as measure from a specific data or statistics value, then pro-cess expectation maximum cluster with parameterk = 2, max runs = 5, max optimization step = 100, quality =1.0E-10andinstall distribution=k-means run.
4. RESULTS
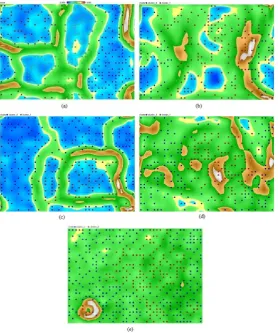
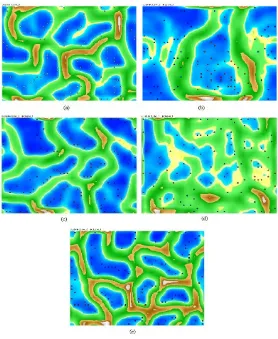
Figure 3: E-coli datasets based on (a) DBSCAN without dimension reduc-tion; (b) DBSCAN and SVD; (c) DBSCAN and PCA; (d) DBSCAN and SOM; (e) DBSCAN and FastICA
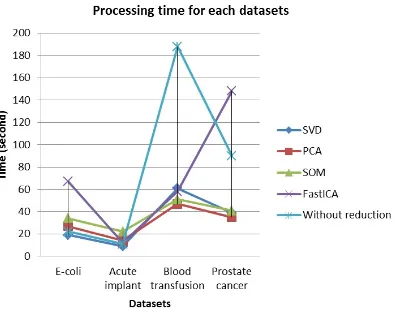
To find out efficiency we conducted the testing and record for process-ing time, as shown in Table 2. Usprocess-ing SVD, PCA, SOM and FastICA we also conducted the testing process and found performance no of cluster, as shown in Table 3.
of E-coli datasets based on DBSCAN and PCA, Figure. 3d is a cluster of E-coli datasets based on DBSCAN and SOM, while Figure. 3e is the result of the cluster by using DBSCAN within FastICA dimension reduction.
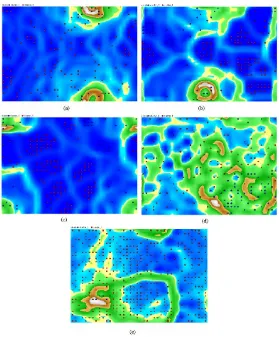
Another result obtained for acute implant datasets, at Figure. 4a-e pr4a-es4a-ent acut4a-e implant datas4a-ets bas4a-ed on DBSCAN without dim4a-ension reduction and within a various dimension reduction.
Figure 4: Acute implant datasets based on (a) DBSCAN without dimension reduction; (b) DBSCAN and SVD; (c) DBSCAN and PCA; (d) DBSCAN and SOM; (e) DBSCAN and FastICA
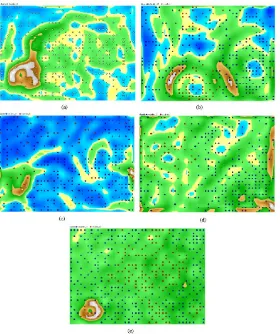
Figure 5: Blood transfusion datasets based on (a) DBSCAN without di-mension reduction; (b) DBSCAN and SVD; (c) DBSCAN and PCA; (d) DBSCAN and SOM; (e) DBSCAN and FastICA
reduction.
Using same dimension reduction techniques, we clustered prostate can-cer, result we present at Figure 6a-e, based on DBSCAN without dimension reduction and within a various dimension reduction.
Figure 6: Prostate cancer datasets based on (a) DBSCAN without dimen-sion reduction; (b) DBSCAN and SVD; (c) DBSCAN and PCA; (d) DB-SCAN and SOM; (e) DBDB-SCAN and FastICA
5. DISCUSSION
Dimension reduction before clustering process is to obtain efficient pro-cessing time and increase accuracy of cluster performance. Based on results in previous section, dimension reduction can shorten processing time and has lowest number of attribute. Figure 7 shows DBSCAN with SVD has lowest number of reduced attribute.
Figure 7: Reduction number of attributes
several datasets we found DBSCAN within SVD has lowest processing time.
Figure 8: Reduction number of attributes
Cluster process with FastICA dimension reduction has highest cluster performance for blood datasets (Figure 9), but lowest in other datasets, while PCA has lowest performance for overall datasets.
6. CONCLUSION
Figure 9: Reduction number of attributes
performance. DBSCAN with SVD has lowest processing time for several datasets. SVD also create lowest number of reduced attribute. In general, dimension reduction shows an increased cluster performance.
References
[1] Bi, Jinbo, Kristin Bennett, Mark Embrechts, Curt Breneman and Minghu Song. ”Dimensionality Reduction via Sparse Support Vec-tor Machine”, Journal of Machine Learning Research 3, pp.1229-1243 (2003)
[2] Chakrabarti, Kaushik, Sharad Mehrotra. ”Local Dimensionality Re-duction : A New Approach To Indexing High Dimensional Space”, Proceeding Of The 26th VLDB Conference, Cairo, Egypt, pp.89-100 (2000)
[3] Choi, S. W.; Martin, E. B.; Morris, A. J.; Lee, I.-B : Fault detection based on a maximum likelihood PCA mixture, Ind. Eng. Chem. Res., 44, 2316?2327, (2005)
[4] Ding, Chris, Tao Li. Adaptive Dimension Reduction Using Discrim-inant Analysis and K-means Clustering, International Conference on Machine Learning, Corvallis, OR, 2007
[6] Fodor, I.K.A Survey of Dimension Reduction Techniques. LLNL Tech-nical Report, UCRL-ID-148494”, pp.1-18 (2002)
[7] Ghodsi, Ali. Dimensionality Reduction, A Short Tutorial, Technical Report, 2006-14, Department of Statistics and Actuarial Science, Uni-versity of Waterloo, pp. 5-6 (2006)
[8] Globerson, Amir, Naftali Tishby. ”Sufficient Dimensionality Reduc-tion”,Journal of Machine Learning Research 3, pp. 1307-1331 (2003)
[9] Hyvaerinen, Aapo, Erkki Oja.Independent Component Analysis: Algo-rithms and Applications, Neural Networks, pp. 411-430 (2002)
[10] Hyvarinen, A., Oja, E. Independent Component Analysis: Algorithms and Applications. Neural Networks 13, pp.411–430 (2000).
[11] Jin, Longcun, Wanggen Wan, Yongliang Wu, Bin Cui, Xiaoqing Yu, Youyong Wu. ”A Robust High-Dimensional Data Reduction Method”, The International Journal Of Virtual Reality 9(1), pp.55-60 (2010)
[12] Jolliffe, I.T. em Principal Component Analysis, Springer Verlag New York Inc. New York, pp. 7-26 (2002)
[13] Kambhatla, Nanda , Todd K. Leen. Fast em Non-Linear Dimension Reduction, (1994)
[14] Kohonen, T., Kaski, S. and Lappalainen, H. (1997). Self-organized formation of various invariant-feature filters in the adaptive-subspace SOM. Neural Computation, 9: 1321-1344.
[15] Larose, Daniel T. Data Mining Methods And Models, John Wiley & Sons Inc, New Jersey, pp.1-15 (2006)
[16] Maimon, Oded, Lior Rokach. Data Mining And Knowledge Discovery Handbook, Springer Science+Business Media Inc, pp.94-97 (2005)
[17] Maimon, Oded, Lior Rokach. Decomposition Methodology For Knowl-edge Discovery And Data Mining, World Scientific Publishing Co, Pte, Ltd, Danvers MA, pp. 253-255 (2005)
[19] Poncelet, Pascal, Maguelonne Teisseire, Florent Masseglia. Data Min-ing Patterns: New Methods And Application, Information Science Ref-erence, Hershey PA, pp. 120-121 (2008)
[20] Sembiring, Rahmat Widia, Jasni Mohamad Zain, Abdullah Embong. Clustering High Dimensional Data Using Subspace And Projected Clus-tering Algorithm,International Journal Of Computer Science & Infor-mation Technology (IJCSIT) Vol.2, No.4, pp.162-170 (2010)
[21] Sembiring, Rahmat Widia, Jasni Mohamad Zain, Abdullah Embong. Alternative Model for Extracting Multidimensional Data Based-On Comparative Dimension Reduction, ICSECS (2), pp. 28-42, (2011)
[22] Sembiring, Rahmat Widia, Jasni Mohamad Zain. Cluster Evaluation Of Density Based Subspace Clustering,Journal Of Computing, Volume 2, Issue 11, pp.14-19 (2010)
[23] Smith, Lindsay I. A Tutorial on Principal Component Analysis, http://www.cs.otago.ac.nz/cosc453/student-tutorials/principal com-ponents.pdf, pp.12-16 (2002)
[24] Wall, Michael E., Andreas Rechtsteiner, Luis M. Rocha.Singular value decomposition and principal component analysis, A Practical Approach to Microarray Data Analysis. D.P. Berrar, W. Dubitzky, M. Granzow, Kluwer: Norwell, MA, LANL LA-UR-02-4001, eds. pp. 91-109 (2003)
[25] Wang, John. Encyclopaedia of Data Warehousing and Data Mining, Idea Group Reference, Hershey PA, pp. 812 (2006)
[26] Xu, Rui, Donald C. Wunsch II. Clustering”, John Wiley & Sons, Inc, New Jersey, pp. 237-239 (2009)
[27] Zhang, Daoqiang, Hua Zhou Zhi, Songcan Chen’ Semi-Supervised Di-mensionality Reduction, 7th SIAM International Conference on Data Mining, pp.629-634, (2008)
Rahmat Widia Sembiring: Politeknik Negeri Medan, Medan 20155, Indonesia E-mail: [email protected]
Sajadin Sembiring: Teknik Informatika, STT Harapan Medan, Medan 20152,
E-mail: [email protected]
Jasni Mohamad Zain: Faculty of Computer System and Software Engineering,
Universiti Malaysia Pahang, Malaysia