PROCEEDING The 13th Malaysia Indonesia Conference on Economics, Management and Accounting (MIICEMA) 2012
784
Income Disparity in ASEAN 2000-2010
Sisca Oktavia Sentosa Taufiq Marwa
Azwardi
Abstract
The objective of this study is to empirically examine the income disparity between countries in Southeast Asia (ASEAN) during the period of 2000 to 2010, utilizing Williamson Index as the measurement. The results suggest that income disparity between ASEAN countries is getting smaller during the observation period.
Introduction
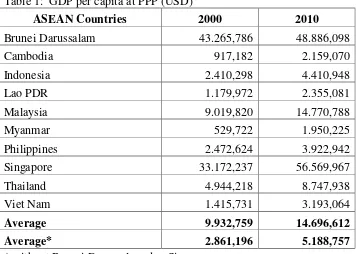
Virtually all of the observed rise in the world‟s income inequality has been driven by widening gaps between nations, and almost none has been driven by widening gaps within nations (Lindert and Williamson, 2003). Every region always has both developed and developing countries (Sofiagy,2010). And so does the Southeast Asia (hereafter referred to as „SEA‟ in this paper) region with its diverse economy (Bunyaratavej and Hahn, 2003; Park, 2000). There are countries with high GDP per capita and countries with low GDP per capita as shown in Table 1.
Table 1: GDP per capita at PPP (USD)
ASEAN Countries 2000 2010
Brunei Darussalam 43.265,786 48.886,098
Cambodia 917,182 2.159,070
Indonesia 2.410,298 4.410,948
Lao PDR 1.179,972 2.355,081
Malaysia 9.019,820 14.770,788
Myanmar 529,722 1.950,225
Philippines 2.472,624 3.922,942
Singapore 33.172,237 56.569,967
Thailand 4.944,218 8.747,938
Viet Nam 1.415,731 3.193,064
Average 9.932,759 14.696,612
Average* 2.861,196 5.188,757
* without Brunei Darussalam dan Singapore
sumber: ADB Key Indicators for Asia and the Pacific 2011
785
Table 1 has clearly shown the existence of income disparities between countries in SEA region during the years 2000-2010. However, regarding developing economies especially, SEA region few studies attempted it in their income disparities related empirical analysis. Therefore, the central objective of this paper is to empirically examine and analyze the income disparities in SEA countries region during the years 2000-2010. The countries included in this study are Brunei Darussalam, Singapore, Malaysia, Thailand, Philippines, Indonesia, Lao PDR, Cambodia, Viet Nam, and Burma.
The data used in this study are population and GDP per capita at PPP (Power Purchase Parity) of every country in the region of SEA during the years 2000-2010. This study utilizes the measurement method of Weighted Coefficient Variation or Williamson Index to obtain the income disparity values.
Literature Review
Gama (2008) analyzed regional disparity among regencies in Bali (a province in Indonesia) from 1993 up to 2006. Williamson‟s weighted coefficient of variation is used to measure the regional disparity in Bali. The result indicated that there was an increasing regional disparity among regencies in Bali during 1993-2006.
786 Data and Source
The source of our data, population and GDP per capita at PPP (Purchase Power Parity) for ten ASEAN countries (Brunei Darussalam, Singapore, Malaysia, Thailand, Philipines, Indonesia, Lao PDR, Cambodia, Viet Nam, and Burma) was obtained from Asia Development Bank in Key Indicators for Asia and the Pacifics 2011. The unique feature of this data is that the values of all GDP per capita are denominated in a common set ot prices in a common currency so that real quantity comparisons can be made, both between countries and over time.
Williamson Index
Williamson index formulation as follows :
Vw = weighted coefficient of variation or Williamson Index
ni = total population of i (country)
n = total population of all countries in ASEAN
i
Y = GDP per capita at PPP of i (country)
Y = average of GDP per capita at PPP of all countries in ASEAN
The range of income disparity is around 0 to 1 (0<Vw<1). The closer to 0, the lower
the income disparities between countries become. Conversely, the closer to 1, the higher the income disparities between countries become.
To obtain more detailed results, we performed the calculation in six groups. The first group consists of ten countries defined before. The second group consists of all datas from countries defined before except Brunei Darussalam and Singapore. The third group consists of Cambodia, Lao PDR, Burma, and Viet Nam. The fourth group consists of Indonesia, Philippines, and Thailand. While the fifth group consists of Brunei Darussalam, Singapore, and Malaysia, the sixth group consists of Malaysia and Thailand. These classifications are based on the economic backgrounds of each country particularly the level of GDP per capita at PPP from the early year of observations, the year of 2000. Its aim is to obtain more detailed conditions in income disparities between countries in SEA region.
787
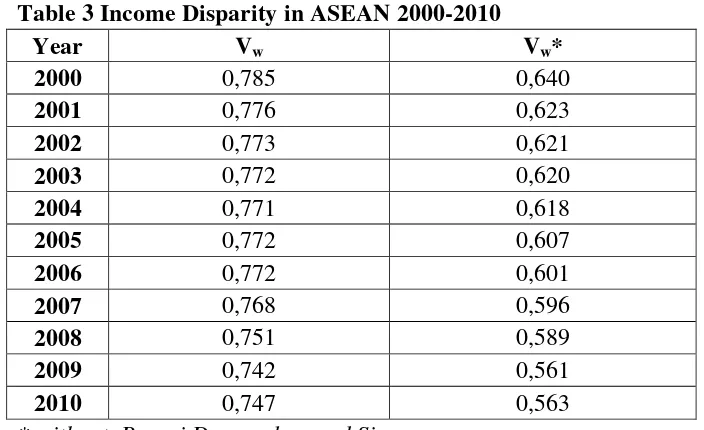
By using the formula of Williamson Index, we obtained the results as listed in Table 3. A higher achievement of Brunei Darussalam and Singapore against other countries in SEA region made the income disparities occured in this region was enormous. If the data of Brunei Darussalam and Singapore were excluded from the calculation, the results obtained would be that the level of income disparities between countries in this region were smaller. The difference between inclusion and exclusion Brunei Darussalam and Singapore in the calculation was tangible at the year 2010 which was equal to 0.216. However, the results of both calculations showed a decrease in the level of disparity from 2000 until 2010.
Figure 1
GDP per capita at PPP in ASEAN 2000-2010
GDP per Capita at PPP in ASEAN
0,000 10.000,000 20.000,000 30.000,000 40.000,000 50.000,000 60.000,000
2000 2001 2002 2003 2004 2005 2006 2007 2008 2009 2010
Year
U
S
D
Brunei Darussalam Cambodia Indonesia Lao PDR Malaysia Burma Philippines Singapore Thailand Viet Nam
source: ADB Key Indicators for Asia and the Pacific 2011
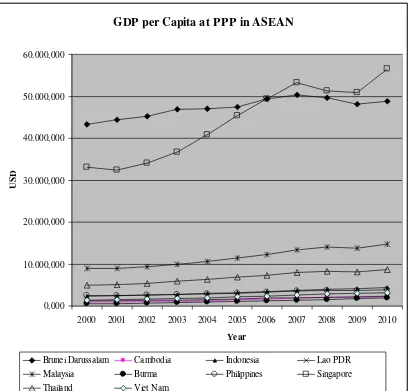
788 Tabel 2: GDP per Capita at PPP 2000-2010
Negara ASEAN 2000 2001 2002 2003 2004 2005 2006 2007 2008 2009 2010 Brunei Darussalam 43265,8 44368 45283,5 46867,6 47079,1 47465,1 49440,9 50381,6 49622,8 48151 48886,1
Singapore 33172,2 32442,5 34102,5 36706,9 40772,9 45374,2 49418,9 53285,5 51312,5 50938,7 56570
Malaysia 9019,82 9028,76 9433,88 9956,29 10686,1 11380 12273,8 13338 14119,6 13800 14770,8
Thailand 4944,22 5116,58 5425,88 5886,3 6382,41 6838,76 7365,79 7938,29 8265,57 8089,8 8747,94
Indonesia 2410,3 2520,48 2641,28 2790,08 2974,29 3206,75 3448,52 3744,33 4002,71 4166,16 4410,95
Philippines 2472,62 2528,89 2599,99 2714,31 2902,47 3061,14 3254,07 3521,87 3679,8 3692,08 3922,94
Viet Nam 1415,73 1528,16 1644,03 1781,63 1951,35 2161,27 2388,59 2650,49 2848,9 2996,14 3193,06
Lao PDR 1179,97 1252,46 1342,28 1398,24 1508,76 1723,01 1903,3 1972,2 2069,3 2171,95 2355,08
Cambodia 917,182 997,01 1069,22 1169,44 1309,32 1511,91 1706,29 1919,14 2064,54 2002,6 2159,07
Burma 529,722 598,312 676,888 783,181 910,742 1062,31 1232,99 1412,04 1579,5 1765,36 1950,23
Average 9932,76 10038,1 10421,9 11005,4 11647,7 12378,5 13243,3 14016,3 13956,5 13777,4 14696,6 Average* 2861,2 2946,33 3104,18 3309,94 3578,18 3868,14 4196,66 4562,04 4828,75 4835,52 5188,76 * without Brunei Darussalam dan Singapura
PROCEEDING The 13th Malaysia Indonesia Conference on Economics, Management and Accounting (MIICEMA) 2012
784 Figure 2
Average of GDP per capita at PPP 2000-2010
Average of GDP per capita at PPP
0,000 2.000,000 4.000,000 6.000,000 8.000,000 10.000,000 12.000,000 14.000,000 16.000,000
2000 2001 2002 2003 2004 2005 2006 2007 2008 2009 2010
Year
U
S
D
All countries in ASEAN Without Brunei Darussalam and Singapore
source: Author’s own calculation using the ADB’s per capita GDP at PPP
Table 3 Income Disparity in ASEAN 2000-2010
Year Vw Vw*
2000 0,785 0,640
2001 0,776 0,623
2002 0,773 0,621
2003 0,772 0,620
2004 0,771 0,618
2005 0,772 0,607
2006 0,772 0,601
2007 0,768 0,596
2008 0,751 0,589
2009 0,742 0,561
2010 0,747 0,563
790
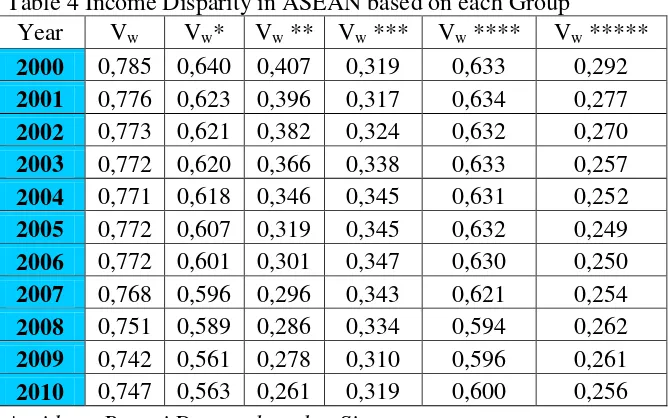
Table 4 Income Disparity in ASEAN based on each Group
Year Vw Vw* Vw ** Vw *** Vw **** Vw *****
2000 0,785 0,640 0,407 0,319 0,633 0,292 2001 0,776 0,623 0,396 0,317 0,634 0,277 2002 0,773 0,621 0,382 0,324 0,632 0,270 2003 0,772 0,620 0,366 0,338 0,633 0,257 2004 0,771 0,618 0,346 0,345 0,631 0,252 2005 0,772 0,607 0,319 0,345 0,632 0,249 2006 0,772 0,601 0,301 0,347 0,630 0,250 2007 0,768 0,596 0,296 0,343 0,621 0,254 2008 0,751 0,589 0,286 0,334 0,594 0,262 2009 0,742 0,561 0,278 0,310 0,596 0,261 2010 0,747 0,563 0,261 0,319 0,600 0,256 * without Brunei Darussalam dan Singapore
** Cambodia, Lao PDR, Burma, dan Viet Nam *** Indonesia, Philipines, and Thailand
**** Brunei Darussalam, Singapore, and Malaysia ***** Malaysia and Thailand
Source: Author’s own calculation using the ADB’s Key Indicators for Asia and the Pacific 2011
First Group
As shown in figure 3, income disparities of ten countries in SEA region are getting smaller from year to year except for the last year of observation. At the last year of observation, the income disparity became higher because many of the countries were not able to recover from the impact of global economic crisis as fast as developed countries in this region as reflected in their GDP per capita at PPP (see Figure 1).
Income disparity levels in this group are relatively high since the values are above 0.5. Such conditions are reasonable considering we include developed countries (Brunei Darussalam and Singapore which have very high GDP per capita at PPP compared to others in this region) into our calculations.
791 Figure 3
Income Disparities of the First Group
0,720
2000 2001 2002 2003 2004 2005 2006 2007 2008 2009 2010
Years of Observations
V
a
lue
Vw
Source: Author’s own calculation using the ADB’s Key Indicators for Asia and the Pacific 2011
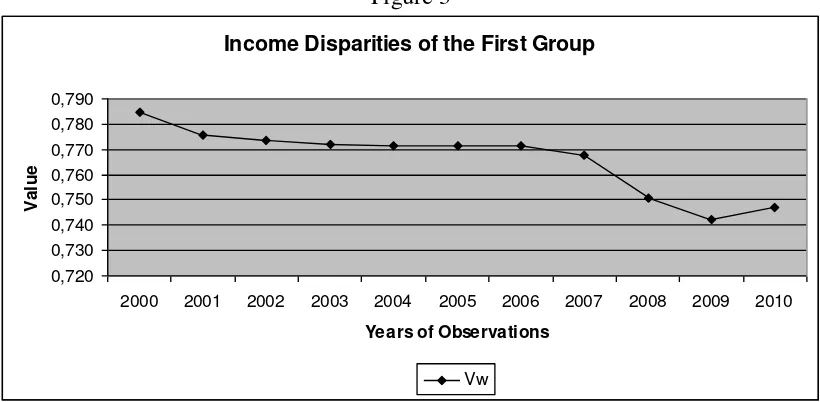
Second Group
Figure 4 shows that income disparity of the second group is still high (which are above 0.5) at the early years of the observation but it gradually decreased untill 2009 and then increased slightly at the last year of observation. Disparities in this group are relatively high because we included Malaysia and Thailand whose GDP per capita are much higher compared to other countries in this group.
Malaysia and Thailand gained even higher (compared to others in this group) GDP per capita than the year before 2010 after their recovery from 2008/2009 global economic crisis. That explain why the gap of GDP per capita at PPP between both countries with others increased in 2010.
Figure 4
Income Disparities of the Second Group
0,520
2000 2001 2002 2003 2004 2005 2006 2007 2008 2009 2010
Years of Observations
V
a
lue
Vw*
792 Figure 5
GDP per capita at PPP of the Second Group
0
2001 2002 2003 2004 2005 2006 2007 2008 2009 2010
Years of Observations
source: ADB Key Indicators for Asia and the Pacific 2011
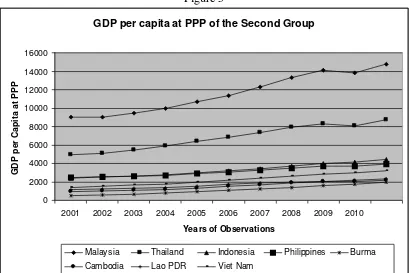
Third Group
The third group consists of countries with the same economic background as shown in figure 7 with Viet Nam as the leading country. Their income disparities are getting smaller during the years of observations (see figure 6). These implied that the development in this group is getting better from time to time as the income disparities continued to decline during this period.
Figure 6
Income Disparities of the Third Group
0,000
2000 2001 2002 2003 2004 2005 2006 2007 2008 2009 2010
Years of Observations
V
a
lue
Vw**
793 Figure 7
GDP per Capita at PPP of the Third Group
0
2000 2001 2002 2003 2004 2005 2006 2007 2008 2009 2010
Years of Observations
Burma Cambodia Lao PDR Viet Nam
source: ADB Key Indicators for Asia and the Pacific 2011 Fourth Group
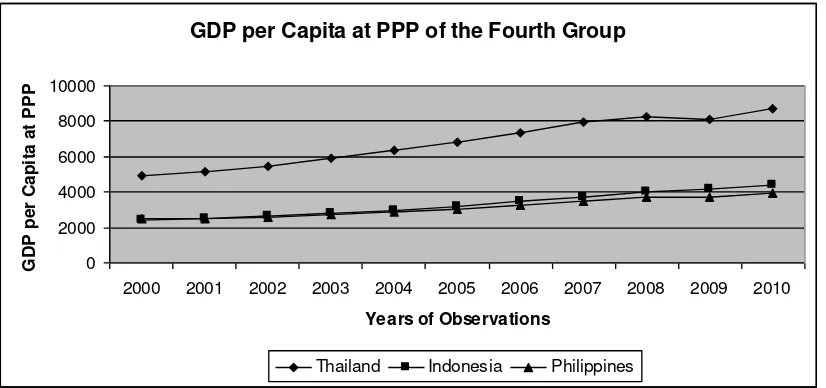
Figure 8 shows the fluctuation of the income disparities among the members of the fourth group, their disparities are relatively low –under 0.5. As seen in figure 9, the GDP per capita at PPP that belong to Thailand are much higher than both Indonesia and Philippines.
The disparity drastically decreased in 2009 because the decrease in GDP of Thailand decreased that year was not as drastic as those of Indonesia and the Philippines. However, its disparity increased again in 2010 because Thailand recovered faster than Indonesia and Philippines. As shown in figure 9, GDP per capita at PPP of Thailand increased bigger than Indonesia and Philippines did.
Figure 8
Income Disparities of the Fourth Group
0,290
2000 2001 2002 2003 2004 2005 2006 2007 2008 2009 2010
Years of Observations
V
a
lue
Vw***
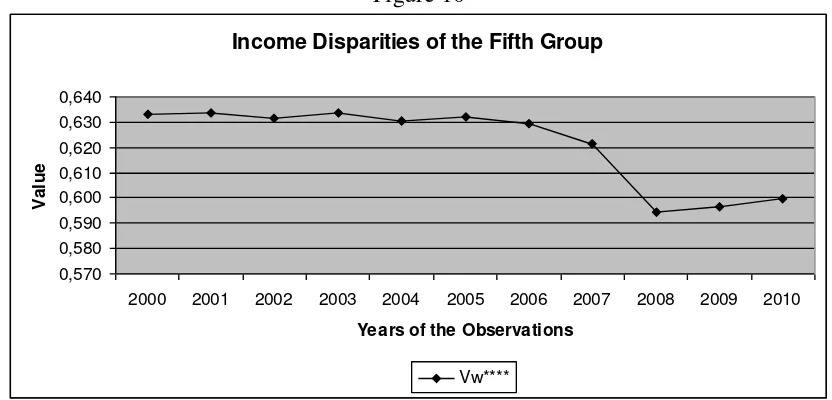
794 Fifth Group
The disparities in this group fluctuated from time to time and their values are relatively high (above 0.5, see figure 10). High value of the disparities are due to the inclusion of Malaysia whose GDP per capita are much lower than the other two countries in this group (see figure 11).
Figure 9
GDP per Capita at PPP of the Fourth Group
0
2000 2001 2002 2003 2004 2005 2006 2007 2008 2009 2010
Years of Observations
source: ADB Key Indicators for Asia and the Pacific 2011
Income disparity in 2008 decreased substantially because the GDP per capita of Brunei Darussalam and Singapore decreased as an effect of the global financial crisis, while Malaysia‟s GDP on the contrary increased. From 2009 to 2010, the disparity increased again as Brunei Darussalam and Singapore recovered from the crises, and were able to once again occupy dominant positions in the region.
Sixth Group
795 Figure 10
Income Disparities of the Fifth Group
0,570
2000 2001 2002 2003 2004 2005 2006 2007 2008 2009 2010
Years of the Observations
V
a
lue
Vw****
Source: Author’s own calculation using the ADB’s Key Indicators for Asia and the Pacific 2011
Figure 11
GDP per Capita at PPP of the Fifth Group
0
2000 2001 2002 2003 2004 2005 2006 2007 2008 2009 2010
Years of Observations
source: ADB Key Indicators for Asia and the Pacific 2011
Conclusion
Generally, disparities in SEA Region during 2000 until 2009 gradually decreased due to the successful development in each country. However due to the unbalanced recoveries (between countries) from the 2008/2009 global economic crisis, the disparity increased in 2010. However, fluctuations of disparities can be seen in each group due to their differences in economic conditions.
796 Figure 13
GDP per Capita at PPP of the Sixth Group
0
2000 2001 2002 2003 2004 2005 2006 2007 2008 2009 2010
Years of Observations
source: ADB Key Indicators for Asia and the Pacific 2011
References
Asian Development Bank. Key Indicator for Asia and the Pacific 2011. Hongkong: ADB, 2011.
Bunyaratvej, Kraiwinee and Eugene D. Hahn (2003) “Convergence and its implications for a common currency in ASEAN” ASEAN Economic Bulletin Vol. 20, No. I, pp 49-59. Economics Bulletin, Vol. 6, No. 13 pp. 1−20.
Lindert, Peter H. and Jeffrey G. Williamson (2003) “Does globalization make the world more unequal?” Globalization in Historical Perspective, 227-275.
Park, D. 2000. Intra-southeast asian income convergence. ASEAN Economic Bulletin, 17(3), 285-292.