Influence of Clay on Time Domain Induced Polarization
YatiniGeoph si s E gi eeri g Departe e t, U iversitas Pe a gu a Nasio al Vetera Yog akarta
SWK (104) North Ring Road Street Condong Catur 55283, Yogyakarta, Indonesia Correspondence: E-mail: [email protected]
A B S T R A C T S A R T I C L E I N F O
The main problem in mineral exploration is how to determine the existence of deposits at subsurface based on resistivity and chargeability parameters. Clay almost exists in rocks. Here, this study was to understand the influence of clay on time domain induced polarization. To clarify the clay parame-ters, field physical modeling was conducted. The results showed physical modeling data of 20-cm diameter spherical target with a total content of 28.3% of iron did not show any significant response. The high content of clays on the medium used in field physical modeling seems to be the main reason for the change in sample. In the case of the subsurface spher-ical model that is near to the soil medium, the presence of clay leads to the medium resistivity value to be identical to the target value. As a consequence, the resistivity response can not be identified clearly. The chargeability between the medium and the target remains small but the chargeability response remains constant.
© 2018 Tim Pengembang Jurnal UPI
Article History:
Received 01 December 2017 Revised 05 January 2018 Accepted 05 February 2018 Available online 09 April 2018
____________________
Keyword: TDIP response, Resistivity, Chargeability, Physical modeling.
1. INTRODUCTION
The induced polarization (IP) method is one of the most widely used methods in geo-physics for base metal exploration since the last 60 years (Loke et al., 2003). This method is an extension of the Geoelectric method by adding the ability parameters to store electric current. Measurement of IP methods can be done in time, frequency, and phase region. The time zone is called Time Domain Induced Polarization (TDIP), whereas in the phase
region it is called SIP (Spectral IP) (Fiandaca et al., 2012). The ability to store current is ex-pressed by chargeability or metal factor. Both are used to indicate the presence of metal minerals beneath the surface.
In its development, this method began to be used in the geotechnical field. The ability to determine rock lithology is derived from this method and is difficult to derive from other geophysical methods (Slater and Lesmes, 2004). IP response is resulted due to under surface polarization. This is created
Indonesian Journal of Science & Technology
from the occurrence of storage in the form of chemical energy. Chemical energy is formed by differences in the movement of inner ions through the structure of the rock (membrane polarization) and the difference between ionic and electronic conductivity when there is a metal mineral (electrode polarization) (Nandiyanto et al., 2016). In general electrode polarization is much greater than the normal IP effect, depending on the presence of metal minerals in rocks (Telford et al., 1990). In a subcutaneous medium that is not known with certainty, it can occur both mechanisms. The IP response is also determined by the conduc-tive mineral surface area, so that the concen-tration of the conductive mineral will be di-rectly proportional to the magnitude of the IP response value (Slater & Lesmes, 2004).,
The effects of clay on the frequency-de-pendent electrical impedance of rocks has not been investigated with the same intensity as have the effects of conductive minerals, such as sulfides. Investigators in the mining geo-physical community who have examined clay effects have been primarily concerned with polarization phenomena. Most notable is the work of (Vacquier et al., 1957; Madden & Marshall 1959) who describe, respectively, TDIP measurements on artifical clay-sand mixtures and a theoretical model for mem-brane (clay) polarization. The laboratory study in order to completely understand the effects of clay doing by (Sill & Klein 1981).
The presence of clay in rocks greatly in-fluences the IP response. (Vanhala & Soininen 1995) measured the effect of clay grain size, electrolyte composition on the sample. The presence of clay interacting with ground wa-ter may induce an induced polarization effect and minimize the resistivity. The research was focused on influence of clays on TDIP re-sponses on artificial samples with 28.3% of Fe-total content by (Yatini 2014). The more clays give impact on decreases in the resistiv-ity value exponentially and increases in the value of chargeability.
Clay is always present in every rock. The presence of porous and impermable proper-ties causes clay if it exposed to water to ab-sorb and expand (Odom, 1984). But, if dry, it becomes hard. In the case of clay usage as a background medium for field-scale physical modeling, the effect of clay on TDIP measure-ment data becomes very dominant. The tar-get sphere with a 28.3% of Fe-total content laid beneath the ground surface did not show a good response. In this paper, we explained how the influence of clay on the results of measurement and inversion Res2Dinv TDIP data in the case of field-scale physical model-ing. The use of soil medium and clay is used as an analysis material.
2. GENERAL CHARACTERISTICS OF CLAY
Clays are one of the oldest ceramic raw materials and are recognized by certain prop-erties. When they are mixed with water, they form a coherent, sticky mass, that is readily mouldable and if dried, it becomes hard, brit-tle, and retains its shape. Clays may take on various forms where they can easily be recog-nized as the sticky, tenacious constituent of soils and can also occur as rocks (which owing to compression). Clays are so hard and com-pacted that penetration and action of water are very slow processes (Worrall, 1968; Kiberu 2001). The commonest impurities in natural clays are quartz and micaceous mate-rial but minor impurities such as hydrated iron oxide, ferrous carbonate, and pyrites also oc-cur.
According to the formation process, min-eral clays from the results of hydrothermal al-terations, such as vermiculite and montmoril-lonite. Results from recrystallization process, Solubilizsed aluminum and silicon oxides from weathering clays recrystallize to form kaolin-ite (Grim, 1968). Weathering of clays to form other types of clay, Montimorrilonite and Ka-olinite. Clay particles measuring less than 2 microns Nevertheless, 2-5 micron sized parti-cles are also still classified as clay partiparti-cles.
3. METHODS
3.1 Location and Litology of the Research Area
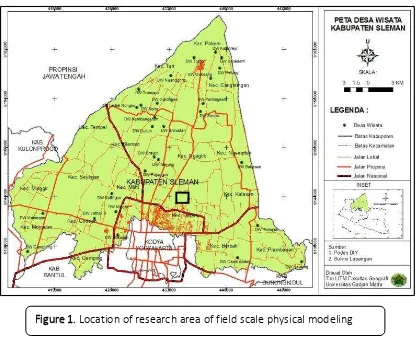
The location of the research area is lo-cated in Krapyak Village, Wedomartani Dis-trict, Sleman, DIY. This area is located on the flank of Mount Merapi in the south, approxi-mately 25 Km from the summit. (Figure 1)
In general, the rocks in Sleman and sur-rounding areas are alluvial products of Merapi. The lithology of the area is as shown in Figure 2. The topsoil has a thickness (22-25) cm. This layer is gray to blackish, the grain size is very smooth and if exposed to sticky rain but in a dry state clot. The layer (1) is domi-nated by clay. Layer (2) is located under Layer (1) with a thickness of 74 cm, brownish red,
fine grain size, loose material and porous. Chemical tests showed that the Fe-total con-tent of this soil layer was 5.5%. The layer boundary (BL) exists between the two with thickness (5-7) cm and is red. Layer (3) is lo-cated at the bottom after a depth of 104 cm. This layer of sand with a gray-brown to black-ish color, grain size rather rough, porous and dry.
3.2 Induced Polarization and The Parameters.
In simple terms, the IP response reflects the degree to which the subsurface is able to store electrical charge, analogous to a capacitor (Sumner, 1978). This polarization occurs at the interface between (1) a metal and a fluid (electrode polarization), and (2) a non-metal (e.g. silica or clay) and a fluid (called membrane polarization).
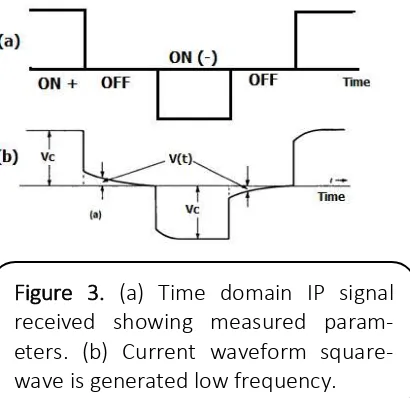
A low frequency current or direct current (DC) is injected at two current electrodes, while the potential difference is measured on the potential electrode. The square wave generated current electrodes and the signal received at the potential electrodes Figure 3. When the current is disconnected, potential will immediately zero. However, in IP meas-urement, the potential will be zero for several time interval, this is called potential decay. Potential decay is due to the polarization in the subsurface medium.
At the time domain, there is most commond measurement is the chargeability defined as (Ward, 1990) :
� =�1 ∫ ��� � � ��
Where Vp(t) is residual voltage integrates
over time windoow defined between times t1
and t2after termination of an applied current. Vo is the measured voltage at some time
during application of the current. The unit of chargeability are quoted as millivolt per volt (mV/V) and is the most commonly used quantity in time domain IP measurement. When Vp(t) and Vo, have the same units, the
chargeability m is in millisecond (ms).
Polarization results from a redistribution of ions along such interfaces following application of an electric current. Upon current termination, ions relax to the equilibrium condition. This diffusion-controlled relaxation is equivalent to a residual current flow (as observed during discharge of a capacitor) and is the source of the subsurface IP response. The IP method measures the magnitude of this polarization. In contrast, the resistivity method measures the magnitude of conduction provided by both electrolytic and surface conduction (enhanced in the presence of clay). Electrode Figure 2. The lithology of the research
area, which consists of 3 layers of clay, soil and sand
polarization generally produces a larger IP response than membrane polarization (Slater and Lesmes, 2000).
3.3 Field Scale Physical Modeling
The field physics model, created on a sized hole (240 x 120 x 60 cm) filled with Layer (2) as host. Layer (2) is taken from a place 90 cm away from the modeling hole. This soil is inserted into the modeling hole sieved to avoid any large material entering. This is done to get a relatively uniform host. Scaling is done evenly, then compressed manually us-ing a metal plate sized (25 x 40 cm). This is done continuously until the ground of Layer (2) fills the modeling hole. The medium is si-lenced for 6 to 7 weeks, to obtain a good soil structure and density. The effect of weather is minimized by making a tent from a plastic sheeting that covers the entire modeling hole. The trenching around the modeling hole is also made so that the rain does not seep di-rectly on the host medium.
The true chargeability and resistivity val-ues of the host are measured using SRB. The results of the measurement of the value resis-tivity and the chargeability of the Layers (2) are (107.5 ± 2.8) Ohm-m and (0.9 ± 0.1) ms. Measurement of value resistivity to changes in the water content of Layer (2) was also car-ried out in this study. As a result, the greater the water content the value of the resistivity drops exponentially. These results are used to analyze the effect of water on the field physi-cal modeling hosts.
Target sphere diameter 20 cm and Layer (2) as host. The sphere is made of a mixture of cement, quartz sand and iron used as a tar-get measurement of TDIP. Fe-total on tartar-get is 28.3%. The target is planted in the center of the area (point 0) that has been prepared with the target peak as deep as 2 cm from the
ground. Measurements use Dipole-dipole and Wenner configurations with 10 cm spacing.
3.4 Measurement Techniques on Field Physi-cal Modeling
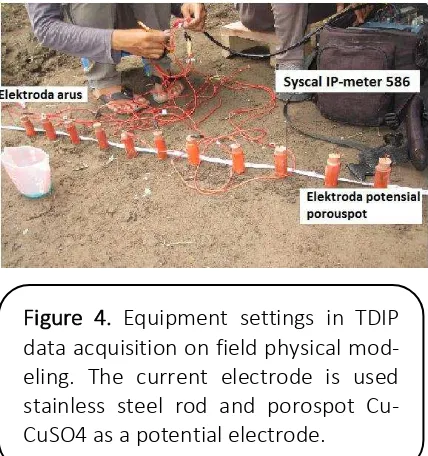
Equipment includes cables, electrodes, porospots, and targets need to be prepared in order to obtain good field physics model data. The current electrode uses a 3-mm diameter stainless steel rod with a pointed tip, while for a potential electrode using a porospot elec-trode. The use of Cu-CuSO4 porouspot elec-trodes is commonly used, since non-polaria-ble electrodes produce excellent data (Vanhala, 1995; Apparao, 1997; Yatini, 2013). Porospot made of cylindrical pottery with a height of 8 cm and an inner diameter of 0.5 cm. The outside of the cylinder in the paint and the bottom is left, to function as a pore. Spiral copper wire and CuSO4 (Cupri Sulphate) solution are incorporated therein, functioning as porospot electrodes Cu-CuSO4. The meas-uring tool used is IP-meter Syscal Junior Type-586 IRIS. The arrangement and illustration of measurement techniques on the field physi-cal model is shown in Figure 4.
5. RESULTS AND DISCUSSION
The IP method is not to determine the type of rock, but this method is used to know the amount of conductive minerals found in the rock (Apparao, 1997). Conductive miner-als in rocks can be either metal (base metal) minerals, or clay. The polarized process of minerals present in a medium is the source of IP response. In general electrode polarization is much greater than the normal IP effect, de-pending on the presence of metal minerals in rocks (Telford, et al., 1990). In a subcutaneous medium that is not known with certainty, it can occur both mechanisms. In a medium dominated by metal minerals the electrode polarization mechanism will dominate the IP response. The polarization of strong elec-trodes is caused by the presence of metal mineral deposits which are electrical conduc-tors in rocks. These minerals include virtually all sulfides, oxides such as magnetite, illmen-ite, pyrolusillmen-ite, casiterit and graphillmen-ite, pyrillmen-ite, pyrhotite, hematite and pyrolusite (Apparao, 1997). While in rocks that contain lots of clay, the membrane polarization mechanism will dominate the measurement of IP response.
The TDIP response in rock depends on many factors, other than metal mineral con-tent, grain size and porosity are very domi-nant. The greater the water content the resis-tivity decreases and the greater the chargea-bility. Chargeability is more likely due to the clay content of the soil undergoing swelling due to increased water (Kiberu, 2003).
The presence of clay greatly influences the value of medium resistivity and chargea-bility. Research on rock samples showed that resistivity value was smaller exponentially and chargeability increased (Yatini, 2016). Some-times the value of chargeability medium con-taining clay shows a negative value. Resistivity
and chargeability results using Soil Resitivity
Bo “RB o ver dr soil ρ = 4,6 ±
Ohm-m and m = (-58,0 ± 0.8) ms. This is due to loose soil dry (loose) so that porosity large enough rho high value. Chargeability of a large negative value caused because the con-tent of clay Al2O3 on a large enough land (Yatini, 2016).
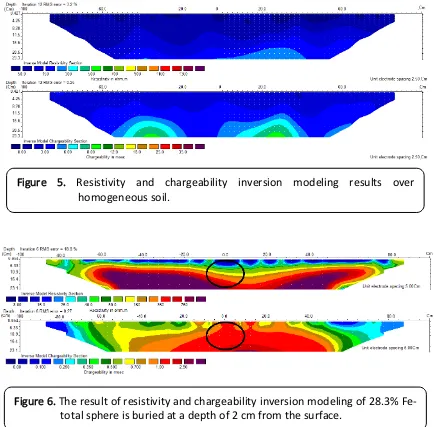
Layer (2) eligibility as a homogeneous me-dium has been tested in two ways. First, the measurement of resistivity and chargeability value with SRB. The soil samples were taken at four points representing the modeling. The results showed a uniform value for resistivity and chargeability, ie (107.5 ± 2.8) Ohm-m and (0.9 ± 0.1) ms. Second, measurements with-out a target. The result of homogeneous soil with Dipole-dipole configuration is shown in Figures 5 and 6.
The inversion result of a homogeneous me-dium with a Dipole-dipole configuration shows the distribution of uniform resistivity values below 50-150 Ohm-m. This value is in accordance with the results of the measure-ments of soil samples taken in the research area. The result of soil sample measuring is 1 ms. The distribution of below-surface charge-ability of 0-4 ms and a sufficiently high value of 5-8 ms exist at a depth of more than 13 cm. The striking difference is due to the dominant clay content in this medium. The soil in Layer (2) is used as a fine-grained homogeneous medium. Based on the size of the grain, the material with dimension of 2-5 micron is still classified as clay (Das, 1995). Based on this, the results of TDIP measurements on physical modeling is strongly influenced by the amount of clay in the medium.
16.4 Ohm-m, whereas the host value resistiv-ity is 107.5 Ohm-m. The response of measure-ment result to an inappropriate field physical modeling may be due to several factors: The
use of a space longer than the target width (10-cm spacing and 5-cm width), thus causing the inversion modeling results with Res2DInv not sensitive enough to "see" the target.
The presence of clay affects which causes the smaller resistivity and enlarges the chargeability. In the resistivity parameter the resistivity response is not clearly illustrated by the inversion incision. This is due to the resis-tivity contrast between the target sphere of the Fe-total content of 28.3% and the me-dium becomes very small. As a result there is no significant resistivity response on the sur-face. The presence of clay also increases the value of chargeability. The result of the
inversion of chargeability parameters remains consistent. This is because despite the con-trast of chargeability between the target and the small medium, it will still measure good response on the surface. All of this is seen from the inversion incision for incisions of chargebilitas that consistently appear and show the existence of the target at subsurface Figure 6. This is the advantage of IP methods in distinguishing metal minerals at subsur-face.
Figure 5. Resistivity and chargeability inversion modeling results over homogeneous soil.
Medium host porous susceptible to changes in water content, which is caused by rain water. The medium will be more conduc-tive, so the resistivity drops exponentially. This decreament is in addition to the pres-ence of conductive fluids, which is caused also by the presence of clay dissolved in water. that water saturation decreases the resistivity value. This is due to resistivity of the host to be near the resistivity value of target. As a consequence, the contrast between the two points is not large enough. If the condition has reached, the measured apparent resistivity on the surface is the same with the host me-dium resistivity. Because the modeling is done in the field, it is difficult to control. The only work that can be done is to minimize the ef-fect of rainwater by covering all parts of the model with tarpaulins. But, this happens when rain water seeps on the host through the boundary wall. Conditions at the time of data collection often occurs rain at night and bright in the day. The influence of tempera-ture is also significant enough to give impact the value of resistivity and chargeability on the surface of physical field model. Tempera-ture is getting bigger then resistivity becomes smaller. Daytime temperature range 31-32oC.
Field physical modeling studies show that resistivity are influenced by iron sand con-tent. But, some other variables also must be considered. The resistivity value of the rock or
medium determined by many factors. All the physical properties of rock or medium affect the value of resistivity, in which Ward (1990) expressed as formation factor, grain distribu-tion and size, cementadistribu-tion, density, clay min-eral content, iron sand content, temperature, and water saturation.
4. CONCLUSION
The high content of clays on the medium used in field physical modeling greatly affects the results. The presence of clay causes the resistivity value to be lower and the chargea-bility to be higher. In the case of the subsur-face sphere model around the soil medium, the presence of clay permitted that the me-dium resistivity value to have value nearly close to the target, causing the contrast of re-sistivity to be very small and the response to be unidentified. The contrast of chargeability between the medium and the target remains small, the chargeability response remains constant.
5. ACKNOWLEDGEMENTS
The authors wish to thank Ari and Syaiful for assisting the data aquisition in the field. Thanks also to Imam Suyanto for the discus-sion of physical modeling design and Meymey for revise the manuscript.
6. AUTHOR“’ NOTE
The author(s) declare(s) that there is no conflict of interest regarding the publication of this article. Authors confirmed that the data and the paper are free of plagiarism.
7. REFERENCES
Apparao, A. (1997). Development in Geoelectrical Methods. A.A. Balkema Publs, Old Post Road, Brookfield VT 05036. USA.
Grim, R. E. (1968). Clay mineralogy. McGraw-Hill, New York.
Kiberu, J. (2002). Induced polarization and Resistivity measurements on a suite of near surface soil samples and their empirical relationship to selected measured engineering
parameters, Master Thesis, International Institute For Geo-Information Science and
Earth Observation Enschede, The Netherlands.
Loke, M. H., Acworth, I., and Dahlin, T. (2003). A comparison of smooth and blocky inversion methods in 2D electrical imaging surveys. Exploration Geophysics, 34(3), 182-187.
Nandiyanto, A. B. D., Sofiani, D., Permatasari, N., Sucahya, T. N., Wiryani, A. S., Purnamasari, A., Rusli, A., & Prima, E. C. (2016). Photodecomposition profile of organic material during the partial solar eclipse of 9 march 2016 and its correlation with organic material con-centration and photocatalyst amount. Indonesian Journal of Science and Technology, 1(2), 132-155.
Odom, I. E. (1984). Smectite clay minerals: properties and uses. Philosophycal Transaction
Royal Society of London A, 311(1517), 391-409.
Paolo, B. (2013). Penyelidikan Pengaruh Faktor Formasi dan Sifat Kimia Air Terhadap Nilai
Tahanan Jenis Dengan Menggunakan Metode Soil Resistivity Box (Bachelor thesis:
Institut Teknologi Bandung).
Slater, L. D., Lesmes, D. and Sanberg, S. K. (2000). Induced Polarization Methods, Proceeding of the Symposium on the Application of Geophysics to Engineeing and Enviromental
Problems, 2000, 935-944.
Telford, W. M., Geldart, L. P., and Sherff, R. E. (1990). Applied Geophysics, Second Edition, Cambridge Univ.Press, London.
Vacquier, V., Holmes, C. R., Kintzinger, P. R., and Lavergne, K. (1957). Prospecting For Groundwater by Induced Electrical Polarization. Geophysics. 22, 660-687.
Vanhala, H. and Soininen, H. (1995). Laboratory Technigue for Measurement of Spectral IP Response of Soil Samples, Geophysical Prospecting, 43, 454-472.
Ward, S. H. (1990). Resistivity and Induced Polarization Methods, SEG Investigation on
Geophysics #5 Geotecnical and Enviromental Geophysics, I, 147.
Yatini and Laesanpura, A. (2013). Influence of Potential’s Electrode Selection on Physical Modeling of Time Domain Induced Polarization (TDIP), Case Studies of Homogeneous Isotrop Medium, AIP Conference Proceedings, 1554, 245.
Yatini, Santoso, D., Laesanpura, A., and Sulistijo, B. (2014). Studi Pemodelan Respon Polarisasi Terinduksi Dalam Kawasan Waktu (TDIP) Terhadap Kandungan Mineral Logam, Sebuah Hasil Awal, Indonesian Jounal Applied Physics, 4(2), 162-170.
DOI: http://dx.doi.org/10.17509/ijost.v3i1.10794
p- ISSN 2528-1410 e- ISSN 2527-8045
Yatini. (2016). Modeling studies on Time Domain Induced Polarization (TDIP) response of