Prediction of Missing Streamflow Data using Principle of
Information Entropy
Santosa, B.
1, Legono, D.
2, and Suharyanto
3Abstract: Incomplete (missing) of streamflow data often occurs. This can be caused by a not continous data recording or poor storage. In this study, missing consecutive streamflow data are predicted using the principle of information entropy. Predictions are performed using the complete monthly streamflow information from the nearby river. Data on average monthly streamflow used as a simulation sample are taken from observation stations Katulampa, Batubeulah, and Genteng, which are the Ciliwung Cisadane river areas upstream. The simulated prediction of missing streamflow data in 2002 and 2003 at Katulampa Station are based on information from Genteng Station, and Batubeulah Station. The mean absolute error (MAE) average obtained was 0,20 and 0,21 in 2002 and the MAE average in 2003 was 0,12 and 0,16. Based on the value of the error and pattern of filled gaps, this method has the potential to be developed further.
Keywords: Prediction, missing data, streamflow, entropy.
Introduction
Water resources planners and managers use histo-rical monthly average streamflows data for a variety of purposes. The data set are often not complete, missing streamflows data may exist due to various reasons such as not continuous data recording or lost in storage. In relation to the development of analysis techniques, there should be a better method so that the uncertainty concerning with frequency of field experience could be minimized, to be accurate in predicting calculation.
The purpose of this paper is to develop and to test a method to fill monthly average missing streamflows data. Predictions to fill the missing streamflows data use existing data and information data from the nearest river basins that have a complete data recording history and proximity hydrological. Infor-mation from a nearby river basin is required, because the hydrologic pattern of adjacent river basin have similarities. This information will be utilized to fill the missing streamflow data in a river basin.
1 Department of Civil Engineering, Gunadarma University, Depok,
16424, INDONESIA. Email: [email protected].
2 Hydraulics Laboratory, Department of Civil and Environmental
Engineering, Gadjah Mada University, Grafika 2, Yogyakarta 55281, INDONESIA. Email: [email protected]
3 Department of Civil Engineering, Diponegoro University, Jl. Prof.
Soedarto, SH., Tembalang, Semarang, 50275, INDONESIA. Email: [email protected]
Note: Discussion is expected before June, 1st 2014, and will be published in the “Civil Engineering Dimension” volume 16, number 2, September 2014.
Received 21 November 2012; revised 04 June 2013; accepted 08 May 2014.
The approach used to predict a missing streamflows data is the principle of information entropy, which is based on the probability of distribution of each river flow events within a region [
1
].Unavailability of data has led the theory of entropy to be attractive and widely used in models of decision making in environmental and water resources [1]. Kusmulyono and Goulter [2] used of the principles of entropy as a method of analysis, that is based on the interpretation of entropy principle and characteris-tics, that can be used to analyze events that have a probability.
Entropy method has been developed to estimate the random variable when the data are series of inde-pendent observations of the variable. This method is interesting, because it meets two basic requirements used to analyze probability based on the principle of invariant systems and the principle of monotonous data. Minimum entropy method has been applied to the analysis of the flood, and then compared with the method of moments and maximum likehood [5]. The entropy theory is used to develop a univariate model for forecasting of long term streamflow [6]. The maximum entropy method is also widely applied and the maximum entropy distribution proved suitable for a variety of flooding data [7]. An entropy-based approach has been developed for estimation of natural recharge in Kodaganar River basin, Tamil Nadu, Southern India [8].
The frequency distribution is usually assumed in the analysis of frequency. The parameters of the distribution are estimated using the observed data changes. Completeness of the distribution is then used to estimate the amount of flow with different frequencies. Maximum entropy is a probability dis-tribution which is defined as the minimum conditio-nal probability distribution obtained by maximizing the entropy subject to constraints of the information given limits [7]. Apart from the interesting features of the distribution of maximum entropy, yet com-monly used in practice, the main reason for not using the maximum entropy distribution in the general form is that the parameter estimation problem associated with the maximum entropy distribution is not easy. Recently this problem has been solved and the algorithms have been developed to estimate the parameters of the distribution of maximum entropy [7].
Study Area and Data
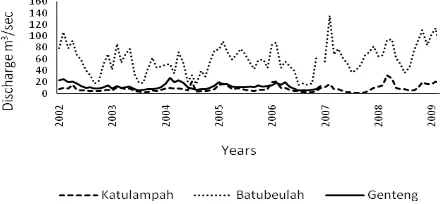
This research studies area are Ciliwung and Cisa-dane rivers with observational data obtained from the Department of Water Resources, Bandung, Indo-nesia. The data used in this study are drawn from the monthly average streamflows from observation stations Katulampa, Batubeulah and Genteng, at the Ciliwung and Cisadane river upstream. The mon-thly average flow profiles of the three observation stations can be seen in Figure 1.
Figure 1. Monthly Average Streamflows Data from Batubeulah, Katulampa, and Genteng Stations.
Method
Second Law of Thermodynamics states that under normal conditions, all systems without disruption tend to be disorganized, dispersed, and corrupted over time. Second law of thermodynamics is a way of defining this natural process with physics equations and calculations. This law is also known as entropy [1]. Shannon [9] developed the entropy theory for expression of information or uncertainty. To under-stand the informational aspect of entropy, we state system becomes more irregular, scattered, and unplanned. Law of entropy states that the whole universe moves towards a more disordered, unplan-ned, and disorganized. Shannon [9] illustrates that the entropy is the amount of uncertainty in proba-bility distributions. Thus, the concept of entropy can be used as a measure of uncertainty and indirectly as a measure of the probabilistic information. According to Shannon [9], this information is achieved only when there is uncertainty about an event. This uncertainty can be assumed to indicate the presence of alternative outcomes of events and to select them. Alternative with a high probability of occurrence showed little information available and its opposite. Thus, the likelihood of occurrence of a particular alternative is a measure of uncertainty, in this case Shannon called the entropy.
Information is a measure of uncertainty or entropy in a situation. The greater the uncertainty, the gre-ater the available information. If there is a circum-stance, there is no information at all. Theory of information entropy is a formula in use and at follow as the basis of measurement. The probability of n possible events 1, 2, 3, ..., n is p1, p2, ..., pn, and
uncer-tainties may be defined as H (p1, p2, p3, .., pn) [10]. The
basic equation of entropy is shown in Equation 1.
Where H is a measure of information or the size of the uncertainty, the probability pi that may be on
events i. H will have a maximum value (ln n) if all the events is uncertain and pi = 1/n. H will have a
Principle of Maximum Entropy (POME)
Since the development of the entropy theory by Shannon in the late 1940s and of the principle of maximum entropy (POME) by Jaynes [11] in the late 1950s there has been a proliferation of applica-tions of entropy in a wide spectrum of areas, include-ing hydrological and environmental sciences. Maxi-mum entropy is also called the Principle of Maximum Entropy (POME). Characteristics of the maximum entropy function in Equation 2 are uniform probability distribution that will produce the maximum entropy value for the occurrence of the specified limits. Conversely the maximum entropy function Equation 3 has a limitation that the number of probabilities of all events must be equal to one, to ensure the probability distribution is the probability uniformly on every event. The principle of entropy can be used to obtain the probability distribution by maximizing the objective function by setting limits for specific information events.
Maximum
Principle of Minimum Entropy (MDI)
Minimum entropy is also called the Minimum Discrimination Information (MDI). The minimum entropy principle was first introduced by Kullback and Leibler [10], the measurement approach per-formed with two probability distributions, namely the information to determine the difference between probability distributions P and Q. Equation present-ed by Kullback and Leibler [10] to measure the entropy value is as in Equation 5 as the following:
probability distribution P and qi probability of event i
of the probability distribution of Q
Predicting Method
Prediction of missing streamflows data on the obser-ved location are performed using the principles of information entropy of the maximum and minimum entropy. Between maximum entropy and entropy will have a minimum value of entropy with the same probability distribution for events distributed uni-formly. For example in the case of throwing the dice.
Real probability of throwing the dice is pi, whereas qi
is the theoretical probability which is 1/6. Optimiza-tion of the maximum entropy (EquaOptimiza-tion 2) will yield an equal value to the optimization of minimum entropy (Equation 5) with the information value of qi
= 1/6. Figure 2 and Figure 3 are probability distri-bution results obtained from optimization of the maximum and minimum entropy with the con-straint (Equation 3) and the average value (Equation 4) of 3.5 and 4.5 respectively, while Figure 4 is ob-tained by adding the standard limits deviation of 1,898 in order to get a normal probability distribu-tion.
The minimum entropy principle with the example of throwing dice can be applied in the selection of probability distributions for hydrological parameters, especially on the observation history of discharge data on the location of the observation of a river to provide information on other locations. The principle of maximum entropy distribution factor allows to incorporate probabilities qi, which is the initial
infor-mation or (prior probability), to improve the final probability distribution pi (posterior probability) as a
basis prediction.
Figures 5 and 6 are illustrations of three adjacent river basins, where river basin data B has a vacancy that occurs in a certain time, while A and C is a river basin with complete data. Predicted loss of data in B can be done with the help of information from the river basin data A and C with the same period events, with consideration of the similarity of the flow pattern because of the proximity factor hydro-logy and climatohydro-logy.
Figure 2. Throwing Dice Probability Distribution with an Average Set of Incidence = 3.5
Figure 3. Throwing Dice Probability Distribution with an Average Set of Incidence = 4.5
evens i
Figure 4. The Probability Distribution of 12 Events with an Average Set of Events 6.5 and Standard Deviation 1.898
Figure 5. Prediction River Basin B used Information from the Data River Basins A and C.
Figure 6. Illustration River Basin with Complete and Missing Data
While other information is needed in the prediction process including the amount of flow probability relationship information from both river basins namely, the joint probability between the river basin in the prediction (B) or river basin that provides information (A and C), in the same period for the other events. The information is also important to the average and deviation of the events in the long and the other time.
Results and Discussion
First simulation to predict the monthly average missing streamflows data on Katulampa station, which is located in the river upstream Ciliwung. The predictions were made using a monthly average streamflow data, with a scenario eliminating the twelve month data in 2002. Predictions of missing stramflows data, were based on monthly average streamflow data information on the nearest station which is Genteng.
Prediction is basically done by utilizing the existing probability to generate a new probability in the year in which the predictions is performed. Prediction in this case is to generate data on flow rates at Katulampa station in 2002, then it must be known probability for flow in 2002. The probability of flow at Katulampa in 2002 can be generated by utilizing the nearest station flow data at Genteng in 2002, i.e. by finding the joint probability between the flow at
Katulampa and Genteng station in 2002. This can be
performed by using Equation 5 with its limitations (Equation 3 and 4), and with the help of the joint probability of information between the flow at Katu-lampa and Genteng stations from other years (2003-2006) and then joint probability between Katulampa and Genteng can be produced for the year 2002. Joint probability between Katulampa and Genteng in 2002 was a condition that must exist to generate predictions of Katulampa flow in 2002. Other infor-mation required in this prediction is the average flow and the deviation from the station Katulampa in 2003-2006. Predictions are also performed to flow at station Katulampa 2003, using information from the Batubeulah and Genteng stations. Prediction methods and processes are the same as when predicting the flow at Katulampa of 2002.
Prediction is done using the minimum entropy (Equation 5), where pi is the probability that will be
generated as the basis in making predictions, whereas qi is the initial information obtained from
the joint probability of the average flow events between Katulampa and Genteng or Katulampa and Batubeulah (Equation 2). Initial information from the two observation stations function to improve the joint probability pi when performing predictions.
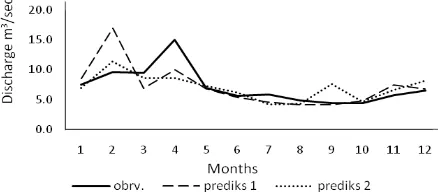
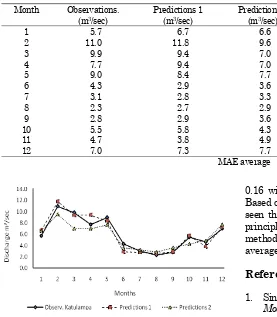
Prediction of flow data on Katulampa station in 2002, based on information from the Batubeulah station (prediction 1) and information from the Genteng station (prediction 2), can be seen in Table 1 and Figure 7. The mean absolute errors (MAE) ave-rage that occurred are 0.20 and 0.21. Whereas Prediction of flow data on Katulampa station in 2003, based on information from the Batubeulah station (prediction 1) and information from the Gen-teng station (prediction 2), can be seen in Table 2 and Figure 8. The mean absolute errors (MAE) average that occurred are 0.12 and 0.16.
Figure 7. Prediction of Missing Streamflows Data in 2002 at Katulampa Station with Information Based from the Batubeulah and Genteng Station.
evens i
Informations..
Informations.
River basin A
River basin B
River basin C
Missing data
Figure 8. Prediction of Missing Streamflows Data in 2003 at Katulampa Station with Information Based from the Batubeulah and Genteng Station
Conclusion
Prediction of missing streamflows data at Katu-lampa Station 2002 produced a monthly average errors of 0.20 with the data information from Batubeulah station and 0.21 with data information from Genteng Station, whereas predicttion of missing streamflows data at Katulampa Station 2003 produced a monthly average errors of 0.12 with the data information from Batubeulah Station and
0.16 with data information from Genteng Station. Based on the performance of the prediction, it can be seen that the method based on information entropy principles have the potential to be developed as the methods to be used to predict the missing monthly average discharge.
References
1. Singh, V.P., The Entropy Theory as a Tool for Modelling and Decision Making in Environ-mental and Water Resources, Department of Civil and Environmental Engineering, Louisi-ana State University, Baton Rouge, LA 70808-6405, USA, 1999.
2. Kusmulyono, A. and Goulter I., Entropy Principles in the Prediction of Water Quality Values at Dis-continued Monitoring Stations, Stochastic Hydro-logy and Hydraulics, 8, 1994, pp. 301-317.
3. Singh, V.P. and Rajagopal, A.K., Some Recent Advances in the Application of the Principle of
Maximum Entropy (Pome) in Hydrology, Water
for the Future: Hydrology in Perspective (Procee-dings of the Rome Symposium) IAHS Publ. No. 164., 1987, pp 353-364.
Table 1. Prediction of Missing Streamflows Data in 2002 at Katulampa Station Month Observations.
(m3/sec)
Predictions 1 (m3/sec)
Predictions 2 (m3/sec)
MAE Predictions 1
MAE Predictions 2
1 7.5 8.6 7.01 0.14 0.07
2 9.6 16.9 11.42 0.75 0.18
3 9.5 6.9 8.64 0.28 0.09
4 15.0 10.0 8.61 0.34 0.43
5 7.0 6.8 7.32 0.03 0.05
6 5.7 5.4 6.24 0.05 0.10
7 5.9 4.5 4.21 0.22 0.28
8 4.9 4.1 4.27 0.15 0.12
9 4.4 4.1 7.66 0.07 0.72
10 4.5 4.8 4.63 0.08 0.04
11 5.7 7.4 6.69 0.30 0.17
12 6.5 6.8 8.16 0.03 0.25
MAE average 0.20 0.21
Table 2. Prediction of Missing Streamflows Data in 2003 at Katulampa Station Month Observations.
(m3/sec)
Predictions 1 (m3/sec)
Predictions 2 (m3/sec)
MAE Predictions 1
MAE Predictions 2
1 5.7 6.7 6.6 0.18 0.15
2 11.0 11.8 9.6 0.08 0.13
3 9.9 9.4 7.0 0.05 0.29
4 7.7 9.4 7.0 0.22 0.09
5 9.0 8.4 7.7 0.07 0.15
6 4.3 2.9 3.6 0.33 0.16
7 3.1 2.8 3.3 0.07 0.07
8 2.3 2.7 2.9 0.14 0.22
9 2.8 2.9 3.6 0.04 0.29
10 5.5 5.8 4.3 0.05 0.22
11 4.7 3.8 4.9 0.17 0.05
12 7.0 7.3 7.7 0.03 0.10
4. Harmancioglu, N. and Baran, T., Effect of Recharge System on Hydrologycal Information Transfer along River, New Directions for Surface Water Modeling, Proceedings of the Baltimore Sympo-sium, IAHS Publ. no 181, May 1989, pp 224-233.
5. Lind, N.C., Hong, H.P., and Solana, V., A Cross
Entropy Method for Flood Frequency Analysis,
Stochastic Hydrology and Hydraulics, 3, 2005, pp. 191-202.
6. Krstanovic P.F. and Singh V.P., An Entropy Based
Method for Flood Forecasting, New Directions for Surface Water Modeling, Proceedings of the Baltimore Symposium, IAHS Publ. no. 181, May 1989, pp. 105-113.
7. Rao, R.A. and Hsieh, C.H., Maximum Entropy
Probability Distributions for Flood Frequency Analysis, Civil Engineering and Environmental Systems, 4(2) , 1987, pp. 67-76.
8. Mondal, N.C. and Singh, V.P., Entropy-Based
Approach for Estimation of Natural Recharge in Kodaganar River Basin, Tamil Nadu, India,
Current Science, 99(11), 2010, pp. 1560-1569.
9. Shannon, C.E., A Mathematical Theory of
Com-munication, Bell System Technical Journal,
1948, Part I July, pp. 379-423, Part II, Oct., pp. 623-656.
10. Kullback, S. and Leibler, R.A, On Information
and Sufficiency, The Annal of Mathematical
Statistis, 22(1), 1951, pp. 79-86.
11. Jaynes, E.T., Information Theory and Statistical
Mechanic II, The Physical Review, Departement