Volume 25, Number 2, 2010, 239 – 250
FACTORS AFFECTING FOOD SECURITY IN RURAL AREAS IN
YOGYAKARTA PROVINCE
1Y. Sri Susilo
Universitas Atma Jaya ([email protected])
ABSTRACT
The purpose of this research is to identify and analyze the factors influencing the food security of rural society in the Province of Daerah Istimewa Yogyakarta (DIY). The location included several sub districts in the Regency of Sleman, Bantul, Kulon Progo, and Gunungkidul. Data utilized in this research were primary and secondary data. Primary data were compiled by survey and interviews. Secondary data were compiled from various publication sources. Data analyzed with multinomial logit regression model.
Factors influencing the food security of rural society in the Province of Daerah Istimewa Yogyakarta are based on three basic groups that are economy (income), socio-culture (gender, kind of food, way of fertilization, technique of cultivation and knowledge of ecology) and ecology (land capability, land suitability, irrigation) ceteris paribus. The three factors cannot be separated in the equilibrium of eco-economy, eco-culture and ecology models.
Keywords: food security, rural society, multinomial logit, DIY.
INTRODUCTION1
Food security does not only cover the availability of food, but also covers the ability to buy food. It also means that there is no dependency on food to other parties. In this context, peasants have strategic roles in food security; because they function as the providers of food and at the same time they are also the biggest consumers of it. The majority of them still live in poverty and their purchasing power are still low. In addition, the quality of food is also one of the important factors in to be considered.
1 Part of the research was funded by basic research
intensive program focusing on food security, Ministry of Research and Technology, the Republic of Indonesia 2008 fiscal year. The researcher would like to thank the
blind reviewer who gave significant suggestions. The content of the article is the responsibility of the researcher.
Thus, peasants need to have the ability to produce food as well as to have sufficient income to fulfill their food need. On the other hand, they are expected to preserve the environment. Often, human being destroys ecosystem in their efforts to fulfil their needs Because of poverty, land is exploited conti-nuously, inorganic fertilization is continuously done to boost productivity, and as a result the soil becomes arid and famine emerges.
Journal of Indonesian Economy and Business May 240
regencies failed to make it. Despite the fact that the four regencies belong to rural areas, the soil in Kulon Progo and Gunung Kidul are infertile compared to that in Bantul and Sleman.
Previous studies have been done by other researchers. Darwanto (2005) reveals that production and peasants’welfare are two factors supporting food security. Valeeva et al. (2005) states that peasants’ knowledge is a the most important factor supporting food security. Shackleton et al. (2001) state that the contribution of land-based activities have significant roles on the financial and social accounting methods and descriptive statistics. The results showed that the aggregate of national food security in Indonesia is stable, despite the fact that it has some problems in the household level in terms of its availability. Ariani (2006) reminded that although nationally food national product is sufficient , there are many areas suffering from food scarcity
The fact was supported by the findings of Purwantini et al. (2002) who analyzed food by observing the production, availability, and food trade based on food scale. Food security in an area does not guarantee the same con-dition in the household level. The percentage of household suffering from food scarcity in rural areas is higher than that in big cities. Srivastava et al. (2004: 958) states that there is a significant relationship between poverty and critical land. So that it can affect food security.
Based on the facts above, it will be interesting to study food security not only from normative factors such as availability and individual nutrition needs, but also from wider aspects such as biogeophysic ones, purchasing power, social-cultural ones. nutrition and there is a guarantee in the safety, equal distribution, and the ability to purchase it to have an active and healthy life. The view of food security should be altered from food availability unaffected by seasons, and accessibility of food.
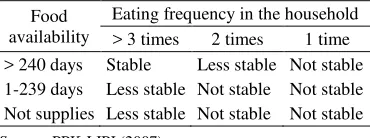
According to PPK-LIPI (2007) the availability of (1) ≥ 240 days is categorized as sufficient; (2) 1-239 days – less sufficient; and (3) 0 – not sufficient. The combination of food availability and the eating frequency (eating three times a day is categorized as sufficient, two times a day is not sufficient and one time a day is categorized as poor eating) is an indicator of food security as can be seen in Table 1.
Table 1. Food Availability Indicators in Household Level
Food availability
Eating frequency in the household > 3 times 2 times 1 time > 240 days Stable Less stable Not stable 1-239 days Less stable Not stable Not stable Not supplies Less stable Not stable Not stable
Source: PPK-LIPI (2007)
Then, how the households get the food is categorized into two categories namely: (1) self-production and (2) buying. Accessability indicators can be seen in Table 2.
(1) sufficient availability; (2) normal con-sumption; (3) direct access to food as shown in Table 3.
Table 2. Household Accessability Indicators Farm
ownership How the households get food Yes Direct access Indirect access No Indirect access
Source: PPK-LIPI (2007)
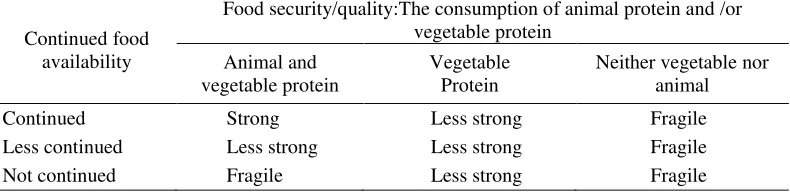
Food security index is calculated by combining the four factors (food availability, stable food availability, continued and quality or food safety). The combination food availability and eating frequency show the stability of food availability. The combination of stable availability and access to food show continued food availability. Table 4 shows the categories of household food security index. It is a combination of continued availability factor and food quality or food security.
Based on the matrix above, a household can be categorized in three catagories: (1)
strong food security; it always have staple food continuously (measured by the food availability in one harvest time as well as by the eating frequency); (2) Less strong food security– it always have staple food continuously but the income is spent on vegetable protein only or it does not have staple food continuously but it has the capability to spend on animal and vegetable protein; (3) fragile food security is characterized by the avialability of food, but it does not have income to be spent on neither vegetable nor animal protein or the availability of food is not a continued one and it only have income to be spend on either animal or vegetable protein or neither of them; or the availability of food is not a continued one although the family has money to spend on both vegetable protein and animal one.
Environment ecosystem and Food security Land is an area on the earth surface having a fixed characteristics vertically upward and downward , including atmosphere, soil, geology dan geomorfology, hidrology,
Table 3. Household Food Availability Indicators
Access to food Household food availability
Stable Less stable Unstable Direct access Continues Less continues Not continues Indirect access Less continues Not continues Not continues
Source: PPK-LIPI (2007)
Table 4. Household Food Security
Continued food availability
Food security/quality:The consumption of animal protein and /or vegetable protein
Animal and vegetable protein
Vegetable Protein
Neither vegetable nor animal
Continued Strong Less strong Fragile
Less continued Less strong Less strong Fragile
Not continued Fragile Less strong Fragile
Journal of Indonesian Economy and Business May 242
plants and animals. It is the product of human activities in the past and at present. The extension of the characteristics will affect land use by human being now and in the future (Van Zuidam & Van Zuidam-Cancelado, 1979). land capability shows general classification such as land to be used for farming, forestry, conservation and so on.
Land capability consists of eight classes. The first class does not have many obstacles. This class is suitable to be used for farming, forestry, conservation. The topograpy is flat (the slope is 3%). It does not face erosion or flood. It is also very fertile, thus the first class is suitable for farming.
The second class has some drawbacks. It needs to be improved in order to be used. The structure of the land is not very good. The slope is is usually wavy with the gradient of 3-8%. Sometimes natrium emerges, sometimes it contains too much water. The second class land can be used for farming after some improvements are made.
For III-VIII classes, the land has many obstacles that it needs speical conservation treatment. The land belongs to these classes have wavy or hilly slopes with the gradient over 8%. They are also prone to be attacked by erosion or heavy flood. These classes are not suitable for farming but they can be used for other purposes.
Land suitability is categorized into two classes namely (S, suitable) – meaning the land can be used for certain activities (e.g. for farming); and (N, not suitable) – meaning the land can not be used (CSAR, 1996).
RESEARCH METHODS
Data and Research Location
There are several steps done in the research, namely: (1) documenting the areas to be investigated by collecting information about them in the forms of maps articles, papers and other publications; (2) document-ing the existdocument-ing resources; (3) evaluatdocument-ing and analyzing.
Primary data were collected by survey using interviews. Secondary data were taken from many sources including internet. Sample representation depends on: (1) the significant level desired, (2) the errors that can be tolerated (3) the dispersion in the population estimated (Palumbo, 1977). However, the size of the samples is also based on the re-searcher’s professional judgment (Zikmund, 1991). taken as the samples. The samples were taken randomly. Finally, the peasants’ household samples were taken randomly by using the Watson formula (1993: 333-371) as follows
error () is set at 1% of the level of confidence is 99% so that from the table it is known that Z½= 2,58; (3) L and R are the
average errors of the left and right population. The samples used were 600 respondents is multinomial logit multinomial model. (Maddala, 1991; Gujarati, 2003). Polychoto-mous choice framework is used to explain about the level of food security. Stynes & Peterson (1984) state that binary logit model is the appropriate framework to analyze binary options. For those having more than two options multinomial logit model derived from random utility model is used (Maddala, 1991). The utility, Uij, food security -i from option-j; and error eij based on Weibull distribution; so the derivative probability Pij is related to the alternative options -j:
Pij =
By considering food security indicator variable, social-economic, psychographic and environment factor, the general estimation is as follows:
KPij= ƒ (ENVj, SECi, NEPi, KABi, ) (4)
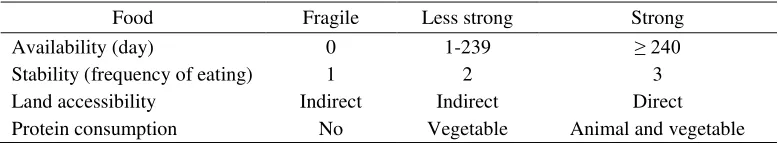
KP is food security of the people in rural areas in DIY province, which are categorized into three, namely: 0=fragile, 1=less strong and 2=strong. The criteria for food security are based on availability, stability, accessibility and protein consumption (Table 5).
Env is environment factor land capability (1=good namely land class I-II, 0=no good namely class III-VIII), land suitability (1=suitable– land can be used for farming without obstacles, 0=not suitable – it has many obstacles to be used for farming), irrigation (1= technical, 0=precipitation).
SEC – social economic – income (rupiah per year, family size, education, gender; plants owned (1=paddy, 0=others), fertilizing (1=organic – DIY province does not have land which is a hundred percent free from chemical substance, so semi organic land is considered as organic proxy, 0=inorganic), farming techniques (1=polyculture, 0=monoculture); NEPi is the awareness toward household
environment i, NEP is measured by Dunlap & Van Liere instrument (1978); error. The probability of marginal effect by Greene (2003: 674-675, 794-797) is formulated as:
Table 5. Food Security Criteria
Food Fragile Less strong Strong
Availability (day) 0 1-239 ≥ 240
Stability (frequency of eating) 1 2 3
Land accessibility Indirect Indirect Direct Protein consumption No Vegetable Animal and vegetable
Journal of Indonesian Economy and Business May 244
k k k j j i j
P P
P
)
(
(5)
RESULT AND DISCUSSION
Respondent Profiles
561 out of 600 respondents can be processed. 82.7% are males; most of them did not finish their senior high school (76.3%). Most of them are married (97.5%) and 34% have more than 3 dependents. They live in 4 regencies, 33 districts, 104 villages and 212 sub-villages in rural areas in DIY province namely in Sleman, Bantul, Kulon Progo and Gunung Kidul (Table 6).
Table 6. Research Location
Regencies Districts Villages
Bantul 11 43
Gunungkidul 9 17 Kulon Progo 7 25
Sleman 6 19
Jumlah 33 104
Source: Data Primer data (Processed)
The ages of the respondents are between 26 to 90 years old as shown in Table 7. It shows that age is not an obstacle for some people to keep on working in the farming sector; it also shows that the majority of the people do not have saving so they have to work during their lifetime.
Most of them work as farmers (77.4%), while others consider being farmers as additional jobs since their main jobs are civil servants , army members, employees and so on. 64.3% state that they have other jobs besides being farmers. 67.4% have access to land, however they belong to small farmers because on the average they only have 2.463,49 meter square or about sekitar 0,25 hectare. The number is smaller than the average in DIY province which is 0,5 hectare (Bapeda DIY, 2008); others work as employees working for other farmers.
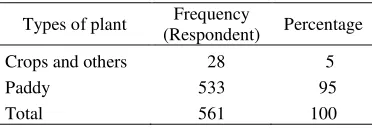
Some farmers attend their own land, some others rent their land because they cannot attend to it. The majority of them plant paddy (Oryza sativa), others plant crops (Table 8).
Table 7. Types of Plants Per Season
Types of plant Frequency
(Respondent) Percentage
Crops and others 28 5
Paddy 533 95
Total 561 100
Source: research (processed)
The average income in farming sector is Rp 2,6368 million per harvest time or Rp 5,2736 million per year, while income in non-farming sector is Rp 2,9961 million so the total is Rp 8,2697 million. The result shows that the farmers’income in the year 2008 is slightly above the DIY province basic minimum wages which was Rp. 7,032 million per year.
Table 8.Respondents’ages
Age (year) Regencies Total
Bantul Gunungkidul Kulon Progo Sleman
< 35 2 5 5 4 16
35 - 50 51 40 73 71 235
51 - 65 67 67 72 39 245
> 65 23 13 19 10 65
Total 143 125 169 124 561
Table 9. Actual and Prediction Food Security
Actual (Food security)
Prediction
Total The accuracy of the prediction Fragile Less strong Strong
Fragile 77 2 5 84 91,67
Less strong 12 8 91 111 81,98
Strong 5 6 355 366 96,99
Total 94 16 451 561
Source: Primary data (processed by LIMDEP)
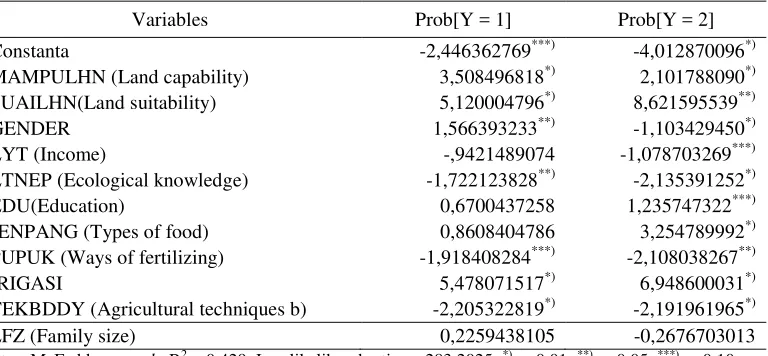
Table 10. Estimated Empirical Result
Variables Prob[Y = 1] Prob[Y = 2]
Constanta -2,446362769***) -4,012870096*)
MAMPULHN (Land capability) 3,508496818*) 2,101788090*) SUAILHN(Land suitability) 5,120004796*) 8,621595539**)
GENDER 1,566393233**) -1,103429450*)
LYT (Income) -,9421489074 -1,078703269***)
LTNEP (Ecological knowledge) -1,722123828**) -2,135391252*)
EDU(Education) 0,6700437258 1,235747322***)
JENPANG (Types of food) 0,8608404786 3,254789992*) PUPUK (Ways of fertilizing) -1,918408284***) -2,108038267**)
IRIGASI 5,478071517*) 6,948600031*)
TEKBDDY (Agricultural techniques b) -2,205322819*) -2,191961965*)
LFZ (Family size) 0,2259438105 -0,2676703013
Notes: McFadden pseudo-R2 = 0,429; Log likelihood ratio= - 283,2025; *) p<0,01; **) p<0,05, ***) p<0,10; Y=1 the probability of sufficient food security household, Y=2 the probability of strong food security household
Source: Primary data processed
If it is assumed that 0,25 hectare yields Rp 5,2736 million per year, thus per havest time per hectare per year they will get Rp. 21,0944 million. The production cost spent by the farmers on the land on the average is Rp 4,98 million rupiah with the standard deviation of Rp 0,71 million per hectare each harvest time. It is in accordance with the press release of Agricultural Ministry (2008) which stated that the production cost in the farming sector is about Rp 4-5 million per hectare in one harvest time. Thus, the net income in farming sector is Rp 11,1344 million per hectare per year or Rp. 5,5672 million per harvest. It means that almost nothing is left. That is why they have to find other source of income.
Journal of Indonesian Economy and Business May 246
85.2% of respondent use monoculture, others use polyculture, by means of unorganic fertilizer (39.9%), organic (6.4%), and mixed techniques (53.7%). It shows that the use of chemical fertilizer is still widely used in the research locations. According to Kartodihardjo & Jhamtani (2006), the use of chemical sub-stance in the short term will boost the pro-duction, but in the long term it will make the production stagnant and finally decreases. Thus, chemical fertilizer should be avoided and altered into unorganic one such as cows and buffalos (20.5%).
The yield is used for self-consumption
Food Security in DIY Province
Polychotomous choice framework is used to explain the concept of food security. There are three categories namely: (1) fragile, (2) less strong, or (3) strong. The study found 84 people categorized as fragile, 111 people categorized as less strong and 366 people as strong food security (Table 9).
Limited Dependent Variable or LIMDEP were predicted as fragile food security. It is in accordance with the data from Kuncoro (2004) and BPS DIY (2007) that show the percen-tages of poor people in the province of DIY as 19.14% and 19.04% respectively. They are
poor and categorized as fragile food security. The accuracy of the prediction is above 75%.
Polychotomous choice framework analysis shows that utility function is not directly estimated by food security model (Table 10). McFadden value of pseudo-R2 0,429 or 42.9% shows variety in the probability of food security as the dependent variable that can be explained by predictor variables. The Likelihood Ratio (LR) with the value of 2 283,2025 is higher than dari 2 in the table which is 10.851 at df=20 and =5%. It means that the model is appropriate to be used (Maddala, 1991; Mitchell & Carson, 1989).
At Y=1 (the probability of sufficient food security household); income (LYT) and education (EDU) do not have significant effects, while land capability (MAMPULHN), land suitability (SUAILHN), irrigation, and agricultural techniques (TEKBDDY) are significant at p<0.01, while ecological knowl-edge (NEP) and ways of fertilizing (PUPUK) are significant at p<0.05 and p<0.10.
At Y=2 (the probability of strong food security household); the class of land (MAMPULHN), types of plants (JENPANG), gender, irrigation, agricultural techniques (TEKBDDY) and ecological knowledge (NEP) have significant p-value (p<0.01). While land suitability for farming (SUAILHN), ways of fertilizing (PUPUK) are significant at p<0.05. Education (EDU) and income (LYT) are significant at p<0.10. It can be concluded that predictors are significant to the criteria and they are in accordance with the theories used.
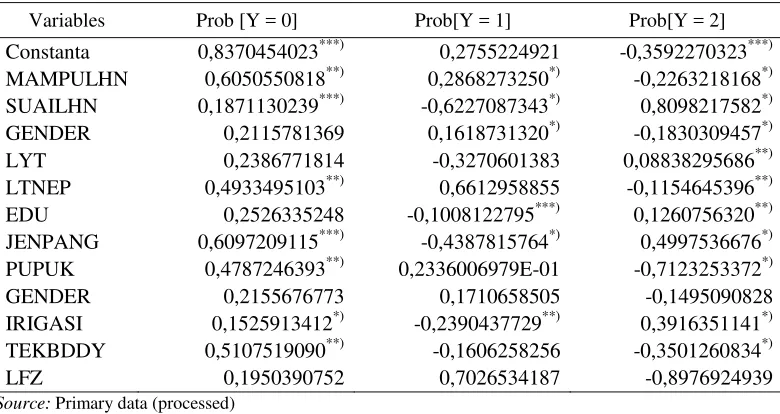
Table 11. Marginal Effects on Food Security
Variables Prob [Y = 0] Prob[Y = 1] Prob[Y = 2]
Constanta 0,8370454023***) 0,2755224921 -0,3592270323***)
MAMPULHN 0,6050550818**) 0,2868273250*) -0,2263218168*)
SUAILHN 0,1871130239***) -0,6227087343*) 0,8098217582*)
GENDER 0,2115781369 0,1618731320*) -0,1830309457*)
LYT 0,2386771814 -0,3270601383 0,08838295686**)
LTNEP 0,4933495103**) 0,6612958855 -0,1154645396**)
EDU 0,2526335248 -0,1008122795***) 0,1260756320**)
JENPANG 0,6097209115***) -0,4387815764*) 0,4997536676*)
PUPUK 0,4787246393**) 0,2336006979E-01 -0,7123253372*)
GENDER 0,2155676773 0,1710658505 -0,1495090828
IRIGASI 0,1525913412*) -0,2390437729**) 0,3916351141*)
TEKBDDY 0,5107519090**) -0,1606258256 -0,3501260834*)
LFZ 0,1950390752 0,7026534187 -0,8976924939
Source: Primary data (processed)
Notes: *) p<0,01, **) p<0,05, ***) p<0,10; Y=0 the probability of fragile food security household , Y=1 the probability of sufficient food security household, Y=2 the probability of strong food security household
The marginal effects can be found in Table 11 and Table 12. At Y=0, it is shown that there is an increase in the land capability p<0.05. Land suitability p<0.10, irrigation p<0.01 and ecological knowledge p<0.05 will reduce the probability to be hit by malnu-trition. Variety of plants planted p<0.10 will also improve the strength of household security by 25.91%. Organic fertilizer p<0.05 will increase the strength of household food security by 12.15% compared to inorganic one.
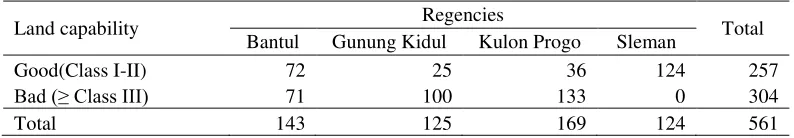
Land capability used in the research ranges from class I to V. The researchers simplified the classes into two categories namely good (Class I-II) and bad (Class III-VIII) (Table 13).
At Y=1, the improvement of land capa-bility will increase the probacapa-bility of changing from fragile to less strong food security by 1.33 times p<0.01. Land having limited obstacle factors will increase the probability of changing from fragile to less strong food
security by 53.64%. The variety of plants planted will increase food security by 65.05% at p<0.01. Irrigation will increase by 78.74 % at p<0.05.
Marginal effect at Y=2, the improvement of land capability will increase food security 79.75 (e-0,2263)%. The improvement of land capability is usually related to other compo-nents such as form, hidrology and micro climate. When the obstacles such as topo-graphy, erosion sensitivity, salinity and so on can overcome, there is a bigger possibility to plant there.
Journal of Indonesian Economy and Business May 248
Table 12. Average Individual Marginal Effect
Variables Y=00 (fragile) Y=01 (less strong) Y=02 (strong)
MAMPULHN -0,0633 0,2131 -0,1499
SUAILHN -0,1720 -0,3997 0,5716
GENDER 0,0180 0,1093 -0,1273
LYT1 0,0237 -0,0277 0,0040
LTNEP 0,0469 0,0366 -0,0835
ONE 0,0986 0,1742 -0,2728
EDU -0,0292 -0,0658 0,0950
JENPANG -0,0650 -0,3046 0,3696
PUPUK 0,0602 -0,0005 -0,0597
IRIGASI -0,1872 -0,1212 0,3084
TEKBDDY 0,0654 -0,0311 -0,0343
LFZ 0,0194 0,0702 -0,0896
Source: Primary data (processed)
Table 13. Land Capability Classes
Land capability Regencies Total
Bantul Gunung Kidul Kulon Progo Sleman
Good(Class I-II) 72 25 36 124 257
Bad (≥ Class III) 71 100 133 0 304
Total 143 125 169 124 561
Source: Primary data (processed)
Natural fertilizing is one of the efforts to stay healthy. Land fertilized by compost will reduce the harmful effect on the land. Therefore, organic fertilizing will increase food security by 49.16 (e-0.71) %.
Gender also increase food security by 19, 72 (e-18..30)%. It shows that females are very much needed to support food security. It can be concluded that females belong to the nature while males belong to the civilization (Grivin, 1988). Females are now considered as the backbone of preparing food security
The increase of income causes the possibi-lity of increasing food security by 1.09 times (e0,088). Not being dependent on one type of food will increase the possibility of having better food security by 65 (e0.4997)%. Cassava, fruit, vegetable, meat, fish, can all be used .
Areas having their own irrigation system will have better food security by 47.7 (e0.39)%. Those whose irrigation system depends on rain must find ways to water their farm. In the dry season, they have to find activities to earn money. They can produce handicraft to earn money. The money then can be used to boost food security. The variety of food has the ability to increase food security by 70.47 (e
-0.35
)%.
CONCLUSIONS
Some factors affecting food security (avai-lability, distribution, stability and accessibili-ty) in rural areas in DIY province are based on three components namely income, socio-cultural (gender, types of food, ways of ferti-lizing, agricultural techniques and ecological knowledge) and ecology (land capability, land suitability, irrigation), ceteris paribus. The three components cannot be separated .
There are some implication of the research. First, the government should support women to strengthen home industry in villages. Second, the government should increase infrastructure, transportation and facilities to smoothen food accessibility. Third, water resources must be well-managed. The community must be involved in taking care of water resources.
Ecological function must be well-main-tained hydrological recycle. The quality of water must always be protected. Vegetative plants can be used as forest buffers or waterbreaks.
Finally, land capability class having non-permanent obstacles must be improved individually and collegially by means of SWC (soil and water conservation) technique. Trapping water or preserving run off can be done by bioengineering combining physical, vegetative and cultural. All the activities must be followed by good community planning involving the province as well as the regencies.
REFERENCES
Ariani, M., 2006. Reinforcement Local Food Security for Supporting National Food Security. Report for Centre of Social-Economic and Agriculture Policy. Bogor Bapeda (Local Planning Agency) DIY. 2008.
Arranging for Planning of Development in Fields of Agribusiness and Marine accessed at http://www.bapeda.jogjaprov.go. id
BPS [Centre of Statistic Agency], 2007. DIY in Number. Yogyakarta: BPS DIY. Cochran, W.G., 1991. Teknik Penarikan
Sampel. 3rd ed. Jakarta: UI Press.
CSAR [Centre for Soil and Agroclimate Research], 1996. Guidelines for Landform Classification. Bogor: CSAR.
Darwanto, D.H., 2005. Food security based on
production and farmer’s welfare [Ilmu Pertanian], 12 (2): 152-164.
Deptan [Ministry of Agriculture] RI, 2008.
“Increasing in Production Cost: Profit Margin of Farmers will Decrease”, Publiseh article. Jakarta: Kompas, May 27, 2008.
Dunlap, R.E., and K.D. Van Liere, 1978. ‘The New Ecological Paradigm: a Proposed measuring instrument and preliminary results’. Journal of Environmental Education, 9: 10-19.
FAO [Food and Agriculture Organisation of the United Nations], 1996. “World Food
Summit”, Working Paper 13-17 November 1996. Rome, Italy: FAO. Greene, W.H., 2003. Econometric Analysis. 5th
ed. Saddle River, NJ, USA: Prentice Hall, Inc.
Grivin, D.V., 2005. Spirituality and Society: Postmodern Visis. Albany, USA: State University of New York.
Gujarati, D., 2003. Basic Econometrics. 4th ed. Singapore: McGraw-Hill.
Kartodihardjo, H., and H. Jhamtani, 2006. Environmental Politic and Power in Indonesia. Singapore: Equinox.
Kuncoro, M. 2004. “Transformasi dan ketim-pangan di DIY” [Transformation and Inequality in DIY]. Kompas, 13 Desember 2004.
Journal of Indonesian Economy and Business May 250
Maddala, G.S., 1991. Limited-Dependent and Qualitative Variables in Econometrics. New York, USA: Cambridge University Press.
Mitchell, R.C., and R.T. Carson. 1989. Using Surveys to Value Public Goods: The Contingent Valuation Method (Resources for the Future). Washington, D.C.: Resources for the Future.
O'Connor, R.A. 1995. ‘Agriculture change and ethnic succession in Southeast Asian Studies: A Case for Regional Anthropology’. The Journal of Asian Studies, 54 (4): 969.
Palumbo, D.J. 1977. Statistics in Political and Behavioral Science. NY, USA: Colombia University Press.
PPK-LIPI [Research Centre of Demography-LIPI], 2007. ”Household Food Security in Rural Area: Concept and Measurement”. Jakarta: Research Centre of Demography -LIPI.
Purwantini, T.B., H.P.S. Rachman, and Y. Marisa, 2002. “Regional and Household Level of Food Security: Case Study in Nothern Celebes Province”. Report for Centre of Social-Economic Analysis and Agriculture Policy, Bogor.
Rachman, H.P.S., S.H. Suhartini, and G.S. Hardono, 2004. ”Prospect of Food Secu-rity: Autonomy Food Ascpect Analysis”. Report for Centre of Social-Economic Analysis and Agriculture Policy, Bogor. Shackleton, C.M., S.E. Shackleton, and B.
Cousins, 2001. ‘The role of land-based strategies in rural livelihoods: The contribution of arable production, animal husbandry and natural resource harvesting in communal areas in South Africa’. Development Southern Africa, 18 (5): 581-604.
Srivastava, S. K., C. B. S. Dutt, R. Nagaraja, S. Bandyopadhayay, H. C. M. Rani, V. S. Hegde1 and V. Jayaraman, 2004. ‘Strategies for rural poverty alleviation in India: A perspective based on remote sensing and GIS-based nationwide
wasteland mapping’. Current Science, 87 (7): 954-959.
Stynes, D.J., and G.I. Peterson, 1984. ‘A Review of logit models with implication for modelling recreational choices’. Journal of Leisure Research, 16: 295-310. Tambunan, T.T.H., 2008. “Food Security in
Indonesia: Identification Several Pro-blems”. Published Paper, Indonesia Chamber of Commerce and Industry available at http://www.kadin-indonesia. or.id accessed on June 2, 2008.
Tambunan, T.T.H., 2008. “Food Security in Indonesia: Core Problems and Its Solution”. Published Paper, Study Centre of Small Industry and Small and Medium Enterprises/Indonesia Chamber of Commerce and Industry available on http://www.kadin-indonesia.or.id accessed on Juni 2, 2008.
The Food Security Act, 1996. RI’s Act Number 7 Year of 1996.
Usman, S., 1998. Pembangunan dan Pember-dayaan Masyarakat. Yogyakarta: Pustaka Pelajar. Agricultural Economics, 27 (4): 574-592. Van Zenten, W. 1994. Statistika Untuk
Ilmu-Ilmu Sosial [Statistics for Social Science]. 2nd ed. Jakarta: Gramedia Pustaka Utama. Van Zuidam, R.A., and F.I. Van
Zuidam-Cancelado, 1979. “Terrain Analysis and Classification Using Aerial Photographs", Published Paper, The Netherlands: International Institute for Aerial Survey and Earth Science (ITC).
Watson, C.J., P. Ballingsley., D.J. Croft., and D.V. Hundsberger, 1993. Statistics for Management and Economics. Englewood Cliffs, NJ, USA: Prentice Hall, Inc. Zikmund, W.G., 1991. Exploring Marketing