MODELING MAIN BODY OF OVERCROSSING BRIDGE BASED ON
VEHICLE-BORNE LASER SCANNING DATA
Xuexia Chen a,b, *, Min Chen c, Zhanying Wei a,b, Ruofei Zhong a
a
Beijing Advanced Innovation Center for Imaging Technology, Capital Normal University, Beijing 100048, PR China - [email protected]
b Chinese Academy of Surveying and Mapping, Beijing 100830, PR China - [email protected] c
Beijing Pake International Engineering Consulting Co.Ltd., Beijing 100022, PR China - [email protected]
Commission III, WG III/6
KEY WORDS: VBLS, point cloud, virtual path, line extraction, line segments cluster, overcrossing bridge modelling
ABSTRACT:
Vehicle-borne laser scanning (VBLS) is widely used to collect urban data for various mapping and modelling systems. This paper proposes a strategy of feature extraction and 3d model reconstruction for main body of overcrossing bridges based on VBLS point clouds. As the bridges usually have a large span, and the clouds data is often affected by obstacles, we have to use round-trip cloud data to avoid missing part. To begin with, pick out the cloud of the bridge body by an interactive clip-box, and group points by scan-line, then sort the points by scanning angle on each scan line. Since the position under the vehicle have a fixed scan-angle, a virtual path can be obtained. Secondly, extract horizontal line segments perpendicular to the virtual path along adjacent scan-lines, and then cluster line segments into long line-strings, which represent the top and bottom edge. Finally, regularize the line-strings and build 3d surface model of the bridge body. Experimental studies have demonstrated its efficiency and accuracy in case of building bridge model. Modelling the stairs at the both end of the bridge will be the direction of the next step.
* Corresponding author: Xuexia Chen, was born in 1982. She has been a researcher on VBLS point cloud extracting and 3D modelling f or several years. Email: [email protected], Tel:+086-13911279142
1. MANUSCRIPT
Vehicle-borne laser scanner has been widely used for dynamic and fast acquisition of the 3D point cloud. At present, the mainstream scanner is equipped with 1 or 2 lasers. Single laser device is installed with a fixed angle to the zenith direction, and the scanning lines are approximately parallel. The scanner with two lasers has a fixed angle between each other, scanning lines from each laser are intersected. In the practice, when the road is bi-directional to more than 6 lanes, due to block of the green belt along the middle of the road, both of the scanner must make a round-trip to obtain complete data. In this paper, the research object is overcrossing bridge which span is very long, and the two main facades perpendicular to the road are blocked by each other(see Figure 1), thus round-trip data is used.
Figure1. round-trip scanning to get the two main facades
Plenty of research focuses on point cloud filtering, index, classification and feature extraction. The purpose of the cloud filter is to remove the noise point, and to retain the appropriate point density, preparing for the subsequent classification and feature extraction. The study of this paper is based on the filtered point cloud which retains the characteristics, the point distance on the road is about 5 centimetres, and the line interval is about 7 centimetres. In the index of the cloud, R tree, KD-Tree, Octree are applied for fast retrieval. These indexes are based on discrete points and the world coordinate system. From the hardware point of view, the original point cloud in time and
angle are orderly, thus this paper try to establish the dynamic coordinate system in the forward direction, so as to improve the searching speed. The traditional point cloud classification separate the ground point from others firstly, and then divided the remaining points into high vegetation, low vegetation, building facades, roads, wires and so on. This classification is too general. The overcrossing bridge is a complex entity, not in these categories, its direction is almost perpendicular to the driving direction. Basing on those knowledge, this paper describes extracting and modelling the main body of overcrossing bridge from the point cloud.
2. METHODOLOGY 2.1 Build Mobile Coordinate System basing Path
The direction of the scanning vehicle is close to that of the road, and it is suitable for the acquisition of the belt-like information along the road, and a large number of artificial structures are distributed along the road, considering the establishment of the dynamic coordinate system M related to the direction of the vehicle. Assuming that the vehicle is y-axis at any time, the up axis is the z-axis, and the x-axis is established in the right-hand coordinate system perpendicular to yz. The origin of the coordinate system is the point just below the laser at this time. The relationship between multiple dynamic coordinate systems M at any time can be represented by the origin of the mileage value and the vector of the adjacent origins. The coordinate system can describe the travel direction of the vehicle at any time, the cumulative mileage, the left side or right side to the scanner. In this way, the unstructured point cloud is organized into orderly cloud.
To construct such a dynamic coordinate system, it is necessary The International Archives of the Photogrammetry, Remote Sensing and Spatial Information Sciences, Volume XLII-2/W7, 2017
ISPRS Geospatial Week 2017, 18–22 September 2017, Wuhan, China
This contribution has been peer-reviewed.
to rely on trajectories. The trajectory can be a combined navigation calculation results, or a virtual trajectory. Scanned point cloud data is distinguished in the forward direction according to the scan line, and is orderly arranged according to its angle from small to large. Assuming that there’s always a virtual ground point P below the scanner, the angle from z axis to OP is fixed on each scanning line. Taking Riegl laser for example, the zenith direction is 0 degree, the angle between z-axis and OP is 180 degree. Since the ground points under the vehicle are always not blocked, the virtual point can be interpolated by its nearest points. The connection of the virtual point on each scan line is the virtual trajectory. Figure 2 shows the Dynamic coordinate system and scanning line.
Figure 2. Dynamic coordinate system and scanning line
For the scanning line i, which nearby scanning lines are i-1 and i+1, take the three virtual points (Pi-1, Pi, Pi + 1) to make an arc, the tangent line L on Pi is the y-axis of scanning line i. For each point on the scanning line i, assuming that the coordinates in the dynamic coordinate system are (x ', y', z '), then x' is the distance from point to line L, and its sign represents the left or right side of the vehicle, z ' is the height of the point relative to the origin, and y' is the distance from the point to the x-axis.
After establishing the dynamic coordinate system, the points on the adjacent scanning lines whose x' is nearest to the point’s on the current line can be easily obtained. Mark the nearest point on backward and forward scanning lines as (Ni-1, Ni + 1), then the origin point P (X, Y, Z, ScanlineId) are expanded to P (X, Y, Z, ScanlineId, x ', y', z ', Ni-1, Ni + 1). Based on this information, neighbor search become faster and easier. In the case where the curvature radius of the vehicle is large, the value of x' of several continuous scanning lines is very close, and when the radius of curvature is small, the x'-coordinate difference is larger and the search threshold needs to be increased.
2.2 Feature Extraction
The traditional extraction method has three ways: extraction based on the point cloud, based on the camera or video photos, or based on digital image generated by point cloud. Extraction based on the photos or images often depends on SIFT feature matching, although the RANSAC algorithm on which the SIFT match depends is improved, with the increase number of gross error points in the sample set, the efficiency of the RANSAC algorithm is exponentially decreasing. Extraction directly based on point cloud is divided into two main types, based on boundary and based on surface. The former is more sensitive to rough points, and the latter has a good robust, of which the key is to determine the seed point and the growth of area. In the aspect of the extraction of curb, there is a boundary line connection method based on the scanning line and elevation gradient histogram method. To extract rod-shaped objects, point projection density method, and seed point growth application are used. These two methods can also be used to extract the building facades.
To preparing the data for over-crossing bridge extraction, use the mobile adaptive TIN model (Axelsson, 2000, 33-Part B4) to filter the ground point firstly. The remaining points of the cloud includes the rod-shaped objects, buildings, other vehicles,
bridges, etc. Those points will not be classified, directly extract the features of the main bridge body. Considering that the bridge body has a long horizontal plane for people passing, and another horizontal plane intersecting with two or four facades, those planes form a box which hide the detailed frame. Figure 3 shows the main body of the bridge. The following paragraphs just describe the extraction method of the main deck and facades.
Figure 3. the main body of the bridge
First of all, find the location of the bridge body. Since the deck has a big horizontal plane, search seed point of this plane by retrieval of the scanning lines and find points that above the laser, and have a 0 degree angle. If the seed point set makes a region greater than a given threshold and its z’ is also greater than another threshold, think it as a deck. The seed point set is a section of a scanning line, which is a straight line segment. It may be on the facades, or on the horizontal plane, marked as Li. Find the adjacent scan lines Li-1, Li + 1 of this scanning line, assuming that the minimum height of the deck is h, compare the height difference of the point cloud with x'≈0 and z '> h on the three consecutive lines, marked as Hi-1, i, Hi, i + 1. See figure 4. If both Hi-1, I and Hi, i + 1 are close to 0, then the three lines are located on the horizontal plane, and the point on Li is the inner point of the plane rather than the boundary point, if Hi-1, i close to 0, and Hi, i + 1 close to the spacing of the scanning lines, then the point on the Li is the boundary point, Li-1 and Li constitute a horizontal plane, while Li and Li + 1 constitute a vertical plane. Then, for the boundary point on Li, find the height difference mutation point along the x' axis and to the positive and negative direction respectively to determine the intersection or boundary line of the feature plane. Finally, the dynamic coordinate system, the angle between the vertical plane and the x-axis for each scanning line is not fixed, a larger y-coordinate range threshold can be set. At the same time due to the existence of the noise point, the vertical surface is not strictly vertical, also give an angle threshold between the plane and the z axis. The extracted faces may be some irregular facets with small intersections, which need to be regularized after eliminating redundant faces and isolating faces. The clustering The International Archives of the Photogrammetry, Remote Sensing and Spatial Information Sciences, Volume XLII-2/W7, 2017
ISPRS Geospatial Week 2017, 18–22 September 2017, Wuhan, China
This contribution has been peer-reviewed.
of the three-dimensional surface is more complicated than the clustering of the horizontal face and the line. As for vertical facet clustering, it is equal to cluster the horizontal projection of the facets. For each vertical facet, create bounding box, and get the box’s diagonal firstly. Figure 5 is the top view of the diagonals, it shows that the horizontal projection of the diagonal lines of the adjacent vertical faces may be crossed or separated.
Figure 5. Top view of vertical facets’ diagonal
Before clustering the line segments, need to force the segments to be horizontal, and then the normal distance (marked as d) of the two segments must be calculated: (1) calculate the intersection between line segment AB and CD, if there is no intersection, the two lines are parallel, d is the distance from point C to line AB. (2) if not parallel, calculate the distances from four end points to the other line and mark as p[4], and mark that if the projection point of each end point is on the other line segment as m[4], if in the line segment set true, otherwise set false. (3) If there is one or more true in m[4], then the nearest normal distance must satisfy m[i]=true and the nearest normal distance is . (4) If the m[4] are all false, then the two segments are considered to be separated in the extension direction, and the lengths of connections of four endpoints as AC, AD, BC and BD are calculated, and mark them as e[4]. The nearest normal distance can calculated by Min(e[i]) multiplying sin(the smaller angle between the nearest endpoints connection and one of the base line), see figure 6. BC are the nearest endpoints from the two line segments, ∠2 is smaller than ∠1, so BE is the nearest normal distance of AB and CD.
Figure 6. The nearest normal distance BE of line segment AB and CD
The following is the line segment clustering method: for the horizontal projection line segments collection S, take the first line segment L0 as the seed line, remove the L0 from S. (1) find Ln from the collection S, Ln has the nearest normal distance to the seed line, mark the nearest normal distance as d. (2) if d is less than a given threshold, then Ln and L0 are classified as a class, marked as a collection C, next we update the seed line: remove the Ln from S, calculate the furthest extension length of the middle line of C, find the two furthest distances in the extension direction from the set C, connect the midpoints of the two segments and expand to the farthest extension length. The new line segment is the seed line. As shown in the figure, the midpoint of the farthest line is connected to AB, AB will be expanded to A'B 'as the new seed line, repeat step 1 until there is no line in S; (3) If d is greater than a given threshold, it means that the L0 class is finished clustering. Ln belongs to a new class, remove Ln from S, take Ln as the seed, repeat step 1 until there is no line in S. See Figure 7.
Figure 7. Connect the furthest line center
and expand as a new seed line segment
2.4 Regularization
The lines and faces often do not expand to the desired position after clustering, thus need to be regularized and expanded. The method of facade regularization is: (1) For each faces in the each class, expand to rectangular façade according to the minimum Z and maximum Z, pick out the high edge and the low edge according to the center point height. (2) Line fitting for all high edges and low edges. (3) Rotate the line to be parallel to the x-axis, put the lines with minimum and maximum y coordinates into a pair, and expand the two lines to the minimum and the maximum x coordinates, finally rotate back to the original direction. (4) Repeat the above steps for the remaining line segments.
When the whole facades are expanded, the horizontal planes can be generated by connecting the lower edge of each pair, and also can be created by clustering the horizontal facets.
3. EXPERIMENT
Take a section of point cloud scanned by Riegl laser as an example, the virtual path generation indicates that the maximum deviation between virtual path and real path is 1.03 meters, and the maximum deviation appears in the vehicle turning place.
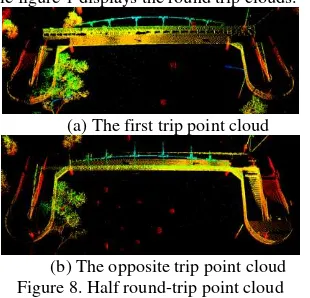
Figure 8 is the half-round point cloud of the over-crossing bridge, while figure 1 displays the round trip clouds.
(a) The first trip point cloud
(b) The opposite trip point cloud Figure 8. Half round-trip point cloud
Figure 9 shows the extraction results of the vertical and horizontal planes based the dynamic coordinate system, different colors represent the results of the round-trip scan.
(a) Round-trip vertical planes
(b) Round-trip horizontal planes Figure 9. Extraction planes based on The International Archives of the Photogrammetry, Remote Sensing and Spatial Information Sciences, Volume XLII-2/W7, 2017
ISPRS Geospatial Week 2017, 18–22 September 2017, Wuhan, China
This contribution has been peer-reviewed.
dynamic coordinate system
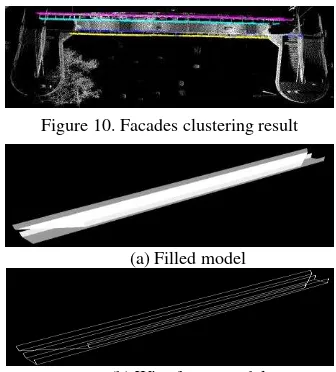
Figure 10 shows the clustering result of facades, and figure 11 is the automatically generated the main body model of the bridge.
Figure 10. Facades clustering result
(a) Filled model
(b) Wire frame model
Figure 11. Automatic models of the main planes
4. CONCLUSIONS
The paper puts forward the method of establishing the dynamic coordinate system of virtual path, and presents the feature extraction method based on dynamic coordinate system, and gives the feature line clustering method. Based on the above steps, the paper explores the automatic modelling of the main body of over-crossing bridge. The future research will model all the components of the bridge.
References
Yang Yang, Zhang Yongsheng, Ma Yiwei, Yang Jingyu. 2010. A Point Cloud Filtering Method of Vechile-Borne LIDAR Based on Scanning Beam. In: Journal of Geomatics Science and Technology, Beijing, China, Vol. 27, No. 3, pp. 209-212.
Fang lina,Yang Bisheng. 2013. Automated Extracting Structural Roads from Mobile Laser Scanning Point Clouds. In: Acta Geodaetica et Cartographica Sinica, Beijing, China, Vol. 42, No. 2, pp. 260-267.
Xu YeZhang, Wang Xinsen, Zheng Dehua, Xie Bo, Wang Chunlin. 2015. An Improved Algorithm of RANSAC to Extract Feature Point Cloud of Multi Model Arc. In: Engineering of Surveying and Mapping, Beijing, China. Vol. 24, No. 1, pp. 28-32.
Pan Guorong, Qin Shiwei, Cai Runbin, Gu Chuan. 2009. Fittdd Plane Automatic Extraction Algorithm of 3-D Laser Scanning. In: Journal of TongJI University(Natural Science). Shanghai, China. Vol. 37, No. 9, pp. 1250-1255.
Ma Zhenguo. 2010. A Point Cloud Aimplification Algorithm based on KD-Tree and Curvature Sampling. In: Science of Surveying and Mapping. Beijing, China. Vol. 35, No. 6, pp. 67-69.
Li Yongqiang, Sheng Yehua, Liu Huiyun, Zhang Ka, Dai Huayang. 2008. 3D Road Information Extraction based on
Vehicle Laser Scanning. In: Science of Surveying and Mapping, Beijing, China. Vol. 33, No. 4, pp. 23-25.
Axelsson, P. 2000. DEM Generation from Laser Scanner Data Using Adaptive TIN Models. In: International Archives of Photogrammetry and Remote Sensing. Amsterdam, Netherlands. 33, B4/1, pp. 111-118.
The International Archives of the Photogrammetry, Remote Sensing and Spatial Information Sciences, Volume XLII-2/W7, 2017 ISPRS Geospatial Week 2017, 18–22 September 2017, Wuhan, China
This contribution has been peer-reviewed.