Page 1 of 7 4 Mei 2016
Samuel Equity Research
Company Update
Ultrajaya Milk Industry
Bloomberg: ULTJ.IJ | Reuters: ULTJ.JK
DISCLAIMER: Analyst Certification: The views expressed in this research accurately reflect the personal views of the analyst(s) about the subject securities or issuers and no part of the compensation of the analyst(s) was, is, or will be directly or indirectly related to the inclusion of specific recommendations or views in this research. The analyst(s) principally responsible for the preparation of this research has taken reasonable care to achieve and maintain independence and objectivity in making any recommendations. This document is for information only and for the use of the recipient. It is not to be reproduced or copied or made available to others. Under no circumstances is it to be considered as an offer to sell or solicitation to buy any security. Any recommendation contained in this report may not be suitable for all investors. Moreover, although the information contained herein has been obtained from sources believed to be reliable, its accuracy, completeness and reliability cannot beguaranteed. All rights reserved by PT Samuel Sekuritas Indonesia.
Going Upward
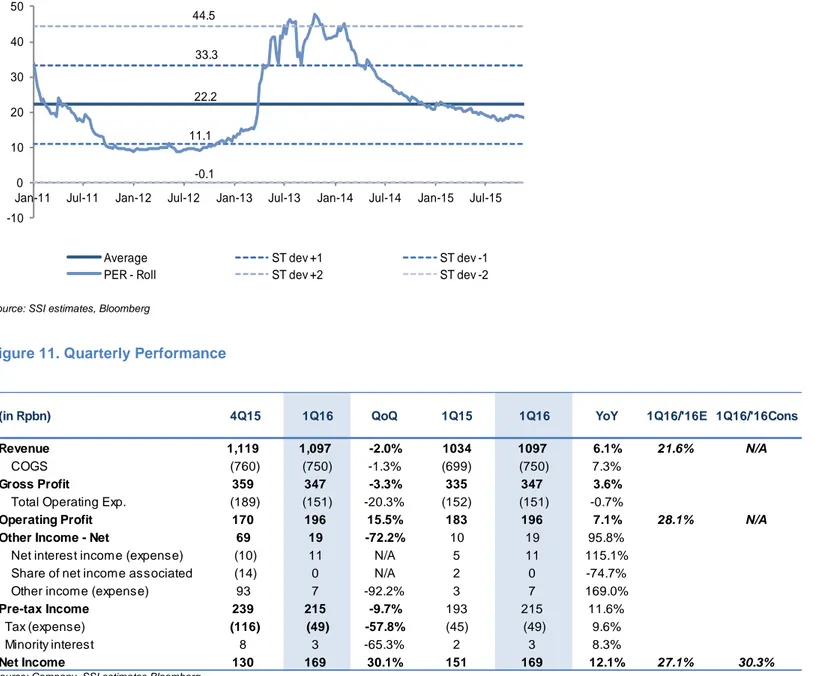
ULTJ berhasil membukukan kenaikan pada laba bersih sebesar 12.1%YoY (1Q16: Rp169 miliar vs 1Q15: Rp151 miliar), relatif in-line dengan ekspektasi kami. Kenaikan yang terjadi pada bottom line tersebut lebih disebabkan oleh turunnya beban pokok penjualan sebagai dampak dari masih berlanjutnya pelemahan harga susu bubuk dunia. Kami juga melihat tren pelemahan tersebut masih berlanjut untuk tahun ini, mengingat ekonomi Cina (konsumen utama susu dunia) yang masih belum menunjukkan pemulihan secara signifikan, di tambah dari sisi produsen dunia yang sampai saat ini belum ada sinyal untuk mengurangi jumlah produksinya. All in all, didukung dengan Rupiah yang semakin menguat, kami mempertahankan pandangan positif pada ULTJ untuk ‘16E dan mempertahankan rekomendasi BUY, TP Rp5,000/lembar saham (16E’PE: 22.8x dan PBV:5.2x).
Laba bersih 1Q16 sesuai dengan ekspektasi. Pada 1Q16 ini, ULTJ mencatatkan
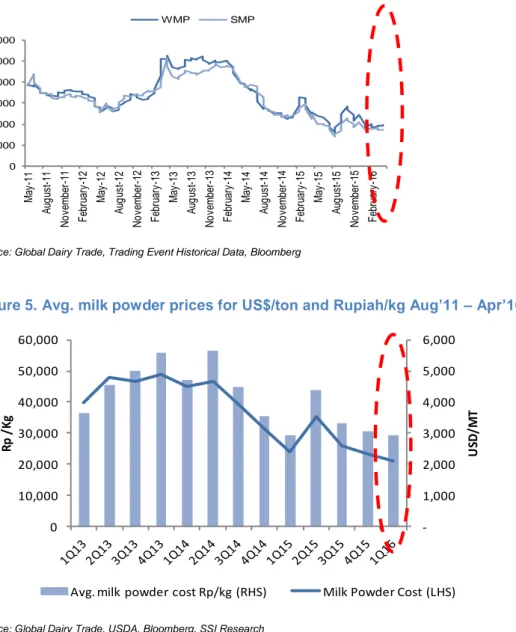
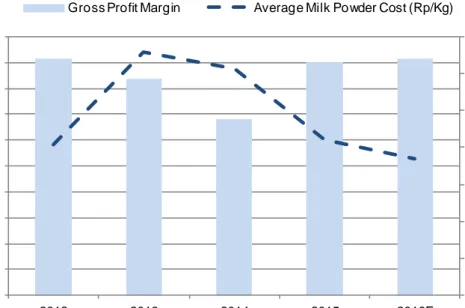
pertumbuhan 12.1%YoY dan mencapai Rp169 miliar, angka tersebut berada di atas estimasi kami dan konsensus, dengan masing – masing mencapai 27% dan 30% terhadap proyeksi untuk total laba bersih ‘16E. Kami melihat, turunnya beban pokok penjualan sebagai dampak dari rendahnya harga susu bubuk dunia turut berkontribusi mendongkrak laba bersih. Dengan perekonomian dunia dan Cina pada khususnya, sebagai pasar utama susu dunia belum menunjukkan pemulihan yang signifikan, serta produsen susu dunia yang belum menunjukkan tanda untuk membatasi volume produksinya, kami berpendapat rendahnya harga susu bubuk dunia terus berlanjut. Dengan asumsi Rupiah mencapai Rp13,000/dolar AS serta proyeksi harga susu bubuk dunia mencapai USD2,103/MT pada akhir tahun ini (FY15: USD2,298/MT), maka kami memperhitungkan gross profit margin mampu tumbuh 50 bps (‘16E; 32% vs FY15: 31.5%).
Katalis positif tambahan dari sisi volume. Jika dilihat dari catatan kinerja 1Q16,
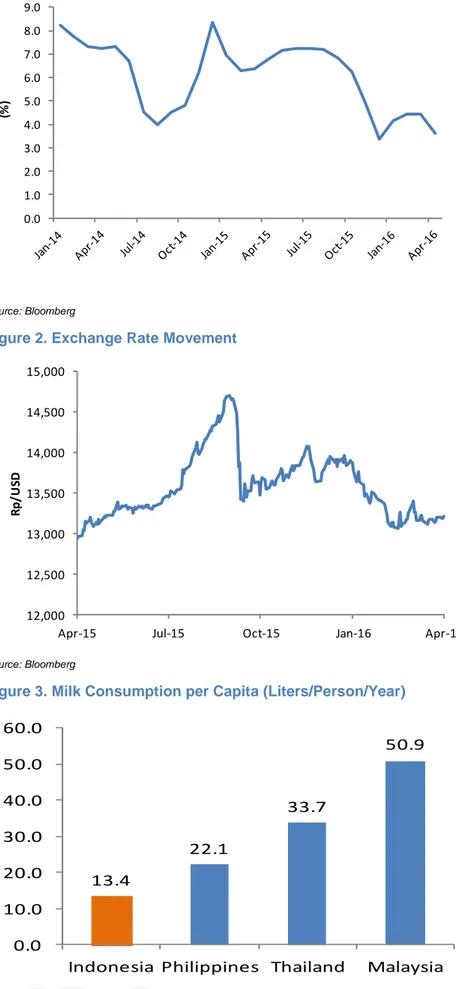
penjualan mengalami kenaikan sebesar 6.1%YoY dan hanya didorong oleh kenaikan volume. Sehingga, kami melihat resiliensi terhadap demand produk – produk ULTJ meskipun kuartal pertama kemarin ekonomi belum sepenuhnya pulih. Namun, jika dilihat pada tahun lalu, meskipun ekonomi Indonesia sedang melambat dan daya beli menurun, pertumbuhan volume ULTJ masih mampu mencapai 12.2%YoY. Maka, dengan optimisme daya beli masyarakat Indonesia yang perlahan membaik, serta tingkat konsumsi susu yang masih rendah di Indonesia (13 liter/orang/tahun vs rata – rata negara ASEAN: 30 liter/orang/tahun), kami memprediksi volume penjualan mampu tumbuh 15%YoY pada ‘16E.
Maintain BUY. Didukung oleh: (1). Optimisme penguatan nilai tukar Rupiah yang
masih terus berjalan sampai akhir tahun ini, seiring dengan harapan membaiknya makroekonomi Indonesia, (2). Daya beli yang lebih kuat, ditopang oleh turunnya harga BBM dan melandainya tingkat inflasi, (3). Neraca keuangan yang sehat dengan likuiditas yang baik (zero debt, cash rich company), (4) Ekuitas brand yang kuat sebagai pemimpin pasar pada industri susu dan minuman dalam kemasan, kami optimis terhadap ULTJ, dengan mempertahankan BUY pada TP5,000/lembar saham. Namun, kekhawatiran kami terletak pada : (1) Meningkatnya persaingan dalam industri (2) Wabah penyakit terhadap sapi (3). Likuiditas saham.
Target Price Rp 5,000 Last Price Rp 4,170 Potential Upside 19.9% JCI Index 4,771 Share isued (bn) 2.89 Market Cap. (Rp tn) 12.04 52-Weeks High/Low 3,460/4,270
Avg Daily Vol (m n) 0.12
Free Float 52.7%
Nom inal Value Rp 200
Book value/share ‘16 Rp1,167
Relative to JCI Chart
Com pany Background
Shareholder Structure
PT Praw iraw idjaja Prakarsa 21%
Sabana Praw iraw idjaja 15%
Indolife Pensiontama 8%
PT AJ Central Asia Raya 8%
Public 45%
BUY (Maintain)
PT Ultrajaya Milk Industry and Trading Company operates in the food and beverage industry. The Company produces aseptic drinks such as liquid milk andtea, fruit juices and health drinks. Ultrajaya also produces butter, pow der milk and sw eet condensed milk. 90 100 110 120 130 140
Sep-15 Dec-15 Mar-16
JCI ULTJ
Marlene Tanumihardja
+62 21 2854 8387
Forecast and Valuation (at closing price Rp4,170 per share)
Y/E Dec (Rpbn) 14A 15E 16E 17E
Sales 3,917 4,394 5,053 5,912 EBITDA 470 804 980 1,153 Net Profit 292 523 632 757 EPS (Rp/shr) 101 181 219 262 Dividend Yield (%) 0.3 0.3 0.5 0.6 BV per share (Rp/shr) 698 784 968 1,167 EV/EBITDA (x) 17.7 21.7 12.3 9.8 P/E Ratio (x) 36.6 20.4 16.9 14.1 P/BV Ratio (x) 4.7 3.8 3.2 2.6
Ultrajaya Milk Industry
ULTJ.IJ / ULTJ.JK
Figure 1. Indonesia Inflation Rate
Source: Bloomberg
Figure 2. Exchange Rate Movement
Source: Bloomberg
Figure 3. Milk Consumption per Capita (Liters/Person/Year) 0.0 1.0 2.0 3.0 4.0 5.0 6.0 7.0 8.0 9.0 (% ) 12,000 12,500 13,000 13,500 14,000 14,500 15,000
Apr-15 Jul-15 Oct-15 Jan-16 Apr-16
R p/ U SD
13.4
22.1
33.7
50.9
0.0
10.0
20.0
30.0
40.0
50.0
60.0
www.samuel.co.id Page 3 of 7
Ultrajaya Milk Industry
ULTJ.IJ / ULTJ.JK
Figure 4. White Milk Powder and Skimmed Milk Powder Price (US$/MT)
Source: Global Dairy Trade, Trading Event Historical Data, Bloomberg
Figure 5. Avg. milk powder prices for US$/ton and Rupiah/kg Aug’11 – Apr’16
Source: Global Dairy Trade, USDA, Bloomberg, SSI Research
Figure 6. Revenue growth, est. production growth, net margin 2009 – 2017E
Source: Company data, USDA, Global Dairy Trade, Bloomberg, SSI estimates
0 1,000 2,000 3,000 4,000 5,000 6,000 M ay -11 A ug us t-11 N o ve m be r-11 F eb ru ar y-12 M ay -12 A ug us t-12 N o ve m be r-12 F eb ru ar y-13 M ay -13 A ug us t-13 N o ve m be r-13 F eb ru ar y-14 M ay -14 A ug us t-14 N o ve m be r-14 F eb ru ar y-15 M ay -15 A ug us t-15 N o ve m be r-15 F eb ru ar y-16 WMP SMP -1,000 2,000 3,000 4,000 5,000 6,000 0 10,000 20,000 30,000 40,000 50,000 60,000 U SD /M T R p / K g
Avg. milk powder cost Rp/kg (RHS) Milk Powder Cost (LHS)
0.0% 5.0% 10.0% 15.0% 20.0% 25.0% 30.0% 35.0%
2009 2010 2011 2012 2013 2014 2015E 2016E 2017E
Ultrajaya Milk Industry
ULTJ.IJ / ULTJ.JK
Figure 8. Avg. milk powder cost (Rp/kg) vs gross margin ‘16E
Source: Company data, USDA, Global Dairy Trading, Bloomberg, SSI Research
Figure 9. Indonesia consumer valuation table as of close May 3, 2016 (Excluding UNVR)
Source: SSI estimates, Bloomberg (*Excl. UNVR, except for PE ratio & EPS CAGR)
0.0% 5.0% 10.0% 15.0% 20.0% 25.0% 30.0% 35.0% 0 5,000 10,000 15,000 20,000 25,000 30,000 35,000 40,000 45,000 50,000 2012 2013 2014 2015 2016F
Gross Profit Margin Average Milk Powder Cost (Rp/Kg)
Company Last Target
price price 15A 16E 15A 16E 15A 16E
Consumer - related:
Kalbe Farma (KLBF IJ) 1,335 1,610 31.1 28.4 5.9 5.2 18.5% 19.4% Indofood CBP (ICBP IJ) 15,225 16,500 29.3 28.0 5.7 5.1 19.4% 19.7% Indofood SM (INDF IJ) 7,100 8,000 22.7 18.7 2.3 2.1 10.9% 12.6% Ultrajaya Milk (ULTJ IJ) 4,170 5,000 20.4 16.9 3.8 3.2 18.8% 18.6% Nippon Indosari Co. (ROTI IJ) 1,430 1,670 23.8 30.3 5.2 4.4 17.9% 20.8% Unilever Indonesia (UNVR IJ) 42,850 39,000 59.2 52.9 73.6 64.3 121.5% 119.1%
Average (Non UNVR) 25.5 24.5 4.6 4.0 17.1% 18.2%
Poultry - related:
Charoen Pokphand Indonesia* 3,720 3,500 28.7 21.5 4.6 4.0 16.9% 19.1% Japfa Comfeed Indonesia 925 1,150 21.0 12.3 1.8 1.5 11.0% 11.0% Malindo Feedmill 1,380 1,420 (36.3) 16.4 1.3 1.2 8.0% 12.3%
Average 4.5 16.7 2.6 2.2 12.0% 14.1%
*Bloomb erg consensus
www.samuel.co.id Page 5 of 7
Ultrajaya Milk Industry
ULTJ.IJ / ULTJ.JK
Figure 10. ULTJ’s forward PE Band
Source: SSI estimates, Bloomberg
Figure 11. Quarterly Performance
Source: Company, SSI estimates,Bloomberg
22.2 33.3 11.1 44.5 -0.1 -10 0 10 20 30 40 50
Jan-11 Jul-11 Jan-12 Jul-12 Jan-13 Jul-13 Jan-14 Jul-14 Jan-15 Jul-15
Average ST dev +1 ST dev -1
PER - Roll ST dev +2 ST dev -2
(in Rpbn) 4Q15 1Q16 QoQ 1Q15 1Q16 YoY 1Q16/'16E 1Q16/'16Cons
Revenue 1,119 1,097 -2.0% 1034 1097 6.1% 21.6% N/A
COGS (760) (750) -1.3% (699) (750) 7.3%
Gross Profit 359 347 -3.3% 335 347 3.6%
Total Operating Exp. (189) (151) -20.3% (152) (151) -0.7%
Operating Profit 170 196 15.5% 183 196 7.1% 28.1% N/A
Other Income - Net 69 19 -72.2% 10 19 95.8%
Net interest income (expense) (10) 11 N/A 5 11 115.1%
Share of net income associated (14) 0 N/A 2 0 -74.7%
Other income (expense) 93 7 -92.2% 3 7 169.0%
Pre-tax Income 239 215 -9.7% 193 215 11.6%
Tax (expense) (116) (49) -57.8% (45) (49) 9.6%
Minority interest 8 3 -65.3% 2 3 8.3%
Ultrajaya Milk Industry
ULTJ.IJ / ULTJ.JK
Key Financials
Recommendation History – Ultrajaya Milk Industry (ULTJ)
Rpbn 14A 15A 16E 17E Rpbn 14A 15A 16E 17E
Revenue 3,917 4,394 5,053 5,912 Net Income 292 523 632 757
COGS (2,980) (3,011) (3,434) (4,036) Depreciation & amortization 139 146 170 199
Gross profit 937 1,383 1,619 1,876 Working capital (315) (33) 21 (52)
Gross margin (%) 23.9 31.5 32.0 31.7 Operating cash flow 116 664 823 903
Operating profit 327 658 810 954 Net - Capital expenditure (177) (300) (401) (450)
Operating margin (%) 8.4 15.0 16.0 16.1 Other assets 8 (4) (104) (122)
EBITDA 470 804 980 1,153 Investing cash flow (168) (305) (505) (572)
EBITDA margin (%) 12.0 18.3 19.4 19.5 Net - Borrow ings (29) 22 (22) (6)
Other income (expenses) 48 43 46 68 Other financing (41) (21) (60) (63)
Pre-tax profit 376 701 856 1022 Financing cash flow (70) 1 (82) (69)
Income tax - net (92) (178) (214) (256) Net - Cash flow (122) 360 236 262
Net profit 292 523 632 757 Cash at beginning 611 489 849 1,085
Net profit margin (%) 7.4 11.9 12.5 12.8 Cash at ending 489 849 1,085 1,347
Yr-end Dec (Rpbn) 14A 15A 16E 17E Yr-end Dec 14A 15A 16E 17E
Cash & ST investment 489 849 1,085 1,347 ROE (%) 12.9 18.7 18.8 18.6
Receivables 407 464 519 606 ROA (%) 10.0 14.8 15.1 15.4
Inventories 714 761 777 788 Revenue grow th (%) 13.2 12.2 15.0 17.0
Others 31 29 32 35 EBITDA grow th (%) (18.2) 71.1 21.9 17.6
Total current assets 1,642 2,103 2,414 2,777 EPS grow th (%) -10.3 79.3 20.9 19.7
Net fixed assets 1,003 1,160 1,391 1,642 Interest coverage (x) n/a n/a n/a n/a
Other assets 272 276 380 501 Debt to equity (%) 1.1 1.0 0.6 0.6
Total assets 2,917 3,539 4,185 4,920 Net gearing (%) -17.8% -25.8% -29.4% -31.2%
Payables 385 367 459 493
ST. debt and curr. maturity 25 27 21 24
Other current liabilities 81 167 170 185 Major Assumptions
LT. debt 0 0 0 0 Yr-end Dec 14A 15A 16E 17E
Other long term liabilities 101 81 90 101 ASP grow th est (%) 10.0 3.0 0.0 1.0
Total liabilities 652 742 815 858 Average Rupiah/US$ 11,885 13,500 13,000 12,500
Total equity 2,265 2,797 3,369 4,063 Milk pow der cost (US$/ton) 3,547 2,588 2,328 2,104
Profit and Loss Statement
Balance Sheet
Cash Flow
Key Ratios
Date Recommendation Close Price Target
17-Feb-16 Buy 3,700 4,800 Year Book Buy 3,950 4,800 6-Aug-15 Buy 3,900 4,800 12-May-15 Buy 4,030 4,800 9-Apr-15 Hold 3,995 4,000 7-Nov-14 Buy 3,800 4,525 4-Jul-14 Buy 4,005 4,470 17-Apr-14 Buy 4,040 5,300 21-Jan-14 Buy 4,475 5,300