ANALYSIS AND DESIGN
4.1 Analysis
Illustration 4.1: System Flowchart
System flowchart describes work of the system in general. In prepocessing data is calculating training data to get mean, standard deviation and probability in each weather condition. On Classification stage, training data then tested with testing data to gain classification result. The last stage is calculating accuracy,precision and recall using Confusion Matrix.
Start
Training Data Preprocessing
Data Classification using Naive Bayes
Accuracy, precision, and recall calculation
using Confussion Matrix
Illustration 4.2: Training Data Preprocessing
Training Data Processing starts with loading training data CSV file then calculate mean, standard deviation and probability of each condition. At the end of the process, the result of calculation is stored into a new CSV file.
Start
Load dataTraining.csv
Calculate mean
Save calculation result into
PengolahanDataTraining.csv
End
Calculate standard deviation
Illustration 4.3: Testing Data Classification Process with Gaussian Distribution
In this stage, the testing data is calculated using Gauss Distribution formula to gain weather classification. The calculation result is affected by result of data training process.
Start
Load
dataTestingRandom.csv
End Load
PengolahanTrainingData.csv
Perform gaussian distribution to each data
Classification result
Save to
ClassificationResult.csv
Illustration 4.4: Calculate System Accuracy, Precision, and Recall
To get accuracy rate, system matches data on system classification result with actual data in testing data. The result of matching process are recorded into matrix then calculate the accuracy, precision, and recall with Confusion Matrix.
4.2 Design
In this project, the first step is load training data. From load training data then processing the data with Naive Bayes Classification and Confusion Matrix. Based on those process then gained the result of classification and
accuracy,precision and recall. Below is the design system of this project : Start
End Perform Confussion Matrix
calculation
Load
dataTestingRandom.csv
Accuracy, Precison, and Recall rate
Load
1. Load training data csv file
2. Process training data (dataTraining.csv) by calculating each weather condition attribute using Mean, Standard Deviation and Probability formula.
Mean formula :
mean=
∑
Xi nWhere :
∑ Xi = sum all of data
n = numbers of data
Standard Deviation formula :
s=
√
∑
(xi−x)2
n−1
Where :
s = Standard Deviation xi = value of each data
¯x = mean
n = numbers of data
Probability Formula :
P(A)=x
n
Where :
Table 4.1: Sample Data Training
Temperature Humadity Pressure Weather Condition
27 84 1010 Haze
28 89 1010 Haze
26 89 1011 Clear
29 94 1012 Partly Cloudy
25 93 1012 Clear
25 87 1013 Haze
24 85 1011 Clear
27 94 1010 Partly Cloudy
28 84 1009 Clear
28 89 1010 Haze
Calculation step in each weather condition :
• Haze :
Mean Temperature : 27+28+25+28
4 =27
Mean Humadity : 84+89+87+89
4 =87.25 Mean Pressure : 1010+1010+1013+1010
4 =1010.75
Standard Deviation Temperature :
√
(27−27)2+(28−27)2+(25−27)2+(28−27)24−1 =1.414
Standard Deviation Humadity :
√
(84−87.25)2+(89−87.25)2+(87−87.25)2+(89−87.25)24−1 =2.363
Standard Deviation Pressure :
√
(1010−1010.75)2+(1010−1010.75)2+(1013−1010.75)2+(1010−1010.75)2Haze Probability : 4
Standard Deviation Temperature :
√
(26−25.75)2+(25−25.75)2+(24−25.75)2+(28−25.75)24−1 =1.708
Standard Deviation Humadity :
√
(89−87.75)2+(93−87.75)2
+(85−87.75)2
+(84−87.75)2
4−1 =3.562
Standard Deviation Pressure :
√
(1011−1010.75)2+(1012−1010.75)2+(1011−1010.75)2+(1009−1010.75)24−1 =1.258
Clear Probability : 4 10=0.4
• Partly Cloudy :
Mean Temperature : 29+27 2 =28 Mean Humadity : 94+94
2 =94 Mean Pressure : 1012+1010
2 =1011 Standard Deviation Temperature :
√
(29−28)2
Standard Deviation Humadity :
√
(94−94)2
+(94−94)2
2−1 =0 Standard Deviation Pressure :
√
(1012−1011)2
+(1010−1011)2
2−1 =1
Partly Cloudy Probability : 2 10=0.2
After calculating process on training data, the result from those process is save into new csv file (pengolahanDataTraining.csv) for to be used in the next step.
3. Process of testing data (dataTestingRandom.csv) :
A) Calculate each testing data with gaussian distribution formula till gain classification by the system.
Gauss Distribution Formula :
P(Xi=xi∣Y=yj)= 1
p = probability Xi = attribute to i xi = value attribute to I
Y = searched class Yj = searched sub class Y
μ = mean from all attribute
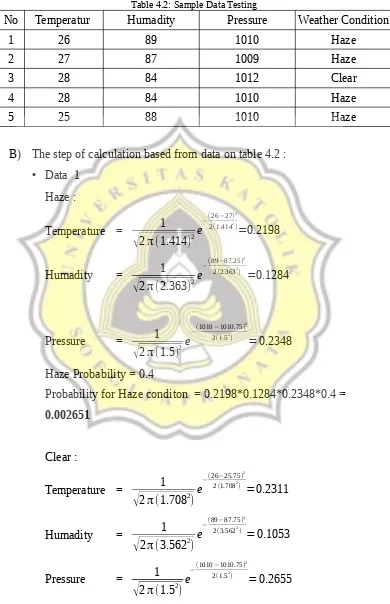
Table 4.2: Sample Data Testing
No Temperatur Humadity Pressure Weather Condition
1 26 89 1010 Haze
2 27 87 1009 Haze
3 28 84 1012 Clear
4 28 84 1010 Haze
5 25 88 1010 Haze
B) The step of calculation based from data on table 4.2 :
• Data 1 Haze :
Temperature = 1
√
2π (1.414)2Humadity = 1
√
2π (2.363)2e−(89−87.25) 2
2(2.3632) =0.1284
Pressure = 1
√
2π (1.5)2Haze Probability = 0.4
Probability for Haze conditon = 0.2198*0.1284*0.2348*0.4 = 0.002651
Clear :
Temperature = 1
√
2π (1.7082)e−(26−25.75) 2
2(1.7082) =
0.2311
Humadity = 1
Probability Clear = 0.4
Probability for Clear condition = 0.2311*0.1053*0.2655*0.4 = 0.002584
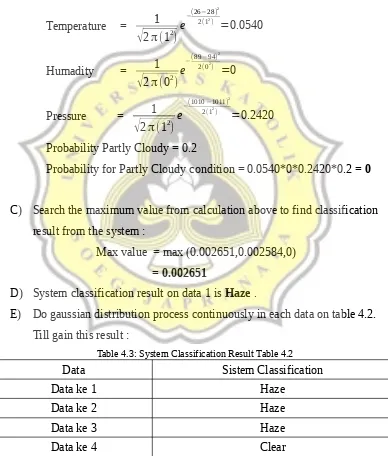
Partly Cloudy :
Temperature = 1
Probability Partly Cloudy = 0.2
Probability for Partly Cloudy condition = 0.0540*0*0.2420*0.2 = 0
C) Search the maximum value from calculation above to find classification result from the system :
Max value = max (0.002651,0.002584,0) = 0.002651
D) System classification result on data 1 is Haze .
E) Do gaussian distribution process continuously in each data on table 4.2. Till gain this result :
Table 4.3: System Classification Result Table 4.2
Data Sistem Classification
Data ke 1 Haze
Data ke 2 Haze
Data ke 3 Haze
Data ke 4 Clear
F) System will automatically store the final result of weather classification into new CSV file with name ClassificationResult.csv.
4. Processing data ClassificationResult.csv using Confusion Matrix method to find accuracy,precision, and recall from the system. Here is the process of confusion matrix method :
A) Compare the weather classification result from data in
ClassificationResult.csv with data in dataTestingRandom.csv then record into 2 dimension matrix. With this following condition :
• Comparing process :
Table 4.4: Example of comparing process
dataTesting.csv ClassificationResult.csv
Haze Haze
…. ….
Haze Clear
• Recording process into confusion matrix :
Table 4.5: Example of recording process into confusion matrix dataTesting.csv
ClassificationResult.csv
Haze Clear Partly Cloudy
Haze +1 +1 ...
Clear ... ... ...
Partly Cloudy ... ... ...
• The final result from confusion matrix process based on data in table 4.2 and table 4.3 :
Table 4.6: Final Result of confusion matrix process based on Table 4.2 and Table 4.3 dataTesting.csv
ClassificationResult.csv
Haze Clear Partly Cloudy Total
Haze 2 2 0 4
Clear 1 0 0 1
3 2 0
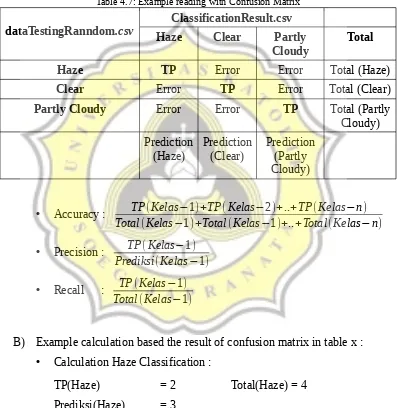
5. Based from confusion matrix calculation above then perform calculation of accuration, precision and recall for each of result classification used this formula :
A) Example reading with confusion matrix :
Table 4.7: Example reading with Confusion Matrix dataTestingRanndom.csv
ClassificationResult.csv
Haze Clear Partly
Cloudy
Total
Haze TP Error Error Total (Haze)
Clear Error TP Error Total (Clear)
Partly Cloudy Error Error TP Total (Partly
Cloudy)
B) Example calculation based the result of confusion matrix in table x :
• Calculation Haze Classification :
TP(Haze) = 2 Total(Haze) = 4 Prediksi(Haze) = 3
Precision= 2
3 = 0,67 * 100% = 67% Recall = 2
• Calculation Clear Classification :
TP(Clear) = 0 Total(Clear) = 0 Prediksi(Clear) = 0
Precision= 0
2 = 0 * 100% = 0% Recall = 0
1 = 0 * 100% = 0%
• Calculation Partly Cloudy Classification :
TP(Partly Cloudy) = 0 Total(Partly Cloudy) = 1 Prediksi(Partly Cloudy) = 2
Precision= 0
0 = undefined Recall = 0
0 = undefined
• Calculation sistem accuracy
Accuracy = TP(Haze)+TP(Clear)+TP(Partly Cloudy) Total(Haze)+Total(Clear)+Total(Partly Cloudy)
= 2+0+0 4+1+0 = 2
5