Forecasting System Approach for Stock Trading
with Relative Strength Index and
Moving Average Indicator
Yulius Hari
1, Lily Puspa Dewi
21Informatics Department, Widya Kartika University, Indonesia. 2Informatics Department, Petra Christian University, Indonesia.
Abstract—Stock is one of the investment instruments on the capital markets which provide high returns. Furthermore, Indonesian government also supports to raise awareness on investing in stock market through the national movement “to love stock market”. Apart from that, a lot of people want to invest their money in stocks hoping to get a big return in instant, however many of them suffered losses, and the intention to gain their money is not achieved. Lack of knowledge such as “high return means high risk”, is often forgotten by community. Therefore in order to increase the interest of the community to develop their money in stocks, ability to analyze on stock transactions is deeply needed. This can be achieved by using indicators as tools for analyzing the stock transaction. Departing from the elaborated issue, this research is expected to help the community in analyzing the stock, to know when the time to buy and when the time to sell. This forecasting system will provide an advice to stock investors and stock traders to pay attention to indicators: relative strength index and moving average. In conclusion the result of this research can help the investor to determine the right time to buy and sell. However, this system cannot predict very exact time and cannot became a standard for profitability, because the volatility of stock price.
Index Terms—Decision Support System; Forecasting; Moving Average; Relative Strength Index.
I. INTRODUCTION
Recently, the world of investment and trading is growing quite widespread in Indonesia. The penetration goes along with many programs from BEI (Indonesia Stock Exchange), OJK (Financial Services Authority), financial planners, and Securities who helping the education of the public about the capital market in Indonesia [1]. Today, there are more and more people engage in foreign exchange (forex), stocks, commodities, indexes, mutual funds, balance sheets, or others, either as the main job or just at an additional earning. A successful rate of return can be multiplied if someone has the ability to make it. Because of this requirement, not everyone can get their maximum benefit [2]. One reason of this failure is the lack of information about the issuer's results, they just follow their feelings which usually give losses as the result. If you could analyze it before transactions, then it might bring different results. There ara two important analyzing tools, namely fundamental analysis for investors, and technical analysis for traders [3].
To sum up, there are many financial instruments that exist in Indonesia, namely financial instruments which support the Indonesian society. With those instruments, anybody with the ability of advanced in technology, such as investors and stock
traders can transact through mobile devices [4]. Therefore it is necessary to create a forecasting system that can project the rise and fall in prices for investors and stock traders to support the decision [5]. Moving Average (MA) and Relative Strength Index (RSI) are very popular indicators among traders or stock investors, with indicators of impairment [6]. Moving Average shows the down and up of the price, which can be filtered by oscillator indicator through Relative Strength Index (RSI) that gives result of overbought or oversold [2].
As a conclusion of this research, the purpose of the system development is to produce an application that can assist in analyzing trends in price movement and give recommendation which stock is tradable [7]. So it is expected to help traders and investor to obtain information and recommendation related to these stocks as the main goals in this system. The main contribution in this research is to give indicator for the trader when is the right time to buy or to sell using the combination indicator variables from RSI and MA. Furthermore based on Agrawal [8], the forecasting system can reduce the risk of the trader and maximize the given potential.
II. LITERATURE STUDY
A. Relative Strength Index
Relative Strength Index (RSI) is an oscillator used in technical analysis to show price strength by comparing the movement of increasing and decreasing of price [6]. The Relative Strength Index (RSI) is a momentum indicator developed by analyst Welles Wilder, which compares the magnitude of recent gains and losses over a specified time period to measure speed and change of price movements of a stock. It is primarily used to attempt and identify the overbought or oversold conditions in the trading of a stock.
RSI calculations can be translated by doing daily calculations of a change in price. If the price increase the symbol "U" is used, and if the price is decrease then the symbol "D" is used to describe it. For example in a day, when the closing price is higher than the price yesterday, the symbol “U” will be used. Or vice versa on the day that the price drops, the letter “D” is used. (note: D is a positive value). Equation (1) represents the U formula.
If today's closing price is equal to yesterday's closing price, the U and D values are zero. The average value of U is calculated based on the Exponential Moving Average (EMA) or the average movement exponent by using the N-day factor. This principle is also applied for calculating the average of the D value. The ratio of the mean value is Relative Strength (RS) can be seen in Equation (2).
𝑅𝑆 = 𝐸𝑀𝐴[𝑁]𝑓𝑟𝑜𝑚 𝑈𝐸𝑀𝐴[𝑁]𝑓𝑟𝑜𝑚 𝐷 (2)
Then RS converted to RSI values between 0 and 100, this formula is represented in Equation (3).
𝑅𝑆𝐼 = 100 𝑥 (𝐸𝑀𝐴[𝑁]𝑓𝑟𝑜𝑚 𝑈) + (𝐸𝑀𝐴[𝑁]𝑓𝑟𝑜𝑚 𝐷)𝐸𝑀𝐴[𝑁]𝑓𝑟𝑜𝑚 𝑈
(3)
In theory, EMA or U uses unlimited value from past data as shown in Equation (4).
(4)
Figure 1 shows the Relative Strength Index (RSI) and stock price historical data. The RSI show the indication when is the right time to make transaction.
Figure 1: Relative Strength Index Indicator
Wilder and Chong argues that securities are said to be an excess of buying when the RSI Indicator reaches a value of 70, meaning that speculators should consider selling. Or vice versa on the condition of excess selling at which the RSI Indicators shows the value of 30 [9]. The principle is that if there is a high proportion of daily value movements in one direction it shows an extreme sign, and the price will likely reverse direction. 80 and 20 values are usually used as well as an alternative variation, depending on market conditions such as "bullish" or "bearish" (falling market). To calculate RSI 14, it takes the last 15 days data. Table 1 shows stock price on BBRI stock information then calculate RSI 14.
After finding the difference, then averaging the increase and decrease by dividing 14, then look for the value of RSI 14 as follows:
Date Close Differences 23/07/2015 10250 - frequently used in technical analysis. Moving Average gives the average value of the price change to provide more easily captured information for the purpose of analysis and anticipate trends [10]. A rising trend can be said to have occurred when the price moved above the MA, and down when the price moved below the MA.
Simple Moving Average (SMA) is calculated by taking the average value of the price within a certain time range [2]. The calculation of SMA can be taken from the average value of opening price, closing price, the highest price and also the lowest price, but most value from SMA is taken from the closing price. Suppose a SMA value for 5 days stock market is taken from 5 closing prices in the last 5 days divided by 5 so that the value of SMA can be illustrated as (10 + 11 + 12 + 13 + 14) / 5 = 60 / 5 = 12. The calculations will continue for the following days. For example on day 6, the average value of closing price is 15 then the value on the earliest day, i.e. 10, is omitted and the calculation formulation becomes as (11 + 12 + 13 + 14 + 15) / 5 = 65 / 5 = 13. SMA is an indicator that follows the trend. SMA is good to use when price moves in trend. When prices do not move in trend then this SMA indicator can give wrong signal for forecast of price movement.
C. Premise using Moving Average indicator and Relative Strength Index
a. Moving Average
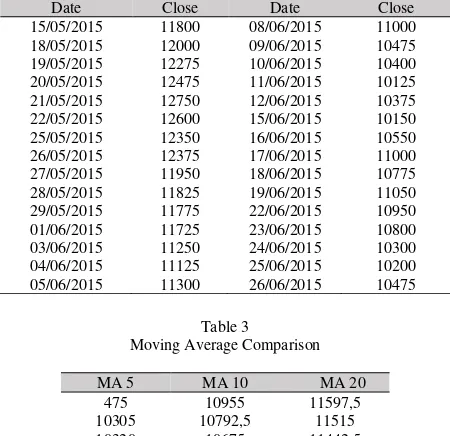
Moving Average is widely used to analyze the trend of stock price movements, there are some periods such as 5 days, 10 days, and 20 days. In this research a period of 10 days is used because it is closer to the accuracy. Table 2 represents data history of BBRI stock price.
Table 3 represent the calculation using Moving Average using the period of 5 days, 10 days, 20 days to project the price on the next day. From Table 3 can be concluded that Moving Average of 10 days is closer to the price tomorrow than others.
Table 2
BBRI stock price history data
Date Close Date Close
15/05/2015 11800 08/06/2015 11000 18/05/2015 12000 09/06/2015 10475 19/05/2015 12275 10/06/2015 10400 20/05/2015 12475 11/06/2015 10125 21/05/2015 12750 12/06/2015 10375 22/05/2015 12600 15/06/2015 10150 25/05/2015 12350 16/06/2015 10550 26/05/2015 12375 17/06/2015 11000 27/05/2015 11950 18/06/2015 10775 28/05/2015 11825 19/06/2015 11050 29/05/2015 11775 22/06/2015 10950 01/06/2015 11725 23/06/2015 10800 03/06/2015 11250 24/06/2015 10300 04/06/2015 11125 25/06/2015 10200 05/06/2015 11300 26/06/2015 10475
Table 3
Moving Average Comparison
MA 5 MA 10 MA 20
475 10955 11597,5 10305 10792,5 11515 10320 10675 11442,5 10440 10650 11378,75 10570 10615 11293,75 10705 10590 11208,75 10865 10585 11126,25 10915 10617,5 11048,75 10775 10607,5 10945 10660 10615 10857,5
b. Relative Strength Index (RSI)
Relative Strength Index (RSI) is an indicator that measures the strength of stock prices. Figure 2 explains how RSI detects the fluctuation of Bank Rakyat Indonesia (BRI) share price.
Figure 2: Bank Rakyat Indonesia (BRI) Stock Price Chart with RSI Indicator
Moving Average is more accurate than volume based indicator as seen in Figure 3. It is marked with the greater the volume, then the trend of stock price’s hike would be more to happen, but the fact indicates the price actually fell. On the other hand, the Moving Average's prediction is more accurate in detecting the trend of stock price movements.
Figure 3: Comparison between MA and Volume Based
RSI and Money Flow Index are oscillator type indicators that detect oversold and overbought condition. In Figure 4 it explained that the stock of Bank Rakyat Indonesia (BRI) is very volatile. It is concluded that RSI is suitable to the volatility of stock movement against Money Flow Index. This result is in accordance with the research conducted by Chong and Leung [9, 3].
Figure 4: Comparison between RSI and Money Flow Index
III. SYSTEM DESIGN
Basically this system is taking data from the website which provide latest stock data such as Bloomberg and Yahoo Finance. Then find the historical data of stock prices which are sought and processed. Further detail about the system design is represented in Figure 5 and can be explained as follow:
1. Trader input the stock code which want to process. The stock code must be listed in BEI (Indonesia Stock Exchange)
2. The keywords will then be used to search the historical data of stock prices on Yahoo Finance and Bloomberg. This mechanism is using web scraping technique to retrieve the data.
3. After the historical data stock prices are found, then they will be processed in accordance with indicators MA10 (Moving Average) and RSI14 (Relative Strength Index).
Figure 5: System Design Scheme
IV. RESULT AND DISCUSSION
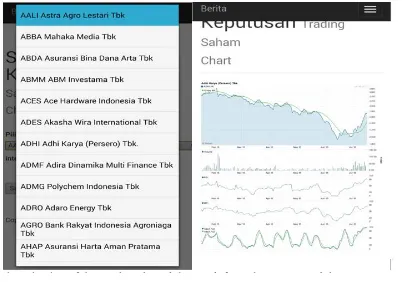
The system is analyzed and tested using internal and external evaluation. The internal evaluation is based on the internal trial of the system using functionality testing [13]. The internal evaluation gives a result showing that the system is able to run as expected. The result is shown as screenshot on Figure 6.
Figure 6: The Selection of the Stock Code and the Result from the System and the Recommendation
Based on the functionality testing, the system can be used thoroughly and is able to run and shows the result as expected. The data is able to be retrieved from both of data’s server Bloomberg and Yahoo Finance.
Therefore, from the result of the study, the system can help to indicate the correct time to buy, sell, overbuy (the market is pushes the prices of the asset to reach its upper bounds), oversold (the market is push the prices of the asset to reach its lower bounds) and neutral. Those output of recommendations are calculated, based on the variable indicator MA and RSI.
The second evaluation test was performed by distributing questionnaires to respondents as users. This questionnaire has 5 main questions about this application, and then distributed to user which already became a trader in stock market. The questionnaire was built using the Likert scale with the reference from the research conducted by H.V. Laerhoven [14] with the lowest score of 1 and the highest 5. A summary of the results of this questionnaire can be seen in Table 4.
Table 4
Summary result of the user questionnaire
Evaluated Aspect
4. User interaction of the system 3.75
5. Can help to give a guidelines based on
recommendation 3.85
Description: 5. Very Good – 1. Poor
The scores in Table 4 represent the value of each aspect and are used for evaluation. In point number 1, the ease of use in using the apps is scored 3.85, so it can be concluded that the interaction and ease of use on the system is considered good enough, referring to the Likerts [14] scale assessment that determine the meaning of range is 1 for the lowest score and 5 for the highest score. Based on the above overall score, the system is able to support the trader on giving a guidelines or application’s recommendation.
The accuracy of the system has not been thoroughly tested, due to time’s constraint. But from the simulation results using data from BBRI stock code for 90 days, it can be concluded that the system accuracy is 76.7%. This number is calculated by seeing the evident of the correct predictions, which is 69 events, compared to the amount of data in 90 days, which is 90 data in total. The system can also analyze the historical data price at the selected time interval. However, the time interval can also affect the result of the prediction, especially the moving average result. In any case this phenomenon is in accordance to the research done by Agrawal [8], Gunasekarage [11], Appel [12], Brännäs [15], and Egeli [16], about the relativity of the given prediction result.
The result of this study shows in general, that the using of artificial intelligence methods can help to predict better result rather than the using of traditional methods indicator. This result is in line with the research conducted by K.Aghakhani [17].
V. CONCLUSION
The research can be concluded as follows; the system helps to indicate the time to buy, sell, overbuy, oversold and neutral. Thus, it can help the investor to reflect and prove the decision making. Furthermore the system can help to analyze the historical price data at the selected time interval. The time interval can also affect the result of the prediction, especially the moving average result. Based on the user experience survey, the ease of use in the system is acceptable. Lastly, the system cannot determine the loss or profit, thus this system can only indicate the right time to buy or sell, but all the decision is up to the user.
REFERENCES
[1] T.A. Napitupulu and Y.B. Wijaya, “Prediction of stock price using artificial neural network: a case of Indonesia.,” Journal of Theoretical & Applied Information Technology, vol. 54 no.1, pp. 104-108. 2013. [2] A. Rahmadhani, M. Mandela, T. Paul, and S. Viridi, “Prediksi
pergerakan kurva harga saham dengan metode simple moving average menggunakan C++ dan Qt Creator,” in Prosiding Seminar Kontribusi Fisika, Bandung-Indonesia, December 2011, pp.178-185.
[3] M.T. Leung, H. Daouk, and A.-S. Chen, “Forecasting stock indices: a comparison of classification and level estimation models,” International Journal of Forecasting, vol. 16 no. 2, pp. 173-190. 2000. [4] R. C. Cavalcante and A. L. I. Oliveira, “An autonomous trader agent for the stock market based on online sequential extreme learning machine ensemble,” in 2014 International Joint Conference on Neural Networks (IJCNN), Beijing, July 2014, pp. 1424-1431.
[5] S.S. Lam, “A genetic fuzzy expert system for stock market timing,” in Proceedings of the 2001 Congress on Evolutionary Computation, Seoul, May 2001, pp. 410-415.
[6] R.A. Levy, “Relative strength as a criterion for investment selection,” The Journal of Finance, vol. 22 no.4, pp. 595-610. 1967.
[7] L.A. Teixeira, and A.L.I. De Oliveira, “A method for automatic stock trading combining technical analysis and nearest neighbor classification,”Expert systems with Applications, vol. 37 no. 10, pp. 6885-6890, 2010.
inference system (anfis). In Proceedings of the International MultiConference of Engineers and Computer Scientists (Vol. 1). [9] T. T.-L. Chong and W.-K. Ng, “Technical analysis and the London
stock exchange: testing the MACD and RSI rules using the FT30,” Journal of Applied Economics Letters, vol. 15 no. 14, pp. 1111-1114. 2008.
[10] P.-C. Chang and C.-H. Liu, “A TSK type fuzzy rule based system for stock price prediction,”Expert systems with Applications, vol. 34 no.1, pp. 135-144. 2008.
[11] Gunasekarage, A., & Power, D. M. (2001). The profitability of moving average trading rules in South Asian stock markets. Emerging Markets Review, 2(1), 17-33.
[12] Appel, G. (2003). Become Your Own Technical Analyst: How to Identify Significant Market Turning Points Using the Moving Average Convergence-Divergence Indicator or MACD. The Journal of Wealth Management, 6(1), 27-36.
[13] Hari, Y. Darmanto, P.D., Lily (2014). Customer Mapping for Cable TV Industries in Indonesia Rural Area Using GIS. Jurnal Teknologi – University Teknologi Malaysia vol.72 no.4.
[14] H.V. Laerhoven, Zaag‐Loonen, and B.H. Derkx, “A comparison of Likert scale and visual analogue scales as response options in children's
questionnaires,”Acta paediatrica, vol. 93 no. 6, pp. 830-835. 2004. [15] Brännäs, K., & Shahiduzzaman Quoreshi, A. M. M. (2010).
Integer-valued moving average modelling of the number of transactions in stocks. Applied Financial Economics, 20(18), 1429-1440.
[16] B. Egeli, M. Ozturan and B. Badur, “Stock market prediction using artificial neural networks,” inProc. 3rd International Conference on Business, Hawaii, June 2003, pp. 1-8.