One Microsoft Way
Redmond, Washington 98052-6399
Copyright © 2004 by Microsoft Corporation
All rights reserved. No part of the contents of this book may be reproduced or transmitted in any form or by any means without the written permission of the publisher.
Library of Congress Cataloging-in-Publication Data Frye, Curtis, 1968-
Microsoft Office Excel 2003 Programming Inside Out / Curtis Frye, Wayne S. Freeze, Felicia K. Buckingham.
p. cm. Includes index. ISBN 0-7356-1985-9
1. Microsoft Excel (Computer file) 2. Business--Computer programs. 3. Electronic spreadsheets. I. Title.
HF5548.4.M523F792 2003
005.54--dc22 2003064850
Printed and bound in the United States of America. 1 2 3 4 5 6 7 8 9 QWT 8 7 6 5 4 3 Distributed in Canada by H.B. Fenn and Company Ltd.
A CIP catalogue record for this book is available from the British Library.
Microsoft Press books are available through booksellers and distributors worldwide. For further information about international editions, contact your local Microsoft Corporation office or contact Microsoft Press International directly at fax (425) 936-7329. Visit our Web site at www.microsoft.com/mspress. Send comments to [email protected].
ActiveX, BizTalk, DirectX, FrontPage, Hotmail, IntelliSense, MapPoint, Microsoft, Microsoft Press, MSDN, MSN, Outlook, PivotChart, PivotTable, PowerPoint, SharePoint, Tahoma, Visio, Visual Basic, Visual C++, Visual C#, Visual Studio, Windows, the Windows logo, Windows NT, and Windows Server are either registered trademarks or trademarks of Microsoft Corporation in the United States and/or other countries. Other product and company names mentioned herein may be the trademarks of their respective owners.
The example companies, organizations, products, domain names, e-mail addresses, logos, people, places, and events depicted herein are fictitious. No association with any real company, organization, product, domain name, e-mail address, logo, person, place, or event is intended or should be inferred.
Part 1
PivotTables and PivotCharts. . . . 341
Chapter 17
Command Bars . . . 365
Chapter 18
Creating User Forms . . . 395
Chapter 20
Creating Advanced
User Forms. . . 419
Part 6
Excel and the €
Outside World: €
Collaborating €
Made Easy
443€
Chapter 21
Excel and Other Office
Applications . . . 445
Excel and the
Structured Query Language . . . . 467
Chapter 23
Introducing ADO . . . 481
Chapter 24
Excel Query Program . . . 497
Chapter 25
Excel and the Web . . . 519
Chapter 26
Excel and the Extensible
Acknowledgments . . . xix
We’d Like to Hear from You . . . xxi
About the CD . . . xxiii
What’s on the CD . . . xxiii
Using the CD . . . xxiii
System Requirements . . . xxiv
Support Information . . . xxiv
Conventions and Features Used in this Book . . . xxv
Text Conventions . . . xxv
Design Conventions . . . xxv
Part 1
Preliminaries
Chapter 1What’s New in Excel 2003
3
Using Improved Statistical Functions . . . 3Creating Smart Documents . . . 6
Creating Document Workspaces . . . 6
Implementing Information Rights Management . . . 7
Comparing Workbooks Side By Side. . . 7
Getting Information with the Research Task Pane . . . 8
Using Extended XML Capabilities. . . 8
Creating Excel Lists . . . 9
Mapping Excel Data to XML Schemas . . . 10
Publishing Spreadsheets with Web Components . . . 11
Chapter 2
Exploring Excel
13
Workbooks . . . 13Worksheets . . . 14
Cells and Ranges . . . 15
The Excel Interface . . . 18
Visual Basic for Applications
Chapter 3
Exploring Visual Basic for Applications
25
Time and Date Serial Numbers . . . 213
Creating Add-Ins and COM Add-Ins
239
Introducing Add-Ins . . . 239Understanding and Using Events
265
Enabling and Disabling Events. . . 266Workbook Events . . . 267
Open Event . . . 269
Activate Event . . . 270
Excel and the Outside World: Collaborating Made Easy
Chapter 21
Excel and Other Office Applications
445
Communicating with a Web Server. . . 536
Using Internet Solutions with Excel . . . 537
Chapter 26
Excel and the Extensible Markup Language (XML)
539
Introducing Data Lists. . . 539Creating Data Lists Programmatically. . . 541
Creating XML Schemas. . . 546
Creating XML Data Files . . . 549
Adding XML to a Workbook Manually . . . 550
Importing XML Data Manually . . . 552
Adding XML to a Worksheet Programmatically. . . 553
Mapping a Schema to a Worksheet Programmatically . . . 553
From Curtis Frye:
First and foremost I’d like to thank my co-authors, Wayne Freeze and Felicia Buckingham, for their knowledge and skill at presenting a series of complex topics so effectively. Westley Annis pitched in on several chapters as well, for which I am grateful.
I value my relationship with Microsoft Press for many reasons, but right up there on the list is the terrific working relationship I have with everyone there. I’m happy to say our relationship survived intact despite many changes in all of our lives that transpired during this project. Juliana Aldous Atkinson invited me to submit an outline and shepherded the proposal through the review process. Sandra Haynes was the first project editor, and Dick Brown took over when Sandra assumed different duties within Press. Wendy Zucker stepped in to help during the revision process when Dick went on vacation for a week. The phrase “team effort” doesn’t begin to describe the sort of support they provided.
I was also very fortunate to have Mark Dodge, co-author of Microsoft Office Excel 2003 Inside Out, as my technical editor. His knowledge of both the series and Excel gave him the perspective to make many terrific recommendations. Lisa Pawlewicz, ably assisted by Jaime Odell, performed what was probably one of the more involved copy edits that has passed over their desks in a while. Page proofs were handled by Sandi Resnick at Microsoft and the nSight team of Joe Armstrong, Steve Boudreault, Catherine Cooker, Beth Lew, Katie O’Connell, Dan Shaw, Asa Tomash, and Melissa von Tschudi-Sutton. Barbara Levy and Carl Diltz turned my Word files into the beautiful pages you see before you, William Teel got the graphics ready for production, Joel Panchot created the original art, and Richard Shrout created a thorough index. Tess McMillan heads the team that created the Companion CD.
Finally, I’d like to thank my agent, Neil Salkind of StudioB, for introducing me to Microsoft back in December of 2000. He was concerned about recommending a relatively new author to such an important publisher, but I’d say things have turned out pretty well.
From Wayne Freeze:
Curt: thanks for putting up with me while writing this book. I valued your patience, espe-cially when I was running behind schedule as usual. Laura: thank you for making my first year at StudioB a very worthwhile experience. Steve: thank you for the opportunities and challenges you tossed my way this year and I have even higher expectations for the next. Christopher and Samantha: thanks for tolerating the long hours I’ve spent working on this book alongside my other projects. Jill: thank you for being you—I love you.
From Felicia Buckingham:
Our goal at Microsoft Press is to create books that help you find the information you need to get the most out of your software.
The Inside Out series was created with you in mind. As part of our ongoing effort to ensure that we’re creating the books that meet your learning needs, we’d like to hear from you. Let us know what you think. Tell us what you like about this book and what we can do to make it better. When you write, please include the title and author of this book in your e-mail mes€ sage, as well as your name and contact information. We look forward to hearing from you!
How to Reach Us
E-Mail: [email protected] Mail: Inside Out Series Editor
Microsoft Press One Microsoft Way Redmond, WA 98052
The Companion CD that ships with this book contains many tools and resources to help you get the most out of your Inside Out book.
What’s on the CD
Your Inside Out CD includes the following:
● Complete eBook. In this section, you’ll find an electronic version of Microsoft Office Excel 2003 Programming Inside Out. The eBook is in PDF format.
● Computer Dictionary, Fifth Edition eBook. Here you’ll find the full electronic version of the Microsoft Computer Dictionary, Fifth Edition. Suitable for home and office, the dictionary contains more than 10,000 entries.
● Insider Extras. This section includes the sample files used in the book.
● Microsoft Resources. In this section, you’ll find information about additional resources from Microsoft that will help you get the most out of Microsoft Office Excel 2003 and other business software from Microsoft.
● Extending Excel. In this section, you’ll find great information about third-party utilities and tools you use to further enhance your experience with Microsoft Office Excel 2003.
The Companion CD provides detailed information about the files on this CD, and links to Microsoft and third-party sites on the Internet. All the files on this CD are designed to be accessed through Microsoft Internet Explorer (version 5.01 or later).
Note The links to third-party sites are not under the control of Microsoft Corporation, and Microsoft is therefore not responsible for their content, nor should their inclusion on this CD be construed as an endorsement of the product or the site. Software provided on this CD is in English language only and may be incompatible with non-English language operat-ing systems and software.
Using the CD
System Requirements
Following are the minimum system requirements necessary to run the CD:
● Microsoft Windows XP or later or Windows 2000 Professional with Service Pack 3 or later.
● 266-MHz or higher Pentium-compatible CPU
● 64 megabytes (MB) RAM
● 8X CD-ROM drive or faster
● Microsoft Windows–compatible sound card and speakers
● Microsoft Internet Explorer 5.01 or later
● Microsoft Mouse or compatible pointing device
Note System requirements may be higher for the add-ins available via links on the CD. Individual add-in system requirements are specified at the sites listed. An Internet connec-tion is necessary to access some of the hyperlinks. Connect time charges may apply.
Support Information
Every effort has been made to ensure the accuracy of the book and the contents of this Companion CD. For feedback on the book content or this Companion CD, please contact us by using any of the addresses listed in the “We’d Like to Hear From You” section.
Microsoft Press provides corrections for books through the World Wide Web at http://www.microsoft.com/learning/support/. To connect directly to the Microsoft Press Knowledge Base and enter a query regarding a question or issue that you may have, go to http://www.microsoft.com/learning/support/search.asp.
Used in this Book
This book uses special text and design conventions to make it easier for you to find the infor -mation you need.
Text Conventions
Convention Meaning
Abbreviated menu commands For your convenience, this book uses abbreviated menu commands. For example, “Click Tools, Track Changes, Highlight Changes” means that you should click the Tools menu, point to Track Changes, and click the High-light Changes command.
Boldface type Boldface type is used to indicate text that you enter or
type.
Initial Capital Letters The first letters of the names of menus, dialog boxes, dialog box elements, and commands are capitalized. Example: the Save As dialog box.
Italicized type Italicized type is used to indicate new terms.
Plus sign (+) in text Keyboard shortcuts are indicated by a plus sign (+) sep-arating two key names. For example, Ctrl+Alt+Delete means that you press the Ctrl, Alt, and Delete keys at the same time.
Design Conventions
This icon identifies a new or significantly updated feature in this version of the software.
Inside Out
This statement illustrates an example of an “Inside Out” problem statement
Tip Tips provide helpful hints, timesaving tricks, or alternative procedures related to the task being discussed.
Troubleshooting
This statement illustrates an example of a “Troubleshooting” problem statement
Look for these sidebars to find solutions to common problems you might encounter. Trou-bleshooting sidebars appear next to related information in the chapters. You can also use the Troubleshooting Topics index at the back of the book to look up problems by topic.
Cross-references point you to other locations in the book that offer additional information about the topic being discussed.
This icon indicates information or text found on the companion CD.
Caution Cautions identify potential problems that you should look out for when you’re completing a task or problems that you must address before you can complete a task.
Note Notes offer additional information related to the task being discussed.
Sidebars
Preliminaries
1 What’s New in Excel 2003
3
Chapter 1
What’s New in Excel 2003
Using Improved Statistical Functions . . . . .3 Comparing Workbooks Side By Side . . . 7 Creating Smart Documents . . . .6 Getting Information with the
Creating Document Workspaces . . . .6 Research Task Pane. . . 8 Implementing Information Rights Using Extended XML Capabilities . . . 8 Management. . . .7
Microsoft Excel has been around since 1985, so it’s no surprise that the basic spreadsheet elements of the program have remained fairly constant for quite some time. That said, there is always room for improvement, and Microsoft Office Excel 2003 has a bunch of new fea-tures that make data gathering, collaboration, and data transfer much more effective than in previous versions. The bulk of the improvements in Excel 2003 revolve around the use of Extensible Markup Language, or XML, which is a flexible, text-based markup system that lets you describe the contents of a spreadsheet so that the data it contains can be handled auto-matically instead of manually, saving time and reducing the possibility of errors introduced from re-keying or copying the data. Excel 2003 also comes with a suite of improved statistical functions, which are far more precise than in previous versions of the program.
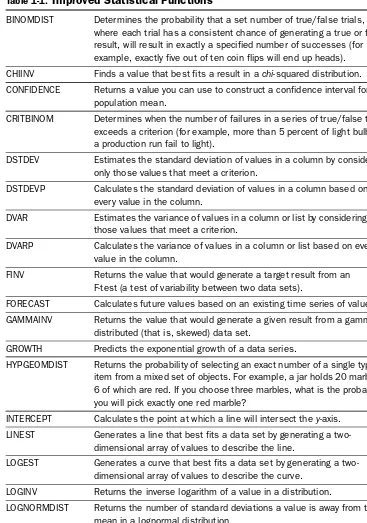
Using Improved Statistical Functions
Table 1-1.
Improved Statistical Functions
Chapter 1
BINOMDIST Determines the probability that a set number of true/false trials, where each trial has a consistent chance of generating a true or false result, will result in exactly a specified number of successes (for example, exactly five out of ten coin flips will end up heads). CHIINV Finds a value that best fits a result in a chi-squared distribution. CONFIDENCE Returns a value you can use to construct a confidence interval for a
population mean.
CRITBINOM Determines when the number of failures in a series of true/false trials exceeds a criterion (for example, more than 5 percent of light bulbs in a production run fail to light).
DSTDEV Estimates the standard deviation of values in a column by considering only those values that meet a criterion.
DSTDEVP Calculates the standard deviation of values in a column based on every value in the column.
DVAR Estimates the variance of values in a column or list by considering only those values that meet a criterion.
DVARP Calculates the variance of values in a column or list based on every value in the column.
FINV Returns the value that would generate a target result from an F-test (a test of variability between two data sets).
FORECAST Calculates future values based on an existing time series of values. GAMMAINV Returns the value that would generate a given result from a
gamma-distributed (that is, skewed) data set.
GROWTH Predicts the exponential growth of a data series.
HYPGEOMDIST Returns the probability of selecting an exact number of a single type of item from a mixed set of objects. For example, a jar holds 20 marbles, 6 of which are red. If you choose three marbles, what is the probability you will pick exactly one red marble?
INTERCEPT Calculates the point at which a line will intersect the y-axis. LINEST Generates a line that best fits a data set by generating a
two-dimensional array of values to describe the line.
LOGEST Generates a curve that best fits a data set by generating a two-dimensional array of values to describe the curve.
LOGINV Returns the inverse logarithm of a value in a distribution.
LOGNORMDIST Returns the number of standard deviations a value is away from the mean in a lognormal distribution.
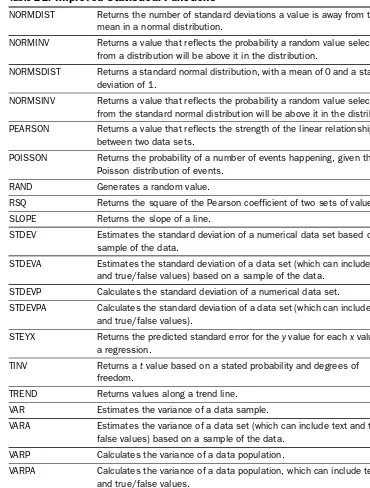
Table 1-1.
Improved Statistical Functions
NORMDIST Returns the number of standard deviations a value is away from the mean in a normal distribution.
NORMINV Returns a value that reflects the probability a random value selected from a distribution will be above it in the distribution.
Chapter 1
NORMSDIST Returns a standard normal distribution, with a mean of 0 and a standard deviation of 1.
NORMSINV Returns a value that reflects the probability a random value selected from the standard normal distribution will be above it in the distribution. PEARSON Returns a value that reflects the strength of the linear relationship
between two data sets.
POISSON Returns the probability of a number of events happening, given the Poisson distribution of events.
RAND Generates a random value.
RSQ Returns the square of the Pearson coefficient of two sets of values. SLOPE Returns the slope of a line.
STDEV Estimates the standard deviation of a numerical data set based on a sample of the data.
STDEVA Estimates the standard deviation of a data set (which can include text and true/false values) based on a sample of the data.
STDEVP Calculates the standard deviation of a numerical data set.
STDEVPA Calculates the standard deviation of a data set (which can include text and true/false values).
STEYX Returns the predicted standard error for the y value for each x value in a regression.
TINV Returns a t value based on a stated probability and degrees of freedom.
TREND Returns values along a trend line. VAR Estimates the variance of a data sample.
VARA Estimates the variance of a data set (which can include text and true/ false values) based on a sample of the data.
VARP Calculates the variance of a data population.
VARPA Calculates the variance of a data population, which can include text and true/false values.
Chapter 1
Creating Smart Documents
Excel workbooks have always been able to interact with other Office documents, but those interactions have been somewhat limited. Creating links to data on the Web, in a database, or in another Office document are all valuable abilities, but the workbook was simply a stand-alone collection of bits. In Office 2003, smart documents are Office documents that have metadata (that is, data that tells the document about itself) with information regarding how they fit within a business process, allowing the documents to take programmed actions based on that context.
As an example, if you work at a technical services firm that uses an Excel-based template to track the time you spend on various projects, you probably create a new workbook (with one worksheet) at the beginning of every week, save it with your identifying information, and fill in your time at the end of each day. Then, at the end of the week, you either save the work-book to a network folder or e-mail the workwork-book to your administrative contact. Smart doc-uments, by contrast, have programming that fills in the details about how your timecard fits in the business process. When you create a new timecard workbook, Excel recognizes who you are and fills in your personal data (name, employee number, projects, etc.). Then, when you’re ready to leave for the week, the smart document displays a button that lets you send the workbook to the next stage in the process. And as far as you’re concerned, it doesn’t mat-ter what mechanism is used to send the data along; it could be written to a database, saved as a worksheet in a workbook elsewhere on the network, incorporated into data on a BizTalk server tracking workflow issues, or attached to a Microsoft Outlook e-mail message and sent to your administrative contact.
Creating Document Workspaces
An increasing number of documents require input from more than one person. When you estimate the cost of a large project, for example, you will probably require input from every member of your team to determine which products and components should be considered and ultimately used in the project, not to mention the amount of labor and corporate over-head spending required to support the project internally. Sharing and merging workbooks is one way to get the information out there, but the process is filled with pitfalls. If one of your colleagues adds or changes a password for their copy of the workbook, for example, you won’t be able to include their changes in the merge.
document become available for every member of the team; if the changes conflict, you as the administrator are able to choose which changes will be adopted. You can also use the controls on the Shared Workspace task pane to create and manage a document workspace.
Note Document workspaces are available for Microsoft Office Word 2003, Excel 2003, PowerPoint 2003, and Visio 2003.
Implementing Information Rights Management
One of the hardest problems to solve in the digital domain is limiting access to information. You can use passwords, accounts, and other access restrictions to limit who can view files on a computer or network, but once an unprotected file is out in the open it can be copied and dis-tributed easily. The new Information Rights Management (IRM) capabilities in Office 2003 help maintain the confidentiality and integrity of your information by limiting who is able to view and edit your files. Specifically, network administrators can create policies that allow you to set user-level permissions to limit access to the material. Users who somehow get their hands on unauthorized copies of the files will not be able to peek at your company’s budget for the next year. Users who are authorized recipients of the file but don’t have Office 2003 or later installed on their computer will be able to use file viewers that let them examine the files, but not edit them.
Note Information Rights Management is only available in Microsoft Office Professional Edition 2003, Word 2003, Excel 2003, and PowerPoint 2003.
Comparing Workbooks Side By Side
Another useful new capability in Excel 2003 is the ability to scroll through two windows at the same time so that you can compare the contents. Cell data forms patterns as it scrolls by, and you can often pick out differences visually. The differences are even more pronounced when you use conditional formats or change tracking to display cell data in a format that’s different than the main body of data. To turn on simultaneous scrolling, open the two work-books you want to compare and choose Window, Compare Side By Side With.
One of the enhancements in Excel 2003 is the set of additional research tools you can use to get information from a number of sources. You can display the Research task pane by choos-ing View, Task Pane and, if necessary, clickchoos-ing the Other Task Panes bar at the top of the task pane and clicking Research. Once you have displayed the Research task pane, you can type a word or phrase in the Search For box, select the reference works you want to search, and click the Start Searching button (the arrow to the right of the Search For box) to get more infor-mation. Figure 1-1 shows the Research task pane and a selection of the reference materials available for you.
Getting Information with the Research Task Pane
Chapter 1
Figure 1-1. You can find synonyms, look up words in encyclopedias, and translate words
into foreign languages using the tools on the Research task pane.
Tip Research the contents of a cell
You can research the contents of a cell using the reference books in the Research task pane by holding down the Alt key and clicking the cell containing the text you want to research.
At the bottom of the Research task pane are links you can click to update the research tools installed on your computer, such as the thesauruses and dictionaries, and a link to the Office Marketplace. The Office Marketplace is a resource on the Microsoft Web site that lists sub-scription services you can use when the basic tools at your disposal in the Research task pane don’t give you all of the information you need. Two such resources are the eLibrary, which provides access to 13 million multimedia documents, including photographs and maps, that are collected from periodicals published around the world, and more than 450,000 corporate profiles from the Thomson Profiles collection. The collection includes information on 300,000 U.S. companies and includes industry comparisons, market share information, rankings, and news stories from a collection of 2,500 journals.
Using Extended XML Capabilities
understood perfectly by any human viewing the page, but the server presenting the data and the client receiving the data on behalf of its user would have no idea as to what sort of data was transmitted. If the file were an XML file, on the other hand, the machines involved could recognize the data as sales data and handle it appropriately. XML support was introduced in Excel 2002, but you were limited to opening and saving workbooks in the XML Spreadsheet Schema, which was a useful but far from comprehensive ability.
Note All new XML capabilities described in this section are only available in the Microsoft Office 2003 Professional Edition. Users with other editions will still be able to save and open XML workbooks as in Excel 2002.
Creating Excel Lists
Many of the advanced data tools in Excel operate on a list, which is a range of cells consisting of one or more columns where each column has a label at the top. In Excel 2002 and earlier, lists were a bit haphazard; when you wanted to create a PivotTable, sort data, or create an AutoFilter, you clicked any cell in the range and selected the menu item to perform the co m-mand you wanted. If Excel couldn’t determine the boundaries of the range, such as by being unable to find a heading for one or more columns, the process would come to a grinding halt. In Excel 2003, lists are well-defined entities that you create by choosing Data, List, Create List, and using the controls in the Create List dialog box to define the area comprising the list.
Note If you select the cells in your list before you choose Data, List, Create List, the range appears in the Create List dialog box.
When you create a list, several things happen.
● A border appears around the list’s edges. You can drag the edges of the border to resize your list.
● AutoFilter controls appear in the heading cells, which you can use to limit the data that is displayed within the list.
● An insert row, designated by an asterisk, appears. Just as in an Access table or an Excel data entry form, you can fill in the insert row and press Enter to add the row of data to the list and create a new insert row.
● The List toolbar appears, containing helpful list-management buttons.
● You have the option to display a total row at the bottom of the list by choosing the Toggle Total Row button on the List toolbar. The default operation in the total row is to sum the contents of a column, but you can click any cell in the total row to display a list of other summary operations available for use in the row.
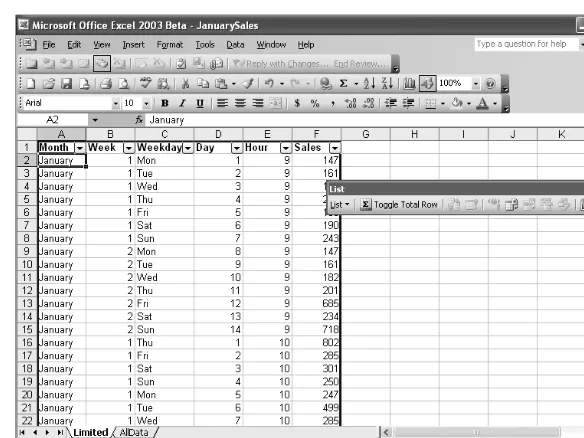
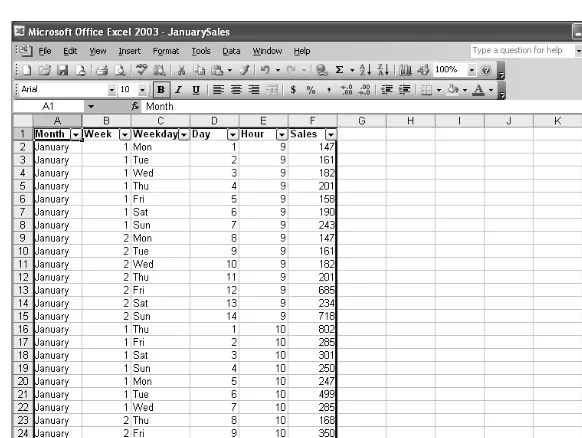
After you create a list (one example of which is shown in Figure 1-2), you can work with the list as a separate entity within your worksheet. For example, you can filter the data, create a PivotTable, or add new rows to the list. Whichever task you perform, Excel will shift the worksheet contents around the list to reflect the new entry (such as by adding a blank row
Chapter 1
when you add data to a list). If you are working on a network equipped with SharePoint Services, you can publish the list to the server, update the list’s data using the copy of the list on the SharePoint site, or edit a copy of the list on a computer away from the network and integrate your changes when you return. You can also use the more advanced data validation tools available through SharePoint to limit the types of data you and your colleagues can enter into the lists. In Excel, you can require users to enter numerical values, but on a SharePoint server you can be more specific as to data type, such as by requiring users to enter integer values.
Figure 1-2. Data lists enhance your ability to create and display data collections in
Excel 2003.
Mapping Excel Data to XML Schemas
XML data structures are defined in a schema, which in Excel is stored in a .xsd file. The fol-lowing XML code listing shows how you might construct part of a schema to store data about a product.
This XML code isn’t a macro you can run using the Microsoft Visual Basic Editor. Instead, the code describes a product with three attributes.
<xs:complexType name="productType"> <xs:sequence>
<xs:element name="productId” type="xs:string” /> <xs:element name="productName” type="xs:string” /> <xs:element name="priceEach” type="xs:decimal” /> </xs:sequence>
This schema tells Excel to expect three data elements for a data structure named productType: productId, productName, and priceEach. The complexType statement names the data stru c-ture, whereas element definition statements give you the name of the element and the expected data type (in this case, either a string or a decimal value), while the <xs:sequence> statement tells Excel to expect the elements in exactly that order every time.
Publishing Spreadsheets with Web Components
Technically part of the Microsoft Office program suite, rather than Excel, the Office Web Components available for your use in Excel 2003 offer updated functionality that make it possible for you to publish Web pages that behave like spreadsheets. There are three Web components available in Office 2003: PivotTable Lists, Spreadsheets, and Charts. A fourth component, the Data Source Component, provides database access for Web-based PivotTable lists.
Chapter 2
Exploring Excel
Workbooks . . . .13 The Excel Interface. . . 18 Worksheets . . . .14 Formulas . . . 21 Cells and Ranges . . . .15
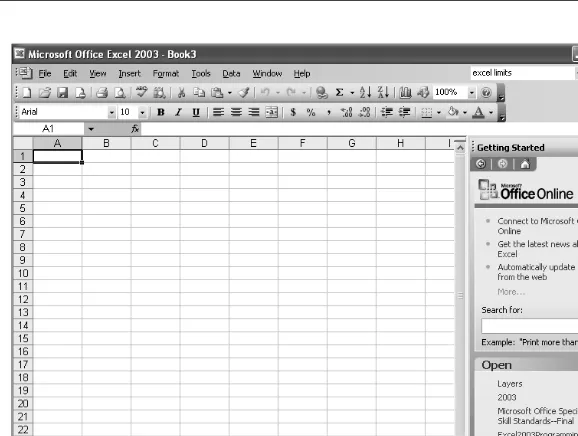
If you’re interested in programming Microsoft Office Excel 2003, you’re probably pretty familiar with the basic layout of an Excel workbook and have a good handle on how to manipulate workbooks, worksheets, data, and formulas. Even if you are familiar with Excel, you should at least skim this chapter to see if there are any interesting tidbits that you can use to make your life easier. But, if you’re comfortable creating scenarios, know how many colors can be used in an Excel workbook, and have a good handle on how Excel helps you create for-mulas, feel free to skip right to the next chapter.
Workbooks
The basic unit of organization in Excel is the workbook. In the Microsoft Office hierarchy, an Excel workbook is at the same level as a Microsoft Word document, a Microsoft Access data-base, and a Microsoft PowerPoint presentation. And, just as documents contain sections, databases are built around tables, and presentations contain slides, Excel workbooks contain a set of sheets that actually hold the data and other Excel objects. Excel 2003 supports the following four types of sheets, but you will probably just use the first two of them:
● Worksheets
● Chart sheets
● Excel 4.0 macro sheets (also known as XLM files)
● Excel 5.0 dialog sheets (a way to create a custom dialog box)
While you can no longer create XLM files or dialog sheets, Excel 2003 does let you open files from Excel 4.0 or Excel 5.0 without losing any of the workbooks’ functionality. If you’re work-ing in a company that has used the same basic workbooks for quite some time, the ability of Excel 2003 to work with the older files allows a straightforward transition from old to new.
Tip Limit the number of worksheets to one
If you plan to create a lot of templates, which requires saving a workbook that contains a single worksheet, you could save a few steps by changing the default number of work-sheets to one until you are done creating templates.
You navigate among worksheets in a workbook using the controls on the tab bar at the bot-tom left corner of the Excel window. Each worksheet has its own sheet tab (named Sheet1, Sheet2, and Sheet3 by default); clicking a sheet tab displays the corresponding sheet, while right-clicking a sheet tab displays a shortcut menu with commands to insert a new sheet, rename or delete the selected sheet, move or copy sheets, or change the color of the sheet tab of the selected sheet. The ability to change the color of a sheet tab was introduced in Excel 2002 and is a handy technique you can use to indicate where you made changes in a work-book, emphasize one sheet over another (such as if you create a summary worksheet), and facilitate workbook navigation.
Important One little-known limitation in Excel is that you may use up to only 56 colors in a workbook. The limitation doesn’t include the colors depicted in graphics you embed or link to in a workbook, so if you need to display a complex chart with more than 56 colors you will need to create the chart, export the chart and its legend to a graphics program, edit the chart and legend, and either display the chart and legend as a separate graphics file or embed the new file in your workbook.
Worksheets
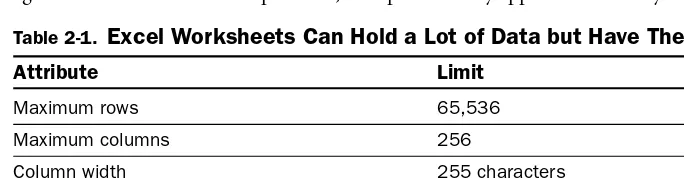
Of the four basic types of sheets you’ll work with in Excel, worksheets are by far the most com-mon. Worksheets contain cells, which are arranged in rows and columns, where you store data and create formulas to summarize that data. As noted in Table 2-1, Excel worksheets have a maximum of 256 columns and 65,536 rows. If you’re working with larger data sets, such as those generated by scientific experiments or a transaction tracking system in a busy sales organization, you should probably write the data to a text file and either process it in man-ageable chunks or use a more powerful, enterprise-worthy application to analyze the data.
Table 2-1.
Excel Worksheets Can Hold a Lot of Data but Have Their Limits
Table 2-1.
Excel Worksheets Can Hold a Lot of Data but Have Their Limits
Attribute Limit
Maximum number of scenarios No maximum, but only 251 will be displayed in a scenario summary Maximum number of changing cells in a scenario 32
Maximum number of changing cells in Solver 200
One of the most underused capabilities in Excel is the scenario, which lets you define alterna-tive data sets for a worksheet. As noted in Table 2-1, each scenario can contain up to 32 changes. The advantages of scenarios are that you can define them quickly (by clicking Tools, Scenarios and using the controls in the Scenario Manager dialog box, shown in Figure 2-1), and you’re able to switch between alternative data sets without having to create a new work-sheet to contain the speculative data. If you’re creating one new workwork-sheet that contains 12 values, 3 of which change, scenarios probably won’t save you that much time. However, if you have a broad range of values (and combinations of values) that could change and you don’t want to keep track of separate worksheets for each possible combination, you can create a scenario for each combination and switch within the same worksheet.
Figure 2-1. The Scenario Manager dialog box helps you manage and present alternative
data sets.
If you need to create a scenario with more than 32 changes, you should probably ceate a new worksheet to hold the data.
Cells and Ranges
At the bottom of the organizational hierarchy in Excel is the cell, which is formed by the intersection of a column and a row in a worksheet. A cell can contain a value or a formula. By default, Excel displays the result of a formula in its cell, but you can change that setting by clicking Tools, Options, clicking the View tab, and selecting Formulas. What’s interesting is
Chapter 2
that the formula in a cell is always displayed in the formula bar, regardless of whether or not you have formulas displayed in the cells. You might expect Excel to toggle between showing the formula result or the formula based on what was shown in the body of the worksheet.
Note Displaying formulas instead of the formulas’ results in a worksheet’s cells displays the Formula Auditing toolbar, which has buttons you can use to identify cells used in your formulas, watch how the values in specific cells change, and step through formulas one cal-culation at a time to zero in on errors.
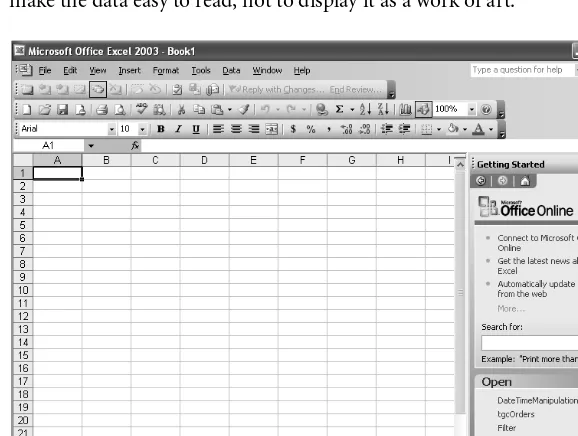
After you have your data, you can choose how to display it. The Formatting toolbar, which is displayed by default, has a range of buttons you can use to make basic changes to the appear-ance of your data, such as displaying the cell’s contents in bold type or in a different font, but if you want fine control over your data’s appearance you need to click Format, Cells to display the dialog box shown in Figure 2-2. From within the Format Cells dialog box, you can change the direction of the text in a cell, cause the contents of a cell to shrink to fit the existing size of the cell without wrapping, or add borders to a cell. It can be easy to go overboard with the formatting, so you should always keep in mind that the objective of an Excel worksheet is to make the data easy to read, not to display it as a work of art.
Figure 2-2. Use the controls in the Format Cells dialog box to present your data effectively.
the cell references are inserted into the formula. In this instance, selecting the cells from C3 to C24 would result in the formula =SUM(C3:C24). And, as of Excel 2002, you are able to select discontiguous groups of cells by holding down the Ctrl key. For example, typing =SUM() into a cell, positioning the insertion point between the parentheses, selecting cells C3 to C24, and then holding down the Ctrl key while you select cell C26, would result in the formula =SUM(C3:C24,C26).
Important When creating a formula, pressing the Enter key before you complete the for-mula will result in an error. You need to type =SUM( and then select the cells you want to include, before you type the closing parenthesis.
When you work with a lot of worksheets and formulas, or if you need to pass a workbook you created to a colleague, just using cell references to designate the values used in a formula can lead to a lot of confusion. Rather than stay with the simple but somewhat cryptic cell ref-erences, you can create named ranges (often just called names) to make your formulas eas-ier to read. For example, if you had a worksheet with sales for several different product categories, you could create a named range for each category and create a formula such as =SUM(MachineTools,Software,Consulting) instead of =SUM(C3:C24,D3:D24,E3:E24).
The quickest way to create a named range is to select the cells you want in the range, click in the Name box at the left edge of the formula bar, and type the name for the range. (The Name box is the area in the formula bar that displays the address of the currently selected cell.)
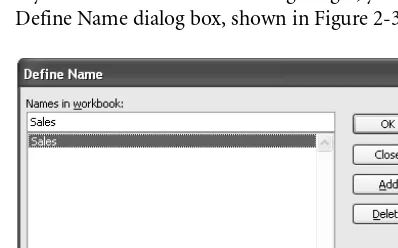
If you want to work with existing ranges, you can click Insert, Name, Define to display the Define Name dialog box, shown in Figure 2-3. From there, you can add or delete ranges.
Figure 2-3. Use the Define Name dialog box to manage your named ranges.
Chapter 2
You can have Excel show which cells comprise a named range by clicking the down arrow at the right edge of the Name box and clicking the name of the range you want to see.
The Excel Interface
Having a powerful spreadsheet program at your fingertips doesn’t do you any good if you’re not able to find what you’re looking for, so the Excel designers spent a lot of time working on the organization and appearance of the Excel interface to make it easier for users to get the most out of their workbooks. Figure 2-4 shows the Excel window in all its glory, with callouts for the elements most commonly used in using and programming Excel.
Inside Out
Starting with Excel 2002, the program came with an adaptive menu system that just dis-played the most basic commands, requiring you to hover the mouse pointer over the bottom of a menu to expand the menu. It’s a great idea in theory, but for most users, who don’t have thorough knowledge of the program, it’s quite a hindrance. You can, and should, turn off the adaptive menu system by clicking Tools, Customize, Always Show Full Menus.
Title Bar. The title bar is at the top of the Excel window and displays the name of the pro-gram (Microsoft Office Excel 2003) followed by the name of the active workbook, if any. If the active workbook has any access restrictions or is shared, the workbook name will be followed by a designation in brackets. If you’ve opened more than one copy of the same workbook, the first name will be followed by :1, the second by :2, and so on.
Select All Button. The Select All button is the bare piece of real estate to the left of the
Column A header and above the Row 1 header; clicking it selects every cell in a worksheet.
Command Bars. Menu bars and toolbars might look different, but underneath they work
exactly the same way. Clicking File, Save is no different from clicking the Save toolbar button, so why have both systems, plus the Ctrl+S keyboard shortcut, in place? Because different users prefer different methods.
Formula Bar. The formula bar, the long, white strip just above the column headers in a
worksheet, is where Excel displays the formula in the active cell. If there is no formula in the active cell, the cell’s value appears on the formula bar. You can hide the formula bar by clicking View, Formula Bar, which is a toggle (that means you click the bar to turn it off, and click again to turn it back on).
Name Box. The name box is in the running as the most versatile element in the Excel
inter-face. If you have created a named range, as described earlier in this chapter, you can select a range by clicking the down arrow to the right of the name box and clicking the name you want to select (thereby outlining the cells in the named range). When you don’t have a named range selected, the name box displays the reference of the active cell (for example, A1), or the area selected while dragging. For instance, if you select an area three rows high by ten columns wide, the name box displays 3R × 10C until you release the mouse button, and then the name box displays the reference of the cell in the upper-left corner of the selected range.
Note Knowing the precise dimensions of the area you’ve selected is helpful if you need to paste a group of cells from another worksheet into the active worksheet.
Program Window Controls. The standard Windows program controls are positioned at the
top right of the Excel window: the Minimize button, the Restore button, the Maximize button (which appears when the program window has been resized), and the Close button.
Workbook Window Controls. These buttons operate in exactly the same manner as the
pro-gram window controls, but they affect only the active workbook. (The Excel window stays the same size it was when the buttons were clicked.)
Ask A Question Box. The Ask A Question box is the quickest way to look up topics in the
Excel help system. You type a word or phrase in the Ask A Question box, press Enter, and a list of available help topics appears in the Search Results task pane at the right edge of the workbook. Clicking the name of the help topic displays that topic.
Chapter 2
Task Pane. Introduced in Excel 2002, task panes are interface objects with links to perform
common tasks in a number of subject areas. The task panes appear at the right edge of the Excel window when you perform certain tasks (for example, clicking File, New dis-plays the New Workbook task pane). You can also display the task panes by clicking View, Task Pane. The following task panes are available to you in Excel 2003:
■ Clip Art. The Clip Art task pane gives you links you click to search for clip art in the Office gallery, to organize clips you have saved, and to get help on topics related to clip art.
■ Clipboard. The Clipboard task pane is the new home for the Office Clipboard. The Office Clipboard can hold up to 24 items you have copied or cut to the clipboard.
■ Document Recovery. If Excel crashes while you have a workbook open, the Document Recovery task pane appears when you re-open Excel. You’ll have the chance to choose whether you want to revert to the most recently saved version of the workbook or to recover the workbook using the last AutoRecover file. ■ Document Updates. Used with SharePoint Services, the Document Updates
task pane gives you the ability to monitor workbooks you have placed in a shared workspace for changes.
■ Getting Started. The Getting Started task pane contains links for opening a recently used file, creating a new workbook, or connecting to the Microsoft Office Web site.
■ Help. The Help task pane has links to Microsoft support newsgroups, to infor-mation about assistance and training for Microsoft Office, and find out what’s new in Excel 2003.
■ New Workbook. The New Workbook task pane lets you use templates to create a new workbook, search for workbook templates on your computer or on the Microsoft Office site, or create a blank workbook.
■ Research. The Research task pane has links to a range of tools you can use to look up words and phrases. There are dictionaries and thesauruses available in several languages, and there is a “translation” utility you can use to find corres-ponding terms in French, Portuguese, Italian, and other languages.
■ Search Results. The Search Results task pane lets you search the Help system, Microsoft.com, the Office Support site, or online research tools for a word or phrase you type in the Search box.
■ Shared Workspace. Also part of the new Excel 2003 support for SharePoint Services, the Shared Workspace task pane contains a set of hyperlinks you can use to create and manage workspaces where you and your colleagues can collab-orate on a shared document.
Tab Bar. The tab bar displays a sheet tab for each worksheet in a workbook. You can navi-gate from sheet to sheet using the arrows on the tab bar, click the sheet tab of a work-sheet to display that work-sheet, or change the color of the work-sheet tab.
Status Bar. As the name implies, the Excel status bar displays the program’s status. The
status bar indicates whether a save or AutoRecover save is in progress, displays the run-ning total of values in selected cells, and tells you, among other things, if your keyboard has caps lock, scroll lock, and/or number lock turned on.
Inside Out
The running total feature is a little-known but very handy way to quickly summarize a few cells of data in Excel. When you select more than one cell, a summary of the data appears on the status bar a bit to the left of the number lock indicator. The default summary opera-tion is to find the sum of the data, but you can right-click the pane where the summary appears and, from the shortcut menu, click Average, Count, Count Nums (that is, the num-ber of cells in the selection that contain a numeric value), Maximum, Minimum, or Sum. If you want to turn the feature off, you click None. To turn it back on, just right-click the same area of the status bar and select the new summary operation.
Formulas
Excel is a terrific program for storing data, but the real power in a spreadsheet comes from the ability to summarize that data. To that end, Excel lets you create formulas to manipulate and summarize the values in your workbooks. The formulas can be as simple as displaying a value from one cell in another cell (for example, =A1 would display the value from cell A1 in the cell where the formula resides) to advanced statistical functions that comprehend data from thousands of cells.
In Excel 2003, you’re not left to your own devices when you begin typing a formula into a cell. Instead, when Excel recognizes the function you are typing, the program displays
the expected parameters for the formula as a tool tip. For example, when you type =VLOOKUP(, Excel displays VLOOKUP(lookup_value, table_array, col_index_num, [range_lookup]) in a tool tip. The first parameter to enter, the cell designation or value that is the lookup_value, is displayed in bold type until you type in the parameter, followed by a comma. After you type the comma, which indicates that you are done entering the value for that parameter, the name of the next parameter is displayed in bold type.
Tip In the tool tip that appears when you type in a formula, you can click the name of any parameter for which you have already entered a value to edit that value.
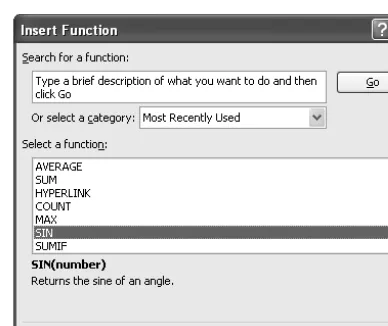
There’s even more help available for creating formulas, though. If you’re not sure which func-tion you need to use to generate a result, you can click Insert, Funcfunc-tion or click the Insert Function button at the left edge of the formula bar to display the Insert Function dialog box,
which is shown in Figure 2-5. The Insert Function dialog box lists all of the available func-tions by category and, when you click a function, a description of what it does and the argu-ments it expects appear in the Insert Function dialog box. When you double-click the formula name, a secondary dialog box appears to help you create the formula piece by piece.
Chapter 2
Figure 2-5. The Insert Function dialog box helps you find the function you want and guides
Visual Basic for
Applications
3 Exploring Visual Basic for Applications
25
4 VBA Programming Starter Kit
41
Exploring Visual Basic
for Applications
An Overview of Object-Oriented Working with Macros . . . 29 Programming . . . .25
This chapter provides an overview of how macros work in the context of Microsoft Office Excel 2003. The second part of the chapter covers macro recording and other related topics, but the first part steps back and gives you some perspective on what is happening when you create a macro. The quick version of that story is that Visual Basic for Applications (VBA) sees Excel as a series of objects that have attributes to describe them and actions those objects “know” how to take. Chapter 1, “What’s New in Microsoft Office Excel 2003,” showed you some of the basic elements you’ll encounter when using and programming Excel; this chapter takes that analysis a few steps further by showing you how object-oriented program€ ming languages represent those elements, and how to manipulate those objects using the macro recorder.
An Overview of Object-Oriented Programming
A computer program is, at its base, nothing more than a set of instructions the computer executes in a specified order. In Excel, that order may change based on the contents of the worksheet the program is working with, but one fundamental principle behind program€ ming languages is that if you give a program an identical data set to work with you will get the same result every time.
Chapter 3
environment using an abstract data type, which is a collection of characteristics and opera€ tions that reflect the values and actions associated with something you need to represent in a program (such as a product). For example, a garden supply store could have both an indoor sales area and a greenhouse, with products associated with each location. The abstract data type product might have values reflecting the name of the product, the category to which the product belongs, the product’s price, the product’s supplier, a description, and so on. It’s important to note, however, that defining an abstract data type for a product doesn’t create a place to hold the values and actions associated with that product. Instead, you would need to create an instance of the product abstract data type to store the data and actions associated with the new brand of potting soil you just started offering for sale in your garden supply store. The instance would have a unique identifier within the system, such as product001, and the program would know that the product name, category, price, description, and supplier would all refer to that particular product.
While abstract data types are a handy way to define sets of variables in a program, the under-lying structure of the programming languages that use abstract data types is still procedural because there can be routines that exist outside of the abstract data types. In an object-oriented programming language, every aspect of your computer code is based around the things in your environment. Those “things,” not surprisingly, are represented as objects, and all actions and data are encapsulated within those objects. In Excel, those objects could be workbooks, worksheets, ranges of cells, or external files. In general, there are four aspects of objects you can use to flesh out a program:
● Properties
● Methods
● Events
● Collections
Properties
In brief (actually, in total as well), properties are variables that describe some aspect of the object in which they are included. A common property for objects in Excel is Name, which holds the identifying value you or Excel assigned to the workbook, worksheet, cell range, or other object to which you’re referring. If you change the worksheet’s name, whether by using VBA code or by right-clicking the worksheet’s tab on the tab bar, clicking Rename, and edit€ ing the value, you change the value that is stored in the Name property. You can set new val€ ues for some worksheet properties (such as Name) directly, but to change other workbook properties you need to either take action using the Excel interface (such as by protecting a cell range) or a method (described in the next subsection).
or more worksheet cells lets you and your colleagues know that the data on that sheet is new and should be checked before the worksheet is included in any final written products.
Methods
A method is an action that an object “knows” how to perform. For example, you probably know that the worksheet displayed in the Excel window is referred to as the active worksheet. In Excel VBA, you can change the worksheet you’re affecting with your VBA code by calling the target worksheet’s Activate method. After the Activate method runs, the worksheet to which it is attached moves to the front of the worksheets in the Excel window and becomes available for editing. As with properties, methods are called using dot notation. To recalculate all of the formulas in a worksheet, for example, you would call the Worksheet.Calculate method.
Events
Just as a property is a quantifiable attribute of an object and a method is an action an object knows how to take, an event is an action an object recognizes as having happened. For exam€ ple, Excel 2003 knows about the following events (among many others):
● A workbook is opened or closed.
● A worksheet is activated or deactivated.
● A workbook is saved.
● A chart is clicked.
● A key (or combination of keys) is pressed.
● Data is typed into a cell.
● The formulas in a worksheet are recalculated.
● A hyperlink is followed.
Excel comes with a number of event handlers, or code routines that watch for particular actions to occur. When one of those actions does occur, and you’ve told Excel what you want it to do when the event happens, Excel will run the code in your event handler. For example, if after creating a new workbook you want Excel to display all open workbooks as a cascaded set of windows, you could create the following event handler:
Private Sub App_NewWorkbook(ByVal Wb As Workbook) Application.Windows.Arrange xlArrangeStyleCascade End Sub
Don’t worry if you’re not sure what each and every element of the event handler routine does; for now you can concentrate on the middle line of code, which tells the Excel application to arrange its windows using the cascade style. It’s the same result that would occur if you clicked Window, Arrange, Cascade in the Excel menu system, but if it’s an action you want to
Chapter 3
you the trouble.
Collections
The final element of object-oriented programming with which you should be familiar is the collection. As the name implies, a collection is a group of objects of the same type that are contained within another object. For example, a workbook contains a collection of one or more worksheets. If you wanted to make a change to every worksheet in a workbook, you could step through every worksheet in the collection and make the change programmatically.
If you’ve programmed before, you’ve probably run into the For…Next loop, which lets you repeat a set of instructions a number of times using something like the following sequence, which adds the directory path of the active workbook to the right section of the footer on the first three worksheets:
For i = 1 to 3
Worksheets(i).PageSetup.RightFooter = Path Next i
The problem with hard-coding (that is, assigning a set value to) the upper limit of a For…Next loop is that you would need to change the code every time you added or deleted a worksheet. That’s no big deal once or twice, but if you’re managing a lot of code you’ll inevitably forget to change it in a few places, causing errors you’ll have to fix. Worse yet, those errors might not be noticed until the proofreader discovers that the first 500 printed copies of your annual report aren’t formatted correctly and you’ve turned off your wireless phone as you while away your time on the beach. Yes, you can use a bit of code to discover the number of worksheets in your workbook, but there’s a simpler way to do it: use a For Each…Next loop instead. For Each…Next loops find the number of objects in a collection, such as worksheets in a work-book, and step through each occurrence. In this example, the preceding code would be writ-ten this way.
For Each Wksht in Worksheets Wksht.PageSetup.RightFooter = Path Next Wksht
Instead of incrementing the value in a standard For…Next loop, the For Each…Next loop simply looks for the next member of the Worksheets collection and stops when it doesn’t find one.
Working with Macros
The most obvious benefit to creating macros in Excel is that you can automate repetitive tasks. While there’s a lot more to macros and Visual Basic for Applications than repeating a series of actions without the need for human intervention, it’s a great place to start. This sec€ tion shows you how to record macros, run them using the method you find easiest, and use the built-in macro security capabilities to guard against viruses.
Recording and Viewing Macros
Recording a macro in Excel 2003 is a straightforward process: you click Tools, Macro, Record New Macro to display the Record Macro dialog box (depicted in Figure 3-1).
Chapter 3
Figure 3-6. The Record Macro dialog box provides an interface for managing the macros in
your workbook.
Type the name of the macro you want to create into the Macro Name box, and click OK. The Record Macro dialog box will go away, to be replaced by the Stop Recording toolbar.
You’re recording! Perform the actions you want to be included in your macro, click the Stop Recording button on the Stop Recording toolbar, and your macro is ready for use. As with any programming effort, you should plan what you want to do so you can do it as quickly and efficiently as possible. You should also practice the macro a few times so you are sure your actions generate the desired result.
When you’re done recording a macro, you can view the VBA code Excel created by clicking Tools, Macro, Macros, <macro_name>, Edit. Your macro will appear in the Visual Basic Editor, as shown in Figure 3-2.
Chapter 3
Figure 3-7. You can view the code behind a macro in the Visual Basic Editor.
This macro applies bold and italic formatting to the contents of the selected cell and to the contents of cell H13. Another aspect of this particular macro is that it was supposed to work for the active cell and the cell two columns to its right, but instead affects the active cell and cell H13. The reason that happened for this macro is that the macro recorder was using absolute references, which reflect the names of the cells selected during macro recording, instead of relative references, which reflect the positions of the selected cells in relation to the active cell when you start recording the macro. You can change your macro from absolute references to relative references by clicking the Relative References button on the Stop Recording toolbar. Figure 3-3 shows the same macro recorded using relative references.
Figure 3-8. A more flexible macro that works on any set of cells, not just the cells selected
For more information on creating relative references using the Offset property, see “Referring to Ranges” in Chapter 8: “Ranges and Cells".
Running a Macro
Once you’ve created a macro, you can run it at any time by clicking Tools, Macro, Macros, <macro_name>, Run. Also, in the Macro dialog box, you can display the macros available in other workbooks by clicking the arrow next to the Macros In box and selecting a workbook by name or by selecting All Open Workbooks, which will display every macro in any open workbook. If you select either of those choices, the macro names displayed will include the name of the workbook in which the macro is stored.
Tip Running Macros Automatically
If you want to have a macro run every time a particular workbook is opened, name the macro Auto_Open.
There are several other ways you can run a macro in Excel, though they require you to assign the macro to an action a user can take. Those actions are:
● Pressing a key sequence.
● Linking a macro to a toolbar button.
● Linking a macro to a menu item.
Assigning a Macro to a Key Sequence
For readers who prefer to use keyboard shortcuts such as Ctrl+C (for copying) when you use Excel, you can assign macros to key sequences. It’s important to remember that if you assign a macro to a key sequence that’s already taken (for example, Ctrl+S, which saves a workbook), the new assignment will take precedence over the default behavior in the workbook where the assignment was made.
To assign a key sequence to a macro, follow these steps:
1 Click Tools, Macro, Macros.
2 In the Macro name box, select the name of the macro to which you want to assign to a keyboard shortcut key.
3 Click Options.
4 Type a letter in the Shortcut key box. Typing a lowercase letter lets you use Ctrl+letter, while typing an uppercase letter lets you use Ctrl+Shift+letter as the shortcut.
Chapter 3
Chapter 3
6 Click OK. 7 Click Cancel.
Assigning a Macro to a Toolbar Button
Running a macro from inside the Macros dialog box is the easy “built-in” way to do it, but when you’re moving quickly through a worksheet, the last thing you want to do is dig through the menu system to open a dialog box, remember the name of the macro you want to run, and run it. It’s much simpler to assign the macro to a toolbar button so you can run the macro with a single click of the mouse. You can add a new toolbar button to an existing toolbar, but it usually makes more sense to create a new toolbar to hold the buttons for your macros. If you have your monitor set at a relatively low screen resolution to avoid eyestrain, for example, there won’t be much room on any of the standard toolbars for another button. Also, if you have toolbar buttons for more than one macro, it might be difficult to pick the button out of a crowd on a densely populated toolbar. If you put your macro toolbar buttons on a toolbar clearly labeled as your custom macro toolbar, you’ll have a much easier time finding your macros and remembering which button is which.
To create a new toolbar, add a button to it, and assign a macro to the button, follow these steps:
1 Click Tools, Customize. Then, if necessary, click the Toolbars tab to display the Toolbars tab page of the Customize dialog box.
2 Click New. Then, in the Toolbar Name box, type the name of the new toolbar and then click OK to create the toolbar.
3 In the Customize dialog box, click the Commands tab. 4 In the Categories list, click Macros.
5 Drag the Custom Button command to your new toolbar.
6 On the new toolbar, right-click the button you just added, click Name, type a name for the button, and press Enter.
8 Select the macro you want to assign to the toolbar button and click OK. 9 In the Customize dialog box, click Close.
Assigning a Macro to a Menu Item
Just as you can create toolbars to hold toolbar buttons that run your macros, you can create custom menus to serve the same purpose. While toolbars and menus are functionally equiv€ alent, there are two possible arguments in favor of adding a macro to a menu instead of a toolbar. The first argument is that there is usually room to add a new menu to the main menu bar. Also, because menus don’t display their full contents until you open them, menu items don’t take up valuable real estate on a toolbar in the Excel window. The second argument in favor of using menus over toolbars comes down to personal preference. If you like using the menu system, assign your macros to menu items; if you prefer to use toolbar buttons, create a new toolbar.
To assign a macro to a menu item, follow these steps:
1 Click Tools, Customize. If necessary, click the Commands tab.
2 In the Categories list, click New Menu and drag the new menu to the right end of the main menu bar.
3 Right-click the new menu, and click Name. Type your new menu name, and press Enter.
4 In the Categories pane of the Customize dialog box, click Macros.
5 In the Command list, drag the Custom Menu Item command to the head of your new menu. When a box appears under the new menu head, drag Custom Menu Item onto it. 6 On the new menu, right-click Custom Menu Item and then click Name.
7 Type a new name for the menu, and press Enter.
Macro. Then, in the Assign Macro dialog box, click the name of the macro you want to assign to the menu item and click OK.
9 Click Close.
Debugging a Macro
Part of the art of writing and recording macros is debugging, or the process of discovering why your VBA code isn’t working the way it should. The Visual Basic Editor provides quite a few tools for you to use in testing a macro you’ve recorded or written. One interesting tech€ nique you can use to debug your code is to step through the code one instruction at a time.
1 To start the process, click Tools, Macro, Macros, <macro_name>, Step Into to display the macro in the Visual Basic Editor.
2 From within the editor, press F8 to execute the next macro instruction. As shown in Figure 3-4, an arrow will appear beside the next instruction to be executed, and the instruction itself will be highlighted.
Chapter 3
Figure 3-9. The Visual Basic Editor shows you which line of code will be
executed next.