1. Campbell NA, Reece JB, Urry LA, Cain ML, Wasserman SA, Minorsky PV,et. al. Biologi. 5thed . Jakarta. Penerbit Erlangga ; 2004.
2. Lesson C. Mempersiapkan Jaringan dalam Buku Ajar Histologi. 5th ed. Jakarta. EGC; 1990:7-8
3. Puspitawati R. Struktur Makroskopik dan Mikroskopik Jaringan Lunak Mulut. Jurnal Kedokteran Gigi Universitas Indonesia. 2003; 10(EdisiKhusus) :462-467.
4. Informasi Umum Yogyakarta [Internet]. Dinas Pendapatan Pengelolaan Keuangan Dan Aset; 2013 [cited 2013 January]. Availaible from: http://www. dppka. jogjaprov. go. id.
5. Perkembangan Jumlah Kendaraan Bermotor Menurut Jenis [Internet]. BadanPusatStatistik; 2011 [cited 2013 January]. Availaible from: http://www. Bps.go.id.
6. Rosin MP. The use of micronucleus test on exfoliated cells to identify anti-clastogenic action in humans: a biological marker for the efficacy of chemopreventive agents. Mutation Research. 1992; 267: 265-276.
7. Fenech M, Morley AA. Cytokinesis-block micronucleus method in human lymphocytes: effect of in vivo ageing and low dose X-irradiation. Mutat. Res. 1986; 161: 193-198.
8. Pasorong, Mery B. Hubungan antara kadar plumbum (Pb) dan hipertensi pada polisi lalulintas di kota Manado. Pascasarjana Universitas Gajah Mada Yogyakarta. 2007:81-88.
9. Palar H. Pencemaran dan toksikologi logam berat. 2nd. Jakarta: RinekaCipta; 2004. p. 10-62.
10. Sabki. Hubungan masa kerja, lama kerja, lokasi kerja dengan kadar timbale dalam urine petugas pencatat waktu angkutan kota Yogyakarta. Pascasarjana Universitas Gajah Mada Yogyakarta. 2003:10-13.
11. Fardiaz S. Polusi air danudara. 11th ed. Yogyakarta: Kanisius; 2006. p. 58-65 12. Nina H, Claudia B, Micheline K, Stefano B, Errol Z, Siegfried K. The
micronucleus assay in human buccal cell as a tool for biomonitoring DNA damage : The HUMN project perspective on current status and knowledge gaps. Elsevier. 2008; 16-30
13. Dorland W. KamusKedokteran. 29thed. Jakarta: EGC; 2002. p. 910
14. John V. Genetic stability and instability in tumours. West Sussex: EllisHorwood Limited;1990. p. 9-18
15. Erik W. Cell genotoxicity. West Sussex : Ellis Horwood Limited; 1990. p. 130-157.
16. Pencemarantimbal [Internet]. BadanPengelolaanLingkunganHidup;2013 [cited 2013 January]. Available from: http://www. bplhdjabar. go. id.
17. Agustina T. Toksisitas kronis [Internet]. c2010 [cited 2013 Feb 03]. Available from: http://www. scribd. com/doc/39250782/Toksisitas-Kronis
18. BAPPENAS Provinsi Jawa Tengah. Atlas kualitasudara. Pemerintah Provinsi Jawa Tengah, 2006: 28-33.
19. Hartwig A, Schwerdtle T. Interactions by carcinogenic metal compounds with DNA repair processes: toxicological implications. Toxicol. Lett. 2002 ;127(1-3) :47-54
20. Kliegman RM, Behrman RE. Nelson Ilmu Kesehatan Anak. 15thed. Jakarta. EGC: 2000:231-234.
22. Nordberg G. Metal : Chemical properties and toxicity. In :StellmanJm (ed). Encyclopedia of Occupational Health and Safety. 4th ed. Geneva : ILO;1998.
23. Ladeira C, Viegas S, Prista J, Gomes MC, Brito M. Effects of age and gender on peripheral lymphocyte micronucleus. European Journal of Cancer. 2010; 8(5) : 30
24. Catalan J, Autio K, Kuosma E, NorppaH. Age-dependent inclusion of sex chromosomes in lymphocyte micronuclei of man. Am. J. Hum. Genet. 1998; 63:1464
25. Handoko R. Statistik Kesehatan. Jogjakarta. Mitra Cendekia Press Yogyakarta. 2008:49-55
LAMPIRAN 1
Tabel 7. Tabel Deskripsi Hasil Pengamatan Jumlah Mikronukleus Pedagang Kaki Lima
Descriptives
kelompok Statistic Std. Error
jumlah mikronukleus pklwanita Mean 12. 6129 . 52400 95% Confidence Interval for
Mean Lower Bound 11. 5428 Upper Bound 13. 6831 5% Trimmed Mean 12. 6254 Median 13. 0000 Variance 8. 512 Std. Deviation 2. 91750 Minimum 7. 00 Maximum 18. 00 Range 11. 00 Interquartile Range 5. 00 Skewness -. 132 . 421 Kurtosis -. 791 . 821 kontrol Mean 12. 1333 . 65519
95% Confidence Interval for Mean Lower Bound 10. 7933 Upper Bound 13. 4733 5% Trimmed Mean 12. 0741 Median 12. 0000 Variance 12. 878 Std. Deviation 3. 58862 Minimum 6. 00 Maximum 19. 00 Range 13. 00 Interquartile Range 5. 25 Skewness . 287 . 427 Kurtosis -. 655 . 833
Tabel 8.Tabel Output SPSS Hasil Uji Normalitas Shapiro-Wilk Frekuensi Mikronukleus
Tests of Normality
kelompok
Kolmogorov-Smirnova Shapiro-Wilk
Statistic df Sig. Statistic df Sig. jumlah mikronukleus pklwanita . 102 31 . 200* . 972 31 . 575
kontrol . 091 30 . 200* . 969 30 . 499 a. Lilliefors Significance Correction
*. This is a lower bound of the true significance.
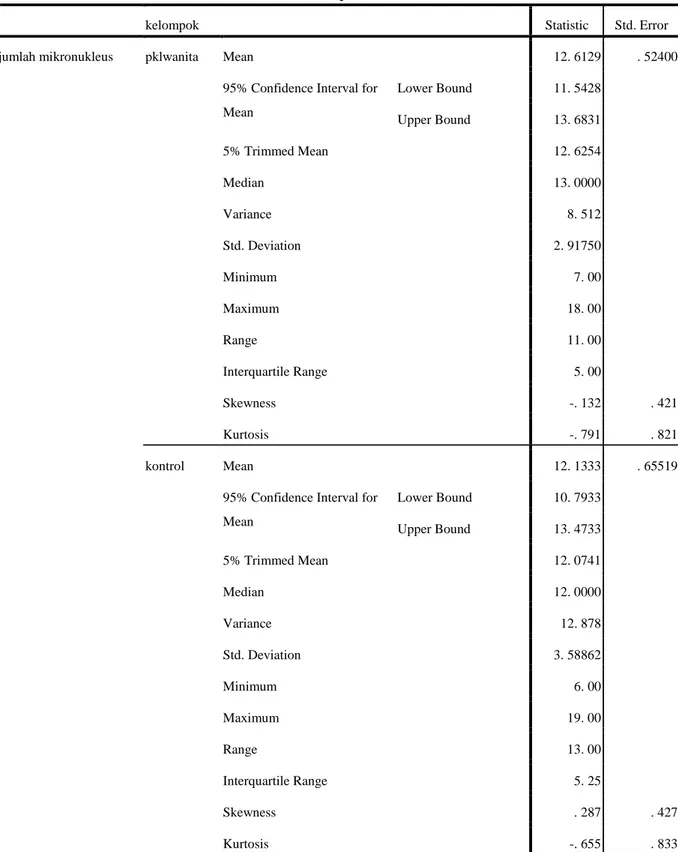
Tabel 9.Tabel output SPSS Hasil Uji Normalitas Shapiro-Wilk Lama Masa Kerja
Tests of Normality
Kolmogorov-Smirnov(a) Shapiro-Wilk
Statistic df Sig. Statistic df Sig. masa kerja
. 127 31 . 200(*) . 955 31 . 210 *This is a lower bound of the true significance.
LAMPIRAN 3
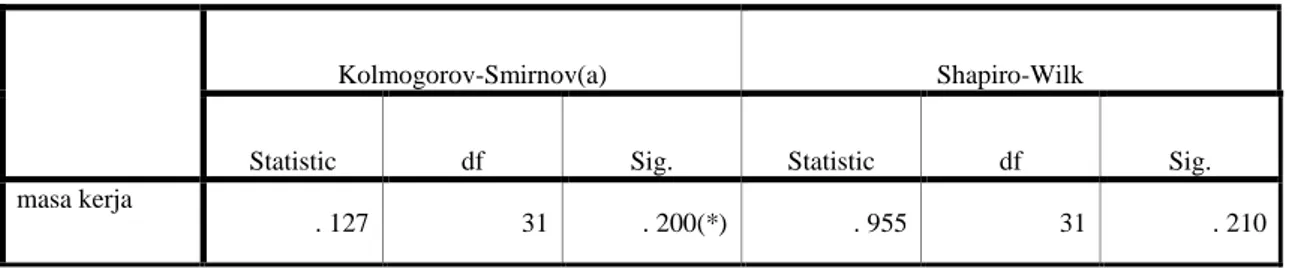
Tabel 10.Tabel Output SPSS Hasil Uji t Independent Frekuensi Pembentukan
Mikronukleus
Tabel 11. Tabel Output SPSS Hasil Uji Korelasi Pearson
Correlations
masa kerja
jumlah mikronukleus masa kerja Pearson Correlation 1 . 963(**)
Sig. (2-tailed) . 000
N 31 31
jumlah mikronukleus Pearson Correlation . 963(**) 1 Sig. (2-tailed) . 000
N 31 31
**Correlation is significant at the 0. 01 level (2-tailed).
Independent Samples Test Levene's Test for
Equality of Variances t-test for Equality of Means
F Sig. t df Sig. (2-tailed) Mean Difference Std. Error Difference 95% Confidence Interval of the Difference Lower Upper jumlah mikron ukleus Equal variances assumed 1. 054 . 309 . 574 59 . 568 . 47957 . 83611 -1. 19347 2. 15261 Equal variances not assumed . 572 55. 868 . 570 . 47957 . 83896 -1. 20115 2. 16029
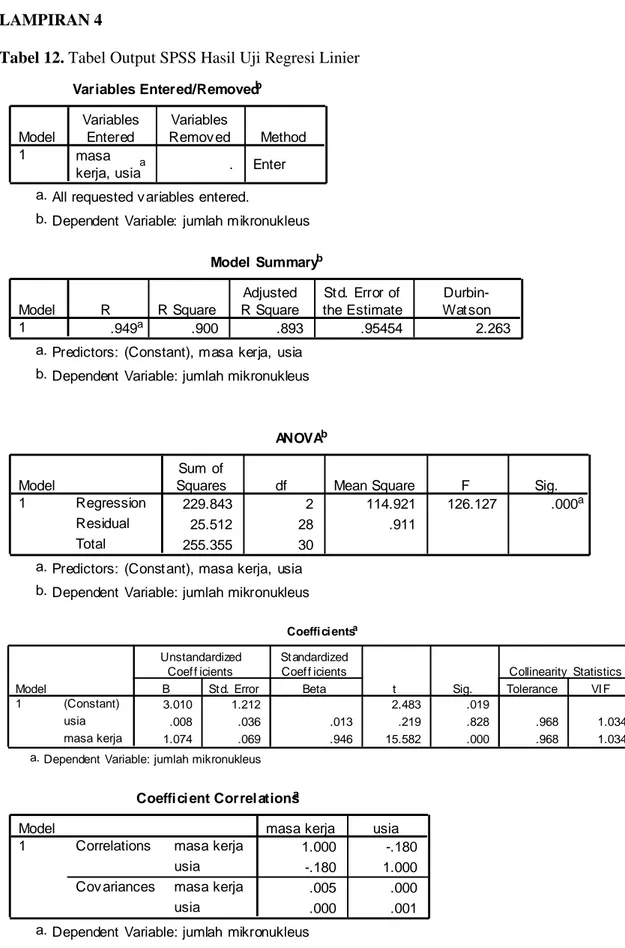
Tabel 12. Tabel Output SPSS Hasil Uji Regresi Linier
Variables Entered/Removedb
masa
kerja, usiaa . Enter
Model 1 Variables Entered Variables Remov ed Method
All requested v ariables entered. a.
Dependent Variable: jumlah mikronukleus b. Model Summaryb .949a .900 .893 .95454 2.263 Model 1 R R Square Adjusted R Square St d. Error of the Estimate Durbin-Wat son
Predictors: (Constant), masa kerja, usia a.
Dependent Variable: jumlah mikronukleus b. ANOVAb 229.843 2 114.921 126.127 .000a 25.512 28 .911 255.355 30 Regression Residual Total Model 1 Sum of
Squares df Mean Square F Sig.
Predictors: (Const ant), masa kerja, usia a.
Dependent Variable: jumlah mikronukleus b. Coeffi ci entsa 3.010 1.212 2.483 .019 .008 .036 .013 .219 .828 .968 1.034 1.074 .069 .946 15.582 .000 .968 1.034 (Constant) usia masa kerja Model 1 B St d. Error Unstandardized Coef f icients Beta St andardized Coef f icients t Sig. Tolerance VI F Collinearity Statistics
Dependent Variable: jumlah mikronukleus a.
Coeffi ci ent Correl ationsa
1.000 -.180 -.180 1.000 .005 .000 .000 .001 masa kerja usia masa kerja usia Correlations Cov ariances Model 1
masa kerja usia
Dependent Variable: jumlah mikronukleus a.
8
LAMPIRAN 5
Colli neari ty Diagnosticsa
2.937 1.000 .00 .00 .01 .051 7.562 .05 .08 .98 .011 16.239 .94 .92 .01 Dimension 1 2 3 Model 1 Eigenv alue Condit ion
Index (Constant) usia masa kerja
Variance Proportions
Dependent Variable: jumlah mikronukleus a. Casewi se Diagnosticsb .213 12.00 11.7964 .20356 1.219 13.00 11.8360 1.16402 -.670 8.00 8.6391 -.63907 1.942 18.00 16.1460 1.85402 1.134 14.00 12.9174 1.08256 -.994 12.00 12.9491 -.94907 .268 10.00 9.7442 .25575 .089 12.00 11.9151 .08494 -.024 14.00 14.0226 -.02261 1.707 7.00 5.3710 1.62901 -1.788 9.00 10.7071 -1.70708 -.178 16.00 16.1697 -.16970 .411 9.00 8.6074 .39256 .097 12.00 11.9072 .09285 -1.846 9.00 10.7624 -1.76244 1.211 13.00 11.8439 1.15611 .928 17.00 16.1143 .88565 -.843 11.00 11.8044 -.80435 -.961 12.00 12.9174 -.91744 -1.115 14.00 15.0645 -1.06452 -.161 16.00 16.1539 -.15388 -.109 15.00 15.1041 -.10406 -.703 8.00 8.6707 -.67070 -.043 15.00 15.0408 -.04080 .928 17.00 16.1143 .88565 -.868 11.00 11.8281 -.82808 .392 10.00 9.6256 .37437 1.137 13.00 11.9151 1.08494 -.076 15.00 15.0724 -.07243 -.142 15.00 15.1357 -.13569 -1.157 14.00 15.1041 -1.10406 . . . . Ma . . . . Ma . . . . Ma . . . . Ma . . . . Ma . . . . Ma . . . . Ma . . . . Ma . . . . Ma . . . . Ma . . . . Ma . . . . Ma . . . . Ma . . . . Ma . . . . Ma . . . . Ma . . . . Ma . . . . Ma . . . . Ma . . . . Ma . . . . Ma . . . . Ma . . . . Ma . . . . Ma . . . . Ma . . . . Ma . . . . Ma . . . . Ma . . . . Ma . . . . Ma Case Number 1 2 3 4 5 6 7 8 9 10 11 12 13 14 15 16 17 18 19 20 21 22 23 24 25 26 27 28 29 30 31 32 33 34 35 36 37 38 39 40 41 42 43 44 45 46 47 48 49 50 51 52 53 54 55 56 57 58 59 60 61 St d. Residual jumlah mikronukleus Predicted Value Residual St at us Missing Case a.
Dependent Variable: jumlah mikronukleus b. .213 12.00 11.7964 .20356 1.219 13.00 11.8360 1.16402 -.670 8.00 8.6391 -.63907 1.942 18.00 16.1460 1.85402 1.134 14.00 12.9174 1.08256 -.994 12.00 12.9491 -.94907 .268 10.00 9.7442 .25575 .089 12.00 11.9151 .08494 -.024 14.00 14.0226 -.02261 1.707 7.00 5.3710 1.62901 -1.788 9.00 10.7071 -1.70708 -.178 16.00 16.1697 -.16970 .411 9.00 8.6074 .39256 .097 12.00 11.9072 .09285 -1.846 9.00 10.7624 -1.76244 1.211 13.00 11.8439 1.15611 .928 17.00 16.1143 .88565 -.843 11.00 11.8044 -.80435 -.961 12.00 12.9174 -.91744 -1.115 14.00 15.0645 -1.06452 -.161 16.00 16.1539 -.15388 -.109 15.00 15.1041 -.10406 -.703 8.00 8.6707 -.67070 -.043 15.00 15.0408 -.04080 .928 17.00 16.1143 .88565 -.868 11.00 11.8281 -.82808 .392 10.00 9.6256 .37437 1.137 13.00 11.9151 1.08494 -.076 15.00 15.0724 -.07243 -.142 15.00 15.1357 -.13569 -1.157 14.00 15.1041 -1.10406 . . . . Ma . . . . Ma . . . . Ma . . . . Ma . . . . Ma . . . . Ma . . . . Ma . . . . Ma . . . . Ma . . . . Ma . . . . Ma . . . . Ma . . . . Ma . . . . Ma . . . . Ma . . . . Ma . . . . Ma . . . . Ma . . . . Ma . . . . Ma . . . . Ma . . . . Ma . . . . Ma . . . . Ma . . . . Ma . . . . Ma . . . . Ma . . . . Ma . . . . Ma . . . . Ma Case Number 1 2 3 4 5 6 7 8 9 10 11 12 13 14 15 16 17 18 19 20 21 22 23 24 25 26 27 28 29 30 31 32 33 34 35 36 37 38 39 40 41 42 43 44 45 46 47 48 49 50 51 52 53 54 55 56 57 58 59 60 61 St d. Residual jumlah mikronukleus Predicted Value Residual St at us Missing Case a.
Dependent Variable: jumlah mikronukleus b.
Residual s Stati sticsa
5.3710 16.1697 12.6129 2.76793 31 -1.76244 1.85402 .00000 .92218 31 -2.616 1.285 .000 1.000 31 -1.846 1.942 .000 .966 31 Predicted Value Residual St d. Predicted Value St d. Residual
Minimum Maximum Mean St d. Dev iation N
Dependent Variable: jumlah mikronukleus a.
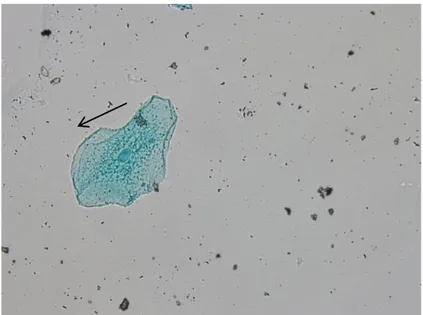
Gambar 7. Sel dengan mikronukleus pada kelompok pedagang kaki lima wanita
LAMPIRAN 7
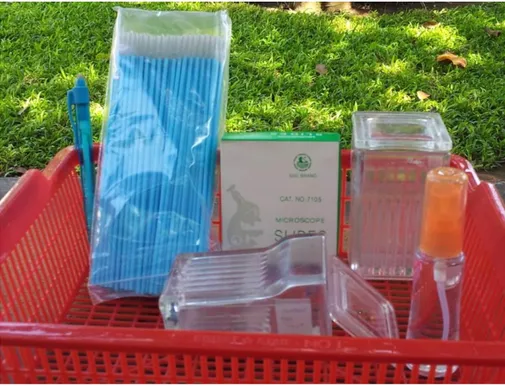
Gambar 9. Alat-alat yang dibutuhkan untuk mengambil apusan
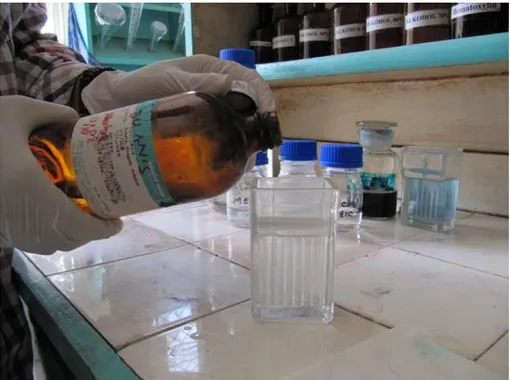
Gambar 11.Proses Fiksasi Preparat Dengan Methanol-Asetat
LAMPIRAN 9
Gambar 13.Proses Pengecatan Dengan Reagen Schiff
BIODATA MAHASISWA
Identitas
Nama : Astrid Karina Putri
NIM : G2A009189
Tempat/tanggal lahir : Boyolali/13 Januari 1991 Jenis kelamin : Perempuan
Alamat : Jalan Sinabung II No 60 Nomor Telpon : (024) 8506866
Nomor HP : 085641133146
E-mail : Astridkarina1301@yahoo. com
Riwayat Pendidikan Formal
a)SD : SDN Ungaran 01-03-06 Lulus tahun 2003
b)SMP : SMPN 2 Semarang Lulus tahun 2006
c)SMA : SMAN 3 Semarang Lulus tahun 2009
d)FKUNDIP : Masuk tahun 2009
Keanggotaan Organisasi
1. BEM Fakultas Kedokteran Undip bidang PSDM
Pengalaman penelitian
Pengaruh Masa Kerja Terhadap Pembentukan Mikronukleus Akibat Paparan Timbal Pada Pedagang Kaki Lima Di Yogyakarta