COVID-19 and Indian
Economy: Impact on Growth,
Manufacturing, Trade and
MSME Sector
Pravakar Sahoo
1and Ashwani
2 AbstractThe study aims to make an assessment of COVID-19 on Indian economy by analysing its impact on growth, manufacturing, trade and micro, small and medium enterprises (MSME) sector, and highlights key policy measures to control the possible fallout in the economy. The impact of the pandemic across sectors and in different scenarios of complete, extended and partial lockdown, and at different levels of capacity utilization is massive on the Indian economy. India’s economy may barely manage to have a positive growth of 0.5 per cent in an optimistic scenario but also faces the possibility of a 3–7 per cent negative growth in worst case scenarios for the calendar year 2020. The impact is severe on trade, manufacturing and MSME sectors. The likely impact (deceleration) of COVID-19 from best case scenario to worst scenario are as follows: manufacturing sector may shrink from 5.5 to 20 per cent, exports from 13.7 to 20.8 per cent, imports from 17.3 to 25 per cent and MSME net value added (NVA) from 2.1 to 5.7 per cent in 2020 over previous year. The economy is heading towards a recession and the situation demands systematic, well targeted and aggressive fiscal-monetary stimulus measures.
Keywords
COVID-19, lockdown, gross value added, manufacturing and trade
Introduction
The COVID-19 pandemic has probably given the biggest blow to the world economy after the great depression of 1930s. Around 60 per cent of the world population is either under severe or partial lockdown without having medical solution to the coronavirus and economic activity across countries has either stalled or significantly decelerated taking away millions of livelihoods. As a result of the pandemic, the global economy is projected to contract sharply by −4.9 per cent in 2020, much worse than during
Global Business Review 21(5) 1159–1183, 2020 © 2020 IMI Reprints and permissions: in.sagepub.com/journals-permissions-india DOI: 10.1177/0972150920945687 journals.sagepub.com/home/gbr
1 Institute of Economic Growth (IEG), New Delhi, Delhi, India. 2 National Institute of Technology (NIT), Kurukshetra, Haryana, India. Corresponding author:
Pravakar Sahoo, Institute of Economic Growth (IEG), New Delhi, Delhi 110007, India. E-mail: pravakarfirst@gmail.com
the 2008–2009 financial crisis (International Monetary Fund [IMF], 2020).1 India being densely
populated country with inadequate medical facilities was left with no option but to follow the policy of lockdown. World economy is heading for a recession and India is no exception. The current pandemic is working its way through a highly globalized world with interconnected production networks and financial markets. The fall out of the COVID-19 on Indian economy is going to be huge because of its own lockdown, which was necessary to contain the spread of coronavirus, and also because of India’s integration with the rest of the world. Here is an assessment of the likely fall out of lockdown and restrictive policy measures owing to the pandemic on India’s gross value added (GVA), manufacturing, trade and micro, small and medium enterprises (MSME) sector. The study has five sections which are as follows: the second section presents the review of literature; the third section covers the research methodology; the fourth section discusses the impact assessment; and the fifth section concludes with policy implications.
Review of Literature
The ongoing COVID-19 pandemic is causing unprecedented disruptions to economic activities across countries, and India is no exception. The pandemic has severely affected and continues to disrupt global value chains (GVCs), domestic production network, trade, services and MSMEs thereby affecting overall growth and welfare. The current pandemic is working its way through a highly globalized world with interconnected financial markets and production networks. The complete lockdown and currently the ongoing partial lockdowns have both demand-side and supply-side effects on the Indian economy. On the supply side, the restrictions of movement of goods, services and personnel affects the production networks. The plunge in economic activities and overall output growth leads to employment loss. The supply shocks will further create demand-side effects by reducing the economy’s disposable income, savings and giving rise to unwanted uncertainty.
Therefore, the economic impact of COVID-19 is expected on every sphere including growth, international trade, financial markets, unemployment, income, poverty and many more variables. The impact of the virus spread is expected to lead to a huge loss as global trade is severely affected. The Indian growth model depends on the export-led-growth (Mishra, 2019), and hence can experience massive impact on growth due to lockdown amidst the virus spread. On the international trade front, it is expected to plunge in a range of 13–32 per cent under optimistic and pessimistic scenarios, respectively (WTO, 2020). In another estimation, McKibbin and Fernando (2020) utilized the computable general equilibrium (CGE) modelling and reported that global GDP would be reduced by around US$2.4 trillion in 2020 under a low-end pandemic considering the Hong Kong Flu as a reference point. However, the fall can extend to the tune of over US$9 trillion in 2020 in case of a serious outbreak similar to the Spanish flu. Ozili and Arun (2020) noted the spill over effects of COVID-19 and hailed that the social distancing measure of virus controlling led to the shutdown of financial markets, corporate offices, businesses and events which in turn may have significant impact on economic growth. As per the International Labour Organization (ILO) estimation, the total value added of industrial enterprises in China declined by 13.5 per cent during the first 2 months of 2020 (National Bureau of Statistics of China, 2020). There are many projections and estimations by institutions and scholars on the economic fallout of COVID-19 pandemic. Though there are variations in degree and magnitude of the fall out, now there is a reasonable amount of coconscious that the economic impact would be severe on the world economy
and also on Indian economic growth, much more than the global financial crisis (GFC) of 2008. IMF in its latest estimate in June 2020 projected that the global economy may shirk by 4.9 per cent, almost three times more than GFC, and the Indian economy is likely to witness 4.5 per cent negative growth for the 2020.
With regard to the impact on employment and income, ILO (2020) estimated that global unemployment can range between 5.3 million and 24.7 million from a base level of 188 million in 2019 pushing these people towards below poverty line. Most of existing studies have focused on global growth, trade and unemployment, a few are country specific especially India. In this context, the present study aims to make an assessment of COVID-19 on Indian economy and highlights key policy measures to control the possible fallout on the economy. The study contributes the existing literature while analysing the impact on Indian economy with more focus on growth, trade, manufacturing and MSMEs. The detailed procedure of the assessment is reported in the next section.
Methodology
Variables and Data Sources
The present study relies on the secondary data to make an impact assessment of COVID-19 on Indian economy. The data sources are reports of National Account Statistics, a publication of ministry of statistics and programme implementation (MOSPI); Handbook of Statistics on Indian Economy and Monthly Bulletin, Reserve Bank of India; Export–Import Database, Ministry of Commerce, Government of India; and annual reports (various issues), Ministry of Micro Small and Medium Enterprises.
Method of Analysis
There are diverse methodologies of economic growth projections amid different types of economic shocks. There has been a strong debate about the accuracy of growth projections in India, wherein RBI forecast is considered most favourable (Gupta & Minai, 2019). In the present study, the impact assessment of COVID-19 pandemic is carried-out on India’s GVA, manufacturing sector, international trade and MSME sector. The impact is estimated for two broad outlines: first, the situation where there is a quick turnaround after the lockdown period and the economy experiences a vertical recovery (V-shaped). Second, the economy experiences a U-shaped recovery where the effects of the lockdown prolong for a longer period of time till September 2020. In the case of V-shaped recovery, we make two hypothetical scenarios—scenarios A and B. In scenario A, we assume the resumption of normal level of economic activities post 40 days lockdown, that is, after 3 May 2020.2 In scenario B, we consider the complete
lockdown up to 3 May 2020 and 50 per cent capacity utilization of the economy till 31 May 2020. Similarly, we have two hypothetical scenarios—C and D—in case of U-shaped recovery. In case of scenario C, we assume 70 per cent of capacity utilization by 30 June 2020 in addition to 50 per cent capacity utilization from 3 to 31 May 2020. Scenario D where normalcy level is assumed in three phases—50 per cent by end of May, 70 per cent by June and 90 per cent by September 2020, assuming that 10 per cent sectors which are adversely affected may take much time for their resumption. These numbers of capacity utilization are based on partial opening of the economy across sectors and locations,
and the opinions of subject experts. Further, keeping in view the substantial channelization of resources for public administration and health services, the results for four hypothetical scenarios are present with respect to (a) with the over capacity utilization of 50 per cent in the public administration services, hereafter PAD and (b) the normal functioning of PAD services.
Gross Value Added
In order to see the impact on economic growth we take the real GVA based on 2011–2012 prices. This data is available till Q3 of financial year (FY) 2019–2020 at aggregate level as well as for broader categories, viz. agriculture; mining and quarrying; manufacturing; electricity, gas, water supply and other utilities; construction; trade, hotels, transport, communication and services related to broadcasting; financial, real estate and professional services and public administration; and defense and other services. First we take the data quarter-wise for calendar year 2019 (from January to December). We compute the quarterly growth rate (year on year [YoY]) for each sector as well as aggregate GVA for calendar years 2018 and 2019. By taking the average of past 2 years’ quarterly growth (YoY) for each sector, we estimate the quarter-wise GVA for each sector as well as aggregate GVA for the year 2020 with Q1 ending in March and Q4 ending in December 2020. From the estimated values of 2020, we spare three sectors completely from the computation of loss of lockdown amid COVID-19 (Table 1). Rather we assume the 50 per cent overutilization of the health and membership organizations (part of other services) and public administration services.
After excluding the contribution of these above sub-sectors, we compute the loss for each sector under four hypothetical scenarios. After computing the loss for each quarter for every sector, we add-on the total loss of the corresponding sector and further adds up across sectors to find the total estimated loss in GVA. Here we utilize following criterions of presentation to find the impact assessment.
Table 1. List of Sectors and Impact Assessment
Sector Impact Assessment
Agriculture, forestry and fishing Excluded
Mining and quarrying Full impact
Manufacturing Full impact except household manufacturing, manufacture of
food products, beverages and tobacco and manufacture of pharmaceutical, medicinal chemicals and botanical products Electricity, gas, water supply and other utility
services
Excluded
Construction Full impact
Trade, hotels, transport, communication and broadcasting
Full impact except the communication and services related to broadcasting
Financial, real estate and professional services Full impact except assuming that banks; insurance services;
ICT, Scientific, R&D and other administrative services are working with 50% capacity utilization
Public administration, defense and other services
Excluded
1. Percentage decline in GVA for aggregate level while comparing the GVA of 2020 (after loss) with the GVA of 2019 which is actually realized. This computation is done with normal behaviour of PAD as well as overcapacity of PAD (Figure 3).
2. This process is done for sectoral level also to find the potential decline (%) in the GVA for the sectors. However, for simplicity, presentation is done for scenario B with normal behaviour of PAD (Figure 5).
3. We compute the quarterly growth rate (YoY basis) in aggregate GVA (with normal behaviour of PAD as well as overcapacity) under all scenarios, and present for scenarios A and D (Figures 4A and 4B).
4. Then we find the loss of each sector out of the total estimated GVA of 2020. It helps us to find the potential loss in the share of each sector in the aggregate GVA of 2020 (Figure 6). We also present the loss in each sector (%) as compared to the respective sectors’ GVA of 2020 (Figure 7). Manufacturing Sector
In order to find the impact at industry level, we rely on Annual Survey of Industries (ASI) data for registered manufacturing firms. Here we take the average values of net value added for FY 2016, FY 2017 and FY 20183 as base values for estimation. We have the wage expenses as well as fixed cost
components, viz. interest and rent expenses across industries. First we compute the loss for each scenario using the base net value added (NVA) of each industry. The we also compute the cost component (wages as well as fixed cost, assuming these costs to remain with the firm even if without operation amid lockdown) and calculate the cost for each scenario for each industry. Here we have excluded two industries: food products and the pharmaceutical products. We add on the loss of NVA to the cost during lockdown for a particular scenario, and thereby compute the total loss for each industry. Then we take the average NVA of FY 2014, 2015 and 2016 as the previous base of NVA. Presentation is made as follows:
1. Percentage decline in NVA of all industries as compared to previous benchmark period (FY 2014–2017) (Figure 9). Also, we take the NVA loss as per cent of total NVA of base value (FY 2015–2018) (Figure 9).
2. Then we find the composition of NVA loss as per cent of total NVA of base period across industries for scenario B only (Figure 10).
3. Percentage decline in the NVA of each industry while comparing the base period NVA after loss with the NVA of benchmark period (Figure 11).
International Trade
Aggregate trade: We compute the loss of trade in two formats: first, we describe the exposure of India’s exports and imports with the severe coronavirus-affected countries. Second, we compute while following the similar practice as of GVA loss computation.
We are given the values of exports and imports till the first quarter of 2020. Here we estimate the exports and imports from Q2 to Q4 for year 2020 by applying the quarterly growth (YoY) of past year 2019. Then we compute the loss for Q2 and Q3 under scenarios A–D. We do not compute the loss for Q1 of 2020 as the data are already released wherein significant decline is observed due to COVID-19. In case of scenario A, we would be having the loss in exports and imports for only second quarter. With this loss of Q2 we compute the percentage of overall exports/imports of year 2020. Similarly, we calculate the loss of exports for the remaining scenarios. We follow this approach for all the scenarios except
scenario E. In fact, all the scenarios A–D are relevant from India’s trade perspective. However, it is equally important to see the impact on trade when world trade is also experiencing a massive decline. In order to account for the issue, we take the hypothetical scenario E wherein the percentage decline in quarters during the global financial crisis is taken as reference point assuming that the corresponding decline was tuned to the fall in global trade. Exports saw the highest decline of 31.9 per cent in 2009– 2010 Q1 and imports of 31.7 in the next quarter. We consider the lowest decline as weight factor for Q1 of 2020 and then give highest decline as weight to the Q2 and then apply the weights in declining order to the subsequent quarters (Q3 and Q4) of 2020. Then the loss in exports is computed with the weighted average of exports of Q1–Q4 of 2020. Similar exercise is performed for imports while taking the percentage decline in imports of corresponding period of GFC.
The presentation of exports/imports losses are presented three-folds.
1. Percentage decline in exports/imports in CY 20 as compared to the level of CY19 (Figure 12A). 2. The export/import loss as percentage of estimated exports/imports of 2020 (Figure 12B). 3. The quarterly growth rate (YoY) for 2020 and compare them with the growth of corresponding
quarter of previous year 2019 (Figure 13A and B).
Sectoral trade: As similar to manufacturing sector wherein we identify the highest loss bearing industries, we calculate the potential loss across principal commodities to know the most sensitive sectors of international trade amid COVID-19 pandemic. Here we take the average values of exports/imports of 2018–2019 and 2019–2020 (both from April to January) as base values for loss computation. While applying the lockdown of 40 days on the base year values across principal commodities, we compute the nominal loss for each commodity and finally to the all commodities. After computing the loss, we follow three approach for presentation of impact assessment:
1. Percentage decline in exports/imports of base value (average of FY 2019 and FY 2020) as compared to the exports/imports of previous benchmark period (average of FY 2017 and FY 2018) (Figure 14).
2. We compute the aggregate loss in exports/imports as per cent of total exports/imports of 2020 and call it as national level loss in exports/imports. Then we compute the loss in exports/imports as percentage of the exports/imports of respective sector. The commodities bearing the loss higher than the national average are most sensitive from trade perspective amid the COVID-19 pandemic (Figure 16).
Micro, Small and Medium Enterprises Sector
We compute the estimated loss in MSME sector using the latest data of MSMEs’ real GVA for the year 2016–2017. The real GVA is obtained by applying the GVA deflator of base year 2011–2012. The impact assessment for MSME sector is based on two step process. First we compute the GVA for manufacturing and services sector by applying the weights of shares in the number of total establishments under the two segments (manufacturing and services). After computing the GVA of these two sectors we find the percentage share of each in the national manufacturing and services GVA. Then using the estimated values of percentage decline of these two sectors computed using the quarterly data for 2020 in the first section, we compute the corresponding decline for MSME. The aggregate impact on MSME is computed through weighted average of MSMEs’ manufacturing and services sectors’ losses. Presentation is made as (a) percentage decline in GVA of MSME sector using the reference loss of aggregate GVA of India
carried out in first section (Figure 18) and (b) fall in growth rate in real GVA of MSME. We compute it by excluding the GVA loss (%) from the average growth of FY 2016 and FY 2017 (Figure 17).
Impact Assessment
Impact on Growth
COVID-19 pandemic has it the Indian economy when it is at its lowest point of growth trajectory over last 6 years due to lack of aggregate demand—consumption, private investment and exports witnessing deceleration over the last few years. When all were expecting a turnaround in the economy, the COVID-19 pandemic has almost given a knocking punch affecting economic activity across the sectors and added a supply shock to the economy. The quarterly growth (YoY) of GVA has been consistently declining (Figure 1) since first quarter of 2018 (from approximately 8% in Q1 in calendar year (CY) 2018 to 4.5% in Q4 CY 20194). Mining and quarrying witnessed the highest fall in recent quarters
followed by manufacturing and construction sector.
-10 -5 0 5 10 15
GVA Growth Agriculture, forestry & fishing Mining & quarrying Manufacturing Construction Trade, hotels, transport, communication and
services related to broadcasting Financial, real estate & professional services
Figure 1: Quarterly Growth Rate in GVA Across Sectors (YoY, %)
2019 Q4 2019 Q3 2019 Q2 2019 Q1 2018 Q4 2018 Q3 2018 Q2 2018 Q1
Figure 1. Quarterly Growth Rate in GVA Across Sectors (YoY, %) Source: Authors’ computations from NAS Data.
-4.00 -2.00 0.00 2.00 4.00 6.00 8.00 10.00 12.00 GVA Growth (YoY)
Agriculture, forestry & fishing Mining & quarrying Manufacturing Electricity, gas ,water supply& other utility …
Construction Financial, real estate & professional services
Public administration, defence and Other …Normal
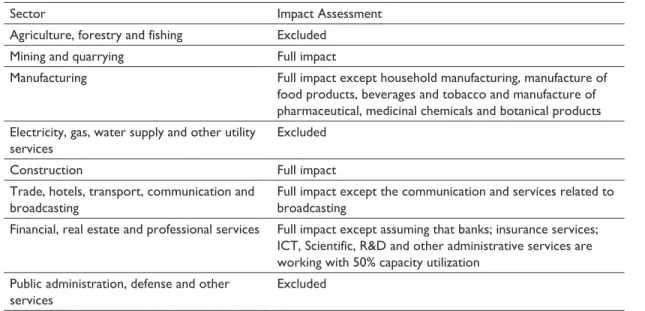
2020 (Normal) 2019 Figure 2. GVA Growth in Normal Condition
Figure 2 presents the expected percentage increase in GVA in 2020 over 2019 across sectors in normal times i.e. without COVID-19. The GVA would have increased by 5.82 per cent in 2020 mainly led by PAD services (9.27%), electricity, gas and utilities (7.1%); trade, hotels and restaurants and financial services (around 6.7%, each); construction (5.8%); manufacturing (4.4%), agriculture (3.3%) and mining and quarrying to register a fall (1.5%).
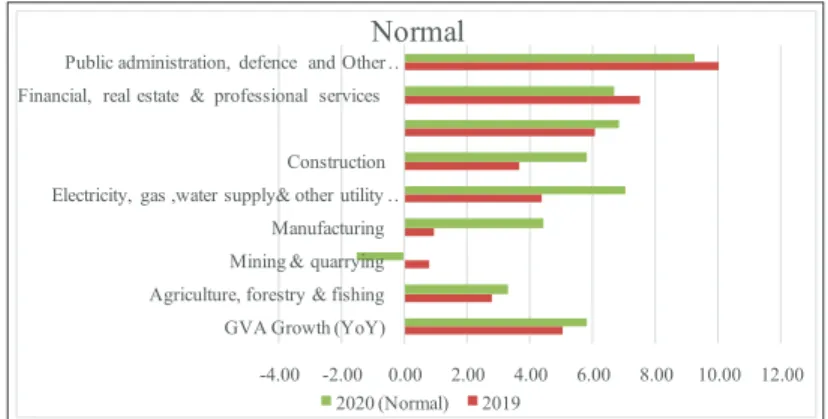
The impact of Corona outbreak and subsequent lockdown on GVA5 at aggregate as well as broad
sectors for the calendar year 2020 over previous year is reported in Figure 3. In case of vertical recovery under scenarios A and B, the GVA is estimated to grow at 2.95 per cent and 0.43 per cent, respectively6
(with 50% over utilization of PAD).
We believe that scenario B (0.43% growth for 2020) is the most likely scenario as the lockdown has been extended till 17 May with some relaxation. The fall in GVA is estimated at −1.37 per cent and −2.96 per cent for 2020 compared to 2019 under scenarios C and D if we experience a U-shaped recovery. However, in case of more pessimistic environment where there is no over utilization of public administration and services sector (PAD), the deceleration would be in the range of 1.3 per cent in scenario A to 7.2 per cent under scenario D. In most likely scenario B, the deceleration can be 3.8 per cent in year 2020 (Figure 3).
Overall, our assessment throws a picture where the growth may vary from near 0 to −7 per cent in best- and worst-case scenario. We believe India’s GDP may shrink in the range of 3–5 per cent in CY 2020. The fallout in economic growth is grounded on the weak response of economic fundamentals. Most importantly the sluggish demand in the country and globe amid shutdown will be a pull factor for slowdown. With rising uncertainties, the deferment of investment is most likely which in turn reduces the employment opportunities and further lowers the disposable income thereby pressing the demand on
Figure 3. COVID-19 Impact: GVA 2020 over 2019 (%) Source: The authors.
lower side (see, Garg & Sahoo, 2020). The unemployment due to COVID-19 pandemic runs into millions across countries. Further, there is mounting pressure from supply side as the lock-down in India and across the countries has given a severe shock to supply chain (Ozili & Arun, 2020). The domestic production networks are experiencing the shortage of raw materials, components and forced to bear the higher cost. The manual labour supply chain has been badly disrupted and the close down of industries may also lead to loss of skills who are tuned to industrial processes. Therefore, the negative growth for the CY 2020 looks feasible. The banking sector—the major financer to economic activities and backbone of India’s financial sector—may witness rising NPAs with falling revenues of the corporate sector, MSMEs and falling income of households. The bad balance sheet with rising NPAs will limit the credit flow thereby undermining the effect of liquidity measures taken by RBI in terms of selling bonds to the banks and reducing the repo rate.
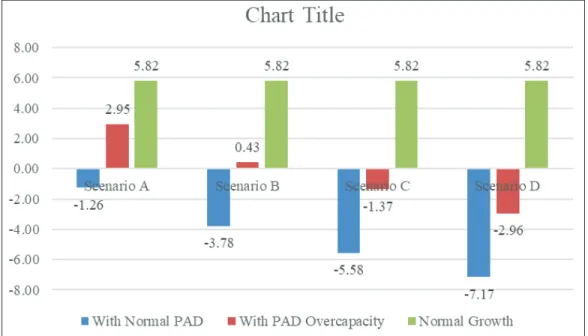
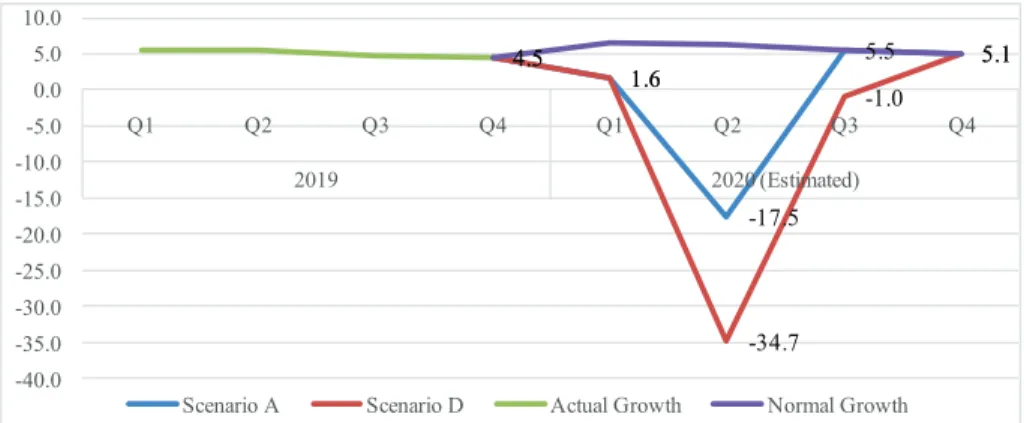
The estimated quarterly growth rate (YoY) of real GVA with normal and 50 per cent overutilization of PAD services is reported in Figures 4A and 4B. Indian economy had 5 per cent growth rate for the calendar year 2019 but the growth is expected to decelerate in second quarter of 2020 to the tune of 13 per cent under scenario A and around 30 per cent under scenario D (Figure 4A). With the assumption of normal functioning of public administration sector, the numbers can further go down to 17.5 per cent and 34.7 per cent in the second quarter under scenarios A and D (Figure 4B).
Figure 5 presents the deceleration across sectors in the year 2020 as compared to 2019 under scenarios B and D. Here we assume sectors such as agriculture; electricity, gas and utility services and PAD services behave in normal condition and the corresponding growth can be 3.3 per cent, 7.1 per cent and 9.3 per cent in the year 2020.7 But now with the COVID-19 pandemic, the growth is expected to decelerate (scenario B) by 10.2 per cent for manufacturing and construction each, and 7.6 per cent and 5.2 per cent for trade. There are two broad sectors one is trade, hotels and restaurant and second is the financial and real estate services. So please take the trade, hotels and restaurant sector in collective form. The deceleration is much more under scenario D where major sectors like manufacturing (−15.19%), financial and real estate services (9.7%) and trade, hotels and restaurant services (12.55%) are expected to slow down significantly.
4.5 5.8 -13.6 5.5 5.1 4.5 5.8 -30.8 3.3 5.1 -35.0 -30.0 -25.0 -20.0 -15.0 -10.0 -5.0 0.0 5.0 10.0 Q1 Q2 Q3 Q4 Q1 Q2 Q3 Q4 2019 2020 (Estimated)
Scenario A Scenario D Actual Growth Normal Growth
Figure 4A. Quarterly Growth with 50 per cent More of PAD Source: The authors.
4.5 1.6 -17.5 5.5 5.1 4.5 1.6 -34.7 -1.0 5.1 -40.0 -35.0 -30.0 -25.0 -20.0 -15.0 -10.0 -5.0 0.0 5.0 10.0 Q1 Q2 Q3 Q4 Q1 Q2 Q3 Q4 2019 2020 (Estimated)
Scenario A Scenario D Actual Growth Normal Growth
Figure 4B. Quarterly Growth in GVA with Normal PAD Source: The authors.
-3.78 3.32 -17.08 -10.17 7.07 -10.17 -7.60 -5.22 9.27 -20.00 -15.00 -10.00 -5.00 0.00 5.00 10.00 15.00 GVA Agriculture & Allied Mining & quarrying Manufacturing Electricity, gas, water, etc Construction Trade, hotels, transport, communication, etc Financial, real estate, etc PAD
Scenario B
-7.17 3.32 -21.84 -15.19 7.07 -15.53 -12.55 -9.70 9.27 -25.00 -20.00 -15.00 -10.00 -5.00 0.00 5.00 10.00 15.00 GVA Agriculture & Allied Mining & quarrying Manufacturing Electricity, gas, water, etc Construction Trade, hotels, transport, communication, etc Financial, real estate, etc PADScenario D
Figure 5. Sectoral Deceleration (%) in GVA (2020 over 2019) Source: The authors.
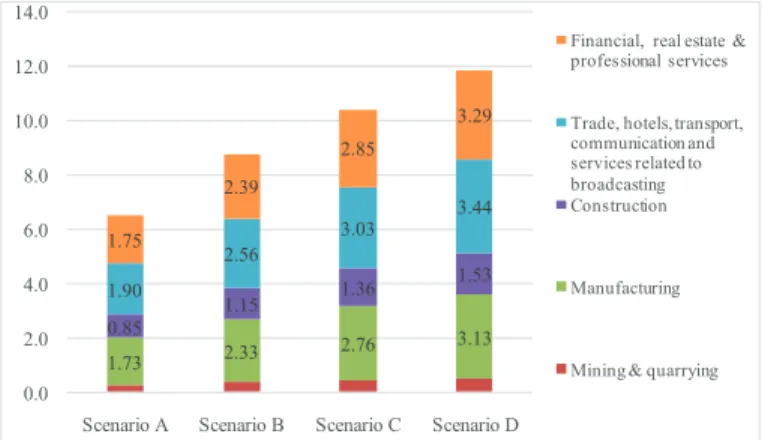
The percentage fall in the shares of different sectors in total GVA and percentage fall in the respective sectors’ GVA for 2020 under different scenarios assuming the over capacity of PAD services is reported in Figures 6 and 7, respectively. In case of V-shaped recovery (scenarios A and B), the total estimated GVA loss by these sectors are 6.5 per cent and 8.8 per cent respectively while under U-shaped recovery (scenarios C and D) the loss would be around 10.44 per cent and 11.88 per cent, respectively, for the year 2020 (Figure 6). Across the scenarios (A–D), the share of decline of sectors in total GVA varies in the range of 1.9 per cent to 3.4 per cent for trade, hotels and restaurant, 1.7 per cent to 3.1 per cent for manufacturing, 1.7 per cent to 3.2 per cent for financial real estate and professional services and, 0.8 per cent to 1.5 per cent for construction and 0.3 per cent to 0.5 per cent for mining and quarrying. In terms of expected fall in respective sectors’ GVA, following are ranges starting from scenarios A–D, viz. 11.8–20.7 per cent 8 for mining and quarrying sector; 11–20 per cent for construction 10–18.8 per cent
for manufacturing; 10–18 per cent for trade and hotels services; and 8–15 per cent for finance, real estate and professional services (Figure 7).
1.73 2.33 2.76 3.13 0.85 1.15 1.36 1.53 1.90 2.56 3.03 3.44 1.75 2.39 2.85 3.29 0.0 2.0 4.0 6.0 8.0 10.0 12.0 14.0
Scenario A Scenario B Scenario C Scenario D
Financial, real estate & professional services
Trade, hotels, transport, communication and services related to broadcasting Construction
Manufacturing
Mining & quarrying
Figure 6. Decline in Total GVA by Sectors (%) Source: Authors’ computations based NAS Data.
0.00 10.00 20.00 30.00
Mining & quarrying Manufacturing Construction Trade, hotels, transport, communication and
services related to broadcasting Financial, real estate & professional
services
Scenario D Scenario C Scenario B Scenario A
Figure 7. Decline in Respective Sectpors GVA (%) Source: Authors’ computations based NAS Data.
Our assessment reveals a pessimistic picture for aggregate GVA and across broad sectors. The impact on trade, hotels and restaurant are inevitable amid overall slowdown of economic activities, massive plummet of global trade and the social distancing. The estimated fall in financial services, real estate and professional services looks realistic given the overall expected slowdown, as the performance of these sectors depends on economic activities across other sectors. Moreover, with poor balance sheet of corporate and household sectors, financial services would remain vulnerable in the possibility of growing NPAs, and thereby fueling the problem of liquidity crunch, eventually impeding the supply side issues in the economic activities.
Construction sector has been on the downturn since 2012 and more so in last couple of years9 due to
slowing demand, twin balance sheets problems in both corporate sector and banking sectors, delayed projects and new regulation (RERA act 2016). The fall in construction sector affects core sectors like steel, power and coal. Therefore, the backward linked sector like mining and quarrying has been affected and will continue to get affected in FY 20,21 due to COVID-19 pandemic. Now with the lockdown, the uncertainty has increased wherein people prefer to postpone the big ticked purchases thereby dissuading the demand further. The pressure on construction sector is also mounting with global trade situations where imports are getting difficult and also expensive due to weaker rupee.10 In this environment of
sluggish demand, the pass-through effect of increased input cost is not feasible. Besides, more than 30 per cent construction workers are staying away from work sites due to fear over Coronavirus infection, thereby adding the problem of the sector to resume the new normalcy. The expected fall in manufacturing is obvious due to shut down of firms during lockdown, slowdown of demand, shock to both local and global supply chain, displacement of manual labour force, etc.
Impact on Manufacturing
In this section we explore the economic loss to the industries due to the epidemic across industries using ASI data for registered manufacturing sector. The economic loss is calculated by adding the wages cost and fixed cost—interest and rent expenses—to the NVA of respective industry. The analysis section first covers the normal behaviour of industry without COVID-19 (Figure 8). Then we discuss the impact on two fronts—percentage decline in base NVA at aggregate level (Figure 9) as well as across industries (Figure 11) as compared to previous comparable period. Second we present the loss as per cent of NVA of the base year—both at aggregate level and across industries (Figures 9 and 10).
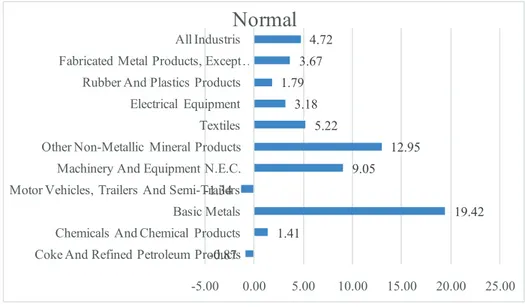
The manufacturing industries would have reported the growth rate of around 4.7 per cent in terms of NVA over the benchmark period (average NVA of 2014–2017) without COVID-19. Across these industries, it is expected that the basic metal industries would have grown with a rate of 19 per cent, followed by non-metallic mineral products (13%); machinery and equipment (9%); and textiles (5.2%), among others (Figure 8).
The deceleration11 in terms of economic cost to the NVA for all industries, the estimated values are 5.5
per cent and 19.8 per cent for base case and worst case scenario, respectively (Figure 9). The expected deceleration in the NVA is 10.2 per cent under scenario B. The loss in industrial NVA (all industries) as percentage of the base NVA is estimated at 13.5 per cent to 27.8 per cent for base case scenario (scenario A) and worst case scenario (scenario D). Interestingly the top 10 industries which contribute around two-thirds of the total industrial NVA, bear the loss in NVA in the range of 11.1–19.6 per cent of the total NVA of base year. Top 10 industries contribute 65 per cent of total industrial sector NVA, absorb 55 per cent of all industrial workers (55%) and bear significant fixed cost, around 70 per cent of total interest and rent cost of all industries.
-0.87 1.41 19.42 -1.34 9.05 12.95 5.22 3.18 1.79 3.67 4.72 -5.00 0.00 5.00 10.00 15.00 20.00 25.00
Coke And Refined Petroleum Products Chemicals And Chemical Products Basic Metals Motor Vehicles, Trailers And Semi-Trailers Machinery And Equipment N.E.C. Other Non-Metallic Mineral Products Textiles Electrical Equipment Rubber And Plastics Products Fabricated Metal Products, Except …
All Industris
Normal
Figure 8. Growth in NVA Across Industries (%) Source: Authors computations from ASI Data.
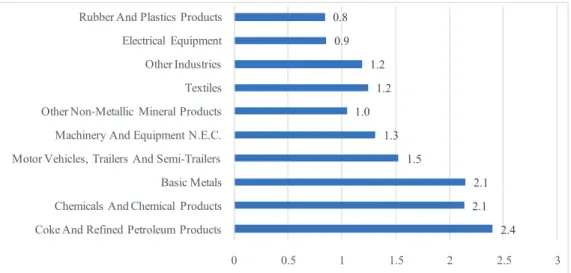
The composition of loss across top 10 industries under scenario B is reported in Figure 10 where we find that highest loss is estimated for coke and refined petroleum products (2.4% of the base year NVA), followed by basic metals and chemical products (2.1% each), motor vehicles (1.5%) and machinery and equipment (1.3%), and textile (1.2%), among others. Therefore, these industries require immediate attention. -5.5 -10.2 -12.7 -19.8 -30.0 -20.0 -10.0 0.0 10.0 20.0 30.0 40.0
Scenerio: A Scenerio: B Scenerio: C Scenerio: D
Top 10 Industries (% of Total NVA) All Industries (% of Total NVA) NVA (% Decline)
Figure 9. Decline (%) in Manufacturing Sector NVA Source: Authors computations based on ASI Data.
2.4 2.1 2.1 1.5 1.3 1.0 1.2 1.2 0.9 0.8 0 0.5 1 1.5 2 2.5 3
Coke And Refined Petroleum Products Chemicals And Chemical Products Basic Metals Motor Vehicles, Trailers And Semi-Trailers Machinery And Equipment N.E.C. Other Non-Metallic Mineral Products Textiles Other Industries Electrical Equipment Rubber And Plastics Products
Figure 10. NVA (%) Loss for Top 10 Industries (scenario B)12 Source: Authors computations based on ASI Data.
With COVID-19, the largest decline (% as compared to previous benchmark period—average NVA of 2014–2017) is expected for basic metals and electric equipment (approximately 21% for each), followed by textiles (18%); coke and refined petroleum products and motor vehicles (approximately 15%, each); and rubber and plastic products and other non-metallic products (approximately 11% each), among others (Figure 11).
15.5 6.8 21.4 14.6 7.6 11.2 18.4 21.6 10.9 15.9 10.2 0.0 5.0 10.0 15.0 20.0 25.0
Coke And Refined Petroleum Products Chemicals And Chemical Products Basic Metals Motor Vehicles, Trailers And Semi-Trailers Machinery And Equipment N.E.C. Other Non-Metallic Mineral Products Textiles Electrical Equipment Rubber And Plastics Products Fabricated Metal Products, Except Machinery And …
All Industris
With COVID
Figure 11. Decline (%) in Base NVA13 (scenario B) Source: Authors computations based on ASI Data.
Overall negative performance in manufacturing, the top value added sectors such as base metals, electronics, machinery, coke and refined petroleum products, motor vehicles, etc., have much dependence on the imports. As an instance electronics industry imports about 67 per cent of electronic components from China. With lockdown in China, there are reports of price rise by Chinese vendors on certain components owing to factory shutdown and short supply. Manufacturing sector will also slowdown due to exports slowdown owing to lockdown across countries and slowdown of global economy. Manufacturing constitutes more than 60 per cent of India’s total exports, and the import contents in India’s exports is very high. Some of sectors that feature in India’s top exports are also in India’s top imports. Therefore, lockdown affecting imports used for manufacturing will severely affect India’s exports.14
Take the example of automobile sector which is one of the success stories of Indian manufacturing in last decade. The sector was struggling to adjust to the new regulations of Bharat Stage (BS) VI regulations, effective 1 April 2020, before COVID-19 and now facing challenges because of the dependency of the sector on China for the Original Equipment Manufacturers (OEMs). All in all, prices of the raw material as well as finished goods are expected to inflate, but with lower demand, realization of increased input cost through end prices of finished goods is difficult. There are many problems and disruptions to the whole chain of domestic production network and manufacturing will take few weeks or months to come back to normalcy. One such problem is reverse migration of workers. The possible impact on labour intensive industries can come from fall in industrial productivity due to skill shortage as many of the migrant workers who possess specific skills acquired over the years remained inoperative during the crisis and are moving towards their homes even during the lockdown and may not come back quickly.
Impact on Trade
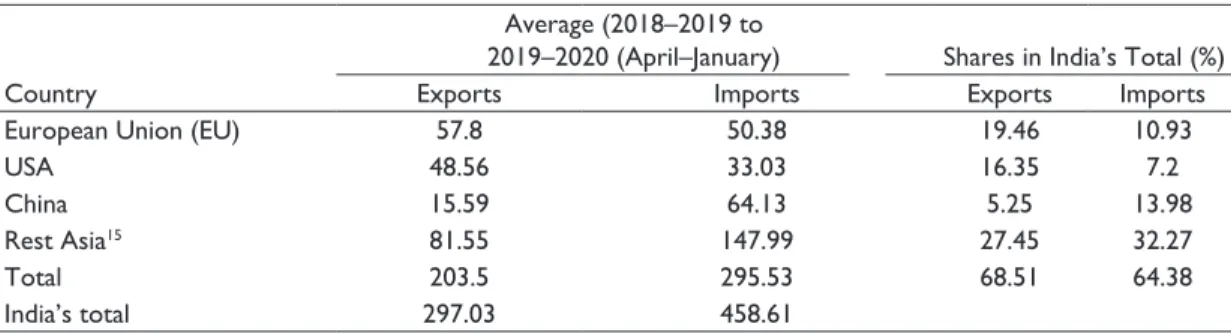
COVID-19 pandemic has given a big blow to the already slowing India’s trade, especially exports. India is mainly reliant on European Union (EU), USA, China and South East Asian countries, collectively contributing around two third of India’s exports and imports respectively (Table 2). India’s trade has much exposure to severely coronavirus-affected countries (the USA, EU and China) with two-fifths of exports and one third of import shares. Most notable, the USA and China both accounted for one-fifths of India’s exports and imports. It is worth noting that India’ exports and imports exposure to EU, USA and China together are two-fifths and one-thirds, respectively. Hence, there is less possibility of rise in exports amid falling rupee as these countries may face recession and experience significant fall in aggregate demand. Also, India has higher imports exposure as compared to exports with rest of Asian countries especially ASEAN, there the expected gain is less due to currency depreciation.
Table 2. India’s Trade with Top Partners
Country
Average (2018–2019 to
2019–2020 (April–January) Shares in India’s Total (%)
Exports Imports Exports Imports
European Union (EU) 57.8 50.38 19.46 10.93
USA 48.56 33.03 16.35 7.2
China 15.59 64.13 5.25 13.98
Rest Asia15 81.55 147.99 27.45 32.27
Total 203.5 295.53 68.51 64.38
India’s total 297.03 458.61
Similar to GVA analysis, we try to assess expected loss of India’s exports and imports under two situations. First, we assume a normal behaviour of world trade and carry out impact under hypothetical four scenarios (A–D). Second, we try to account for the expected fall in world trade due to the epidemic and then calculate loss to trade (scenario E). To account for the expected fall in world trade, we take the global financial crisis as the reference point and the percentage decline in exports and imports are taken as basis to evaluate the possible fall in India’s trade.16
In the normal scenario, India’s exports might have increased to the tune of 0.43 per cent in CY 2020 and imports declined by 5.3 per cent as India’s imports demand has been falling due to slowdown of domestic demand and rising protectionist measures.17 However, with COVID-19, the estimated fall in
India’s exports is going to decline by 13.7 per cent–20.8 per cent in 2020 over 2019 under scenarios A–D. The estimated fall in imports ranges from 17.3 per cent to 25 per cent (Figure 12A). In the scenario E, considering the U-shaped recovery similar to GFC, the potential fall in exports and imports in 2020 compared to 2019 are 19.8 per cent and 31 per cent, respectively.
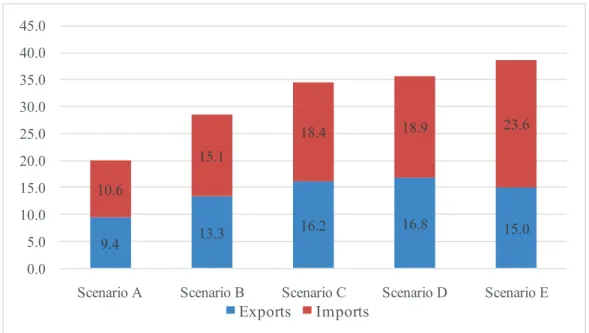
In terms of loss as percentage of absolute value for 2020, exports are going to lose by 9.4 per cent– 16.8 per cent and imports in the range of 10.6–18.9 per cent (Figure 12B). In the scenario E, the potential fall in exports and imports (as % of 2020) estimated at 15 per cent and 23.6 per cent, respectively.18 The
loss in exports and imports can be linked to the possibility of low competitiveness amid slower global demand and depreciating rupee. Also, the top exporting commodities of India fall in the top importing commodities as well, thereby suggesting strong intra-industry trade. COVID-19 impact would have a spillover effect across sectors due to setback to the intra-industry trade.
0.15 -13.7 -17.5 -20.2 -20.8 -19.8 -5.25 -17.3 -21.5 -24.5 -25.0 -31.1 -35.0 -30.0 -25.0 -20.0 -15.0 -10.0 -5.0 0.0 5.0
Decline (%) in 2020 over 2019
Exports ImportsFigure 12A. Change (%) in India’s Exports and Imports Source: Authors computations based on RBI Data.
9.4 13.3 16.2 16.8 15.0 10.6 15.1 18.4 18.9 23.6 0.0 5.0 10.0 15.0 20.0 25.0 30.0 35.0 40.0 45.0
Scenario A Scenario B Scenario C Scenario D Scenario E
Exports Imports
Figure 12B. Loss (%) of Exports and Imports of 2020 Source: Authors computations based on RBI Data.
The quarterly growth rate of India’s exports and imports became negative in 2019 from positive growth of 10 per cent and 15 per cent, respectively, in year 2018 as India has initiated trade restrictive measures. Exports would have noticed an increase of 6.4 per cent in 2020 Q1 and imports by 0.2 per cent without COVID-19. But after the COVID-19, the first quarter of 2020 witnessed a significant fall in India’s trade—exports falling by 11 per cent and imports by 9 per cent—due to the coronavirus outbreak. In case of normal behaviour, the figures for Q2 would have turned to −1.4 per cent for exports and 1.3 per cent for imports. We estimate the potential impact on trade for remaining quarters of 2020 (see Appendix for details). Under scenario A, the exports and imports are expected to decline by 37 per cent and 35 per cent respectably in second quarter of 2020, the period in which there is very restrictive or no movements of goods and services due to complete lockdown. This fall may extend to around 60 per cent for both exports and imports if the economy experiences partial lockdown till the mid of 2020 and assuming 90 per cent capacity utilization till September 2020. In case of U-shaped recovery, the imports growth (YoY) may go to the minimum level of 30 per cent in Q2 and can continue the decline by nearly 20 per cent till the end of calendar year 2020. However, exports can be hit harder as they are estimated to fall by 30 per cent in Q2 and around 40 per cent in the subsequent quarters (Figure 13).
Figure 14 presents the percentage decline in India’s total exports and imports under given hypothetical scenarios. The fall is measured while considering the actual values of average exports and imports of India during FY 2019 and 2020 (April–January Values). The magnitude of the impact on exports and imports is similar to what has been derived using the estimated values for FY 2021 in the previous section.
7.1 14.7 10.8 5.1 6.4 -1.4 -3.6 -1.0 -11.0 -9.0 -30.4 -40.7-36.9 -1.0 6.4 -1.4 -3.6-1.0 -60.0 -50.0 -40.0 -30.0 -20.0 -10.0 0.0 10.0 20.0 Q1 Q2 Q3 Q4 Q1 Q2 Q3 Q4 Q1 Q2 Q3 Q4 2018 2019 2020 Exports
Actual Scenario B Scenario E Normal
14.6 12.823.18.4 0.2 1.3 -11.2-11.1-9.0-11.0 -33.2 -23.6 -19.5 -11.1 0.2 1.3 -11.2 -11.1 -60.0 -40.0 -20.0 0.0 20.0 40.0 Q1 Q2 Q3 Q4 Q1 Q2 Q3 Q4 Q1 Q2 Q3 Q4 2018 2019 2020 Imports Actual Scenario B Scenario E Normal
Figure 13. Quarterly Growth in India’s Exports and Imports (YoY, %) Source: Authors computations based on RBI Data.
Figure 14. Decline in Exports and Imports (%, using Realized Values*) Source: Authors computations based on Export-Import database.
Note: * Using the average values of FY 2019 and FY 2020 as base.
In case of normal scenario, exports would have decelerated by 2.1 per cent and imports by 6.7 per cent in FY 2021 over FY 2020 (April–January). Across top export sectors—chemicals and related products might have grown by 6.5 per cent and plastic and electronics items by rate of 40 per cent. However, most of the other top exports would have experienced negative growth ranging from 4 to 10 percentage points. Top exports such as gems and jewellery, and textile and related products, would have decelerated by
around 6 per cent where petroleum, crude and products and plastic and rubber products might have observed a decline of around 10 per cent each. The falling growth can be attributed to the growing uncertainty on trade front amid rise in protectionism across countries. On the front of imports, the top sectors would have decelerated with the rate such as petroleum crude and products (8.5%), gems and jewellery (12.5%), electronics items (2.9%), chemicals (4.8%), basic metals (10%), ores and mineral (18%) and plastic and rubber products (6%). However, the machinery and agriculture and allied products would have noticed an increase in imports by rate 0.7 per cent and 2.2 per cent, respectively (Figure 15).
Figure 15. Sectoral Percentage Change in Exports and Imports Under Normal Behaviour19 Source: Authors computations based on RBI Data.
With regard to percentage decline in exports and imports across commodities due to COVID-19, it is estimated that products such as petroleum products, chemical products, machinery, electronics and plastic and rubber would suffer a loss of more than the national average of 20 per cent (see Figure 16). The top 10 principal commodities comprise around 90 per cent of the India’s exports and imports, respectively. The biggest fall in imports will be experienced by petroleum products, chemical products, machinery, base metals, ores and minerals (Figure 16). India has strong intermediate input usage demand and accordingly the forward linkage sectors such as automobiles, electronics, pharmaceuticals, machines and equipment, computer appliances, aircraft, etc. would bear the significant loss due to the epidemic.
Figure 16. Fall in Exports and Imports Across Sectors Scenario C (% of total base value) Source: Authors computations based on RBI Data.
The estimated fall in India’s trade is realistic. The COVID-19 pandemic which led to complete and partial lockdown across the countries creating severe disruption to trading of goods, services and movement of persons is affecting India’s trade which already witnessed negative growth in 2019. The worst COVID-19-affected economies—the USA, China, Italy, Spain, Germany, South Korea, France and the UK—are the epicentres of GVC and global trade. India’s top exports including labour intensive products starting from Gems and jewellery to garments/apparel or sea food are mainly exported to these countries. Moreover, the lockdown in these economies has brought about a standstill in the supply-chains and production network across sectors which will affect India’s manufacturing, trade, employment and growth. In fact, the fall out of COVID-19 on India’s trade is visible as both exports and imports (YoY) fell by round by 30 per cent in March 2010 compared to 2019. Medium and small enterprises in India, which absorbs the second largest labour force after agriculture, are not only strongly linked to exports sector but heavily depend on imports for their supply chain and production. In fact, some of the industries depending on imports such as automobiles, pharmaceuticals, electronics, telecom equipment, computer hardware, industrial machines and equipment’s, etc., will have to operate much below their capacity due to lack of inputs and intermediates. Further, the domestic lockdown affected these small firms from both domestic demand and supply side (Sahoo, 2020).
Impact on MSME
We compute the estimated loss in MSME sector using the available latest data of MSME GVA20 for the
year 2016–2017. The impact on MSME sector is based on two step process. First we compute the GVA for manufacturing and services sectors by applying the weights of shares in the number of total establishments under the two segments (manufacturing and services). After computing the GVA of these two sectors we find the percentage share of each in the national manufacturing and services GVA. Then we compute the loss by apportioning the percentage decline in these two sector obtained in the first section. The aggregate impact on MSME is computed through weighted average of MSMEs’ manufacturing and services sectors’ losses. It is evident from the figure that the GVA of MSME sector has grown with more than 7 per cent during 2015–2017 and taking the triennium average ending in FY 17, the MSME sector would have grown with the rate 6.74 per cent in the normal case scenario. However, with the COVID-19, the growth can come down to the level of 3.14 under most likely scenario B, and can go further lower to 1.7 per cent in case of pessimistic scenario (Figure 17).As per estimation, India’s MSME sector can expect a decline of 2.1 per cent under scenario A and this loss can increase to 5.7 per cent in case of scenario D. The loss is more skewed in manufacturing sector to the tune of 3.5 per cent in scenario A and 8.3 per cent in the scenario D. MSMEs dealing in trade and other services activities can bear the decline in GVA in the range of 1.4–4.5 per cent (Figure 18).
The lockdown affected these small firms from both domestic demand and supply side. The sudden collapse of trade also affects MSME sector. India’s top exports including labour intensive products starting from Gems and jewellery to garments/apparel or sea food are mainly supplied by MSME sector. Similarly, the lockdown affected the imports of raw materials and intermediates which affect the supply chain of MSME sector. Therefore, the COVID-19 is going to affect MSME sector and millions employed in this sector. In fact, if the situation gets worse and prolongs for a few months, many small and tiny firms may cease to exist as it would be difficult for them to survive and hold onto their men and machines.
6.96 5.70 5.50 7.45 7.28 6.74 7.28 3.14 7.28 1.70 0.00 1.00 2.00 3.00 4.00 5.00 6.00 7.00 8.00 2012-13 2013-14 2014-15 2015-16 2016-17 Base Period
Annual Growth (%)
Actual Growth (%, Scenario B) Growth (%, Scenario D)
Figure 17. Growth Rate of MSME GVA (%)
Source: Authors computations based on MSME annual report 2018–2019, Ministry of MSME.
-3.48 -5.53 -6.99 -8.26 -1.43 -2.74 -3.68 -4.51 -2.06 -3.61 -4.71 -5.67 -9.00 -8.00 -7.00 -6.00 -5.00 -4.00 -3.00 -2.00 -1.00 0.00
Scenario A Scenario B Scenario C Scenario D
Manufacturing MSME GVA Services MSME GVA MSME GVA
Figure 18. Decline (%) in GVA of MSME Sector
Source: Authors computations based on MSME annual report 2018–2019, Ministry of MSME.
Conclusion and Policy Implications
Our assessment is that Indian economy may have 0.4 per cent growth this calendar year 2020 in most realistic scenario and a negative growth of around 3 per cent in worst case scenario with 50 per cent over utilization of public sector and defense services (PAD). However, in case of more pessimistic environment where there are normal PAD services (no over utilization of PAD), the deceleration would be in the range
of 1.3 per cent in best case scenario to 7.2 per cent under worst case scenario. The most affected sector is going to be mining sector followed by manufacturing, construction, trade, hotels and transport services and financial services. The manufacturing sector may shrink in the range of 5.5–20 per cent from best case to worst case scenario, respectively. In manufacturing, some of the most affected industries are likely to be metals and chemical products, motor vehicles, machinery and equipment, textiles, etc. The loss in industrial NVA (all industries) as percentage of the base NVA is estimated at 13.5–27.8 per cent for base case scenario and worst case scenario, respectively. Interestingly the top 10 industries which contribute around two-thirds of the total industrial NVA, bear the loss in NVA in the range of 11.1–19.6 per cent of the total NVA of base year. Top 10 industries contribute 65 per cent of total industrial sector NVA, absorb 55 per cent of all industrial workers (55%) and bear significant fixed cost, around 70 per cent of total interest and rent cost of all industries. The largest decline is expected for basic metals and electric equipment (around 21% for each), followed by textiles (18%); coke and refined petroleum products and motor vehicles (around 15%, each); rubber and plastic products and other non-metallic products (around 11% each).
The impact of COVID-19 on India’s trade is going to be huge. The estimated fall in India’s exports is going to be 13.7–20.8 per cent in 2020 over 2019 under scenarios A–D. The estimated fall in imports ranges from 17.3 to 25 per cent. Under scenario A, the exports and imports are expected to decline by 37 per cent and 35 per cent, respectively, in second quarter of 2020, the period in which there is very restrictive or no movements of goods and services due to complete lockdown. This fall may extend to around 60 per cent for both exports and imports if the economy experiences partial lockdown till the mid of 2020 and assuming 90 per cent capacity utilization till September 2020. With regard to percentage decline in exports and imports across commodities due to COVID-19, it is estimated that products such as petroleum products, chemical products, machinery, electronics and plastic and rubber would suffer a loss of more than the national average of 20 per cent. As per estimation, India’s MSME sector can expect a decline of 2.1 per cent under base scenario and this loss can increase to 5.7 per cent in case of worst case scenario. The loss is more skewed in manufacturing sector to the tune of 3.5 per cent in scenario A and 8.3 per cent in the scenario D. The MSMEs dealing in trade and other services activities can bear the decline in GVA in the range of 1.4–4.5 per cent. It is evident from the analysis that the impact of the pandemic across sectors and in different scenarios of complete, extended and partial lockdown and at different levels of capacity utilization is massive on the Indian economy. The impact is particularly severe on trade, manufacturing and the MSME sector which contribute substantially to India’s employment and growth.
Given the extent of economic fallout, the government of India has announced series of economic packages to give stimulus to the economy. The first economic package was of ₹1.7 lakh crore (0.8% of GDP) announced immediately after lockdown to address the immediate basic needs of the majority. Then the central bank announced series of measures in reducing policy rates and to enhance liquidity in the market to the tune of 3.2 per cent of the GDP (₹6.5 lakhs crores). Finally, the big economic package of around ₹12 lakh crores (6% of GDP) was announced on 12 May 2020, which was elaborated in detail subsequently. The focus of the package has been on labourers, farmers, taxpayers, MSME, cottage industries, etc. The economic package also includes the sectors such as agriculture, taxation, infrastructure, human resource and the financial system which would attract investment and revive demand in the economy. Moreover, the package focused on labour, liquidity and laws along with wide ranging reforms to give a boost to the economy.
The stimulus measures so far are around 10 per cent of GDP which is a welcome step when the economy has come to a standstill. Given the estimated fall out of COVID-19 on Indian economy, the government should not worry about the fiscal rule and go all out in adopting counter cyclical fiscal
measures to stop things from going bad to worse. It is time for big initiatives to help firms which not only depend on the domestic economy but also on international trade. Government also needs to ensure that the stimulus measures are well directed at some of the worst affected sectors like manufacturing, construction, travel, transportation, tourism, hotel, etc. Firms in worst affected sectors are suffering due to shut down of factories, collapse of global demand, cancellations of orders, delays in shipments, etc. Therefore, these firms need support in the form of interest free working capital to cover their wage cost and fixed cost (rent and interest) to survive during these tough times. The economic package has given credit guarantee but its time now to boost demand so that there is credit uptake. MSME sector is labour intensive and life line of India’s manufacturing and trade, and the sector is badly affected by the disruptions to both supply and demand mainly due to domestic and international lockdowns. Apart from credit and other financial incentives, the need of the hour is to help firms, business and economic activity to get back on operational mode. The economic impact of COVID-19 pandemic is huge and it would need a humongous effort on the part of the government, industry, civil society and all key stakeholders to ensure that the Indian economy recovers sufficiently and soon. The study has further scope to carry out the impact assessment of Indian economy at more disaggregate level.
Acknowledgement
The authors are grateful to the anonymous referee for useful comments and suggestions to improve the quality of the article. Usual disclaimers apply.
Declaration of Conflicting Interests
The authors declared the following potential conflicts of interest with respect to the research, authorship and/or publication of this article: The views expressed here are those of authors and do not reflect the views of the organizations they belong to.
Funding
The authors received no financial support for the research, authorship and/or publication of this article.
Notes
1. See https://www.imf.org/en/Publications/WEO/Issues/2020/06/24/WEOUpdateJune2020
2. During the first two phases of lockdown period, that is, 40 days from 24 March to 3 May 2020, we presume no economic activity except agriculture, utilities and public sector.
3. FY 2017–2018 is the latest data available from ASI.
4. We consider calendar year for the impact assessment on GVA and trade. 5. GVA based on constant prices of 2011–2012.
6. These numbers are based on assumption that public administration and defense services are working with over-capacity of 50 per cent.
7. See Figure 2 for sector wise GVA growth in normal scenario (without COVID-19). 8. This fall is with respect to the corresponding sector’s GVA of 2020.
9. The residential sales across the top six cities in India fell 4 per cent (YoY) in FY 2020 (April–December) compared to FY 2019.
10. India is a big importer of steel and iron products, technical construction equipment as well as plastic and fibre elements from China.
11. As compared to the previous benchmark period of average NVA of 2014–2017. 12. Percentage of total NVA of base period.
14. See https://www.tpci.in/blogs/covid-19-crisis-is-a-great-opportunity-to-revive-multilateral-trade-framework/ 15. Rest of Asia includes, UAE, Saudi Arabia, Japan and leading ASEAN.
16. During global financial crisis, quarterly growth plummeted to lowest level of around 30 per cent during 2009– 2010 Q1 with average fall of exports and imports around 20 per cent during 2008–2009 Q3 to 2009–2010 Q2. The detailed graph is not presented for brevity.
17. According to a WTO report, trade-restrictive measures implemented during mid-October 2018 to mid-October 2019 affected about US$746.9 billion or 3.84 per cent of world merchandise imports. Protectionist tariff barriers raised by India, alone accounted for 22 per cent of the total impact.
18. For the year 2009, world trade declined in real or volume terms by 12.2 per cent. Because of significant price declines, especially for primary commodities such as petroleum and minerals, the decline in dollar terms was 23 per cent.
19. FY 2020 (April–January, a period before the COVID) as Compared to FY 2019 (April–January).
20. We convert the nominal GVA into real terms by using the GVA deflator based on price level of 2011–2012.
References
Garg, B., & Sahoo, P. (2020). Corona crash: Need global efforts to tackle global crisis (Policy Brief, No. 12). Institute of Economic Growth.
Gupta, M., & Minai, M. H. (2019). An empirical analysis of forecast performance of the GDP growth in India. Global Business Review, 20(2), 368–386.
International Labour Organization (ILO). (2020. March 18). COVID-19 and the world of work: Impact and policy responses. International Labour Organization.
International Monetary Fund (IMF). (2020, April 2020). World economic outlook: The great lockdown. International Monetary Fund. https://www.imf.org/en/Publications/WEO/Issues/2020/04/14/weo-april-2020
McKibbin, W., & Fernando, R. (2020, March 2). The global macroeconomic impacts of COVID-19: Seven scenarios. Brookings. https://www.brookings.edu/research/the-global-macroeconomic-impacts-of-covid-19-seven-scenarios/ Mishra, B. R. (2019). Role of external and domestic demand in economic growth: A study of BRICS countries.
Global Business Review, 21(2), 547–566.
National Bureau of Statistics of China. (2020, March 16). National economy withstood the impact of COVID-19 in the first two months. http://www.stats.gov.cn/english/PressRelease/202003/t20200316_1732244.html
Ozili, P., & Arun, T. G. (2020). Spillover of COVID-19: Impact on the global economy. SSRN Electronic Journal. https://doi.org/10.2139/ssrn.3562570
Sahoo, P. (2020). The policy response to minimize the fallout of COVID-19 on trade and MSMEs. In the volume “COVID-19: Challenges for Indian Economy.” Prepared by EEPC, ASEAN-India Center. https://www. eepcindia.org/eepc-download/617-Covid19_Report.pdf
WTO. (2020, April 8). Trade set to plunge as COVID-19 Pandemic upends global economy. Press Release. https:// www.wto.org/english/news_e/pres20_e/pr855_e.htm