ANALYZING THE SHAPE CHARACTERISTICS OF LAND USE CLASSES IN REMOTE
SENSING IMAGERY
Limin Jiaoa,b* Yaolin Liua,b
a
ITU, Civil Engineering Faculty, 80626 Maslak Istanbul, Turkey - (oaltan, tozg, kulur, seker)@itu.edu.tr
bDept. of Geomatic Engineering, University College London, Gower Street, London, WC1E 6BT UK -
[email protected]
Limin JIAOa,b* Yaolin LIUa,b
a School of Resource and Environment Science, Wuhan University, 129 Luoyu Road, Wuhan 430079, China - [email protected] b
Key Laboratory of Geographic Information System, Ministry of Education, Wuhan University, 129 Luoyu Road, Wuhan 430079, China.
Commission II, WG VII/4
KEY WORDS: Land Use, Image Segmentation, Landscape Metrics, Shape Metrics, Image Classification
ABSTRACT:
Shape is an important aspect of spatial attributes of land use segments in remotely sensed imagery, but it is still rarely used as a component in land use classification or image-based land use analysis. This study aims to quantitatively characterize land use classes using shape metrics. The study is conducted in a case area located in south China, covering twelve scenes of SPOT-5 images. There were total ten metrics selected for the analysis, namely, Convexity (CONV), Solidity (SOLI), Elongation (ELONG), Roundness (ROUND), Rectangular Fitting (RECT), Compact (COMP), Form Factor (FORM), Square pixel metric (SqP), Fractal Dimension (FD), and Shape Index (SI). The last five metrics were used to measure the complexity of shape. Eight land use classes were investigated in the case area, namely, roads, cultivated lands, settlement places, rivers, ponds, forest and grass lands, reservoirs, and dams. The results show that all typical shape properties of land use segments can be well measured by shape metrics. We identified the land use classes whose values are significantly differentiated from most classes for each metric. Two of the five complexity metrics, FORM and SqP, were identified to be more effective in characterizing the complexity of land use classes. We finally selected six shape metrics and deduced the “Shape Metric Signatures” (SMS) of different land use classes. SMS can serve as accurate and predictive discriminators of land use classes within the study area. Our results show that SMS can clearly distinguish spectrally similar land use classes. The results will help to build a more accurate and intelligent object-oriented classification system for land use classes.
1. INTRODUCTION
1.1 Instructions
Acquiring land use data from remote sensing images has become the main approach of monitoring Land use and land-cover change (LUCC) (Walker and Steven, 1996). LUCC is a key driver of global change, and has important implications for environment policy issues (Nunes and Auge 1999; Bauer et al., 1979; Ozesmi and Bauer, 2002; Bauer et al., 2002). Particularly, in densely populated and fast-developing countries, timely monitoring of LUCC with high-resolution remote sensing images is becoming more and more important for the regulation of accelerated land use transformations. Quantitatively characterizing the land use classes in imagery will foundamentally support the land use classification and LUCC analysis.
There have been many studies that have focused on utilizing the spatial information in remotely sensed imagery for land use and land-cover classification (Lewis et al., 1997; Thakur and Dikshit, 1997; Narumalani et al. 1998; Ji 2000; Steele 2000; Steele and Redmond, 2001; Herold et al., 2002). Spatial information in remote sensing imagery includes aspects such as image texture, contextual information, and geometric attributes of features (Narumalani et al. 1998; Pacifici et al., 2009). Incorporating spatial information with spectral information is
particularly important for land use classification, since different land use classes with similar spectral properties may have distinct spatial characteristics. For example, urban impervious surfaces and highways exhibit similar spectral responses but have different shape patterns. Another example is regular-shaped cultivated lands and irregular-regular-shaped natural grass lands. Geometric attributes serves as important and specific aspects of land use patches in remote sensing imagery. But less research has focused on using geometric parameters to quantitatively characterizing land use segments in image classification (Frohn, 2006).
Landscape metrics calculated on the basis of per-pixel classified images has been used extensively to quantify land use / land-cover patterns and relate them to ecological or geographical processes (McGarigal and Marks 1994; Malaviya et al., 2010). The landscape metrics at patch level usually includes shape indices. For example, Read and Lam (2002) employed Shannon’s diversity index, contagion, and fractal dimension from perimeter-to-area to characterizing land cover types for tropics. Salas et al. (2003) used a perimeter-to-area ratio as an index of misregistration bias in the land cover change detection analysis. Herold et al. (2002) utilized landscape metrics to describe the structures of urban land use classes such as commercial areas, high-density residential areas and low-density residential areas. Landscape metrics analysis helps to understand the characteristics of landscape classes. But the ISPRS Annals of the Photogrammetry, Remote Sensing and Spatial Information Sciences, Volume I-7, 2012
findings in landscape analysis usually cannot be directly used for land use land-cover classification. Because a landscape class is often a land use and land-cover mix although it has one or two dominant land use or land-cover classes. These analyses are mostly based on visually delineated landscape maps from images.
Image segmentation allows for the creation of homogenous regions or image objects through region merging or boundary detection algorithms (Steele, 2000; Stuckens et al., 2000, Benz et al., 2004; Blaschke, 2010). Shape metrics can be applied to low level image segments to help classify these objects to land use categories (Frohn, 2006). Zhou et al. (1995) employed a shape index to help to discriminate spectrally similar land-cover classes. Lewis et al. (1997) used shape descriptors such as eccentricity, elongatedness and complexity in cloud classification from satellite imagery. Narumalani et al. (1998) focused on incorporating the geometric attributes of image objects to resolve some of the spectral confusions that occur when pure per-pixel classification algorithms are used. They also pointed out that new methodologies need to be developed to detect the geometric differences between natural cover and agricultural fields. Frohn (2006) employed the square pixel metric (SqP) to distinguish image objects between land-cover categories that had similar spectral properties but different shape complexity values, for example, natural pastures and anthropogenic pastures. Since there are often quite a few categories in land use classification system, only one or two shape metrics are insufficient to fully describe their geometric differences. Many shape metrics have been designed and utilized in landscape ecology.
There are also various metrics to describe a single shape characteristic. For example, researchers employed compact index (Russ, 2002), complexity index (Lewis et al., 1997), SqP (Frohn, 2006), and fractal dimension (Herold et al., 2002; Read and Lam, 2002) to characterize the shape complexity of a patch. Which indices are effective to characterize the land use patches of different classes? It is necessary to examine the differentiating ability of the metrics and their application in characterizing land use segments.
Human imagery interpreters can minimize the confusions in land use classification because they possess a comprehensive knowledge of image tone, texture, association, shape, size, position, and other related characteristics of various land use classes (Gurney, 1981). Land use parcels are shaped to different degrees for various purposes, i.e., anthropogenic effects are reflected on the shape of land use parcels. Consequently, various land use classes often have specific shape characteristics. These characteristics compose an important part of the knowledge of visual interpretation of land use classes. Compared to land-cover classification, land use classification is more depended on knowledge because different land-cover types that are relatively easy to be detected may belong to the same land use type, and vice versa. For example, ploughed cultivated fields and crop-covered fields have different land-cover types but belong to the same land use class, cultivated land. It has been discussed extensively to utilize spectral and textural information in computer-aided land use classification. But shape metrics are not commonly incorporated into the classification. The possible reason is that it is far from clear to quantitatively characterize the shape of land use classes.
The purpose of this research was to investigate the performances of shape metrics as techniques to characterize land use segments from high-resolution remote sensing image. Our study identified the shape metrics that can be used to characterize and discriminate land use classes in a tropical site in Hainan Island, China. In this paper, data and methodological
issues are described in section 2. The results and discussions are presented in section 3. The concluding remarks and future work are summarized in section 4.
2. DATA AND METHODS
2.1 Study area
The study site is located in Changjiang county, Hainan province, China. The site is a hilly area covered by twelve SPOT-5 satellite image scenes, encompassing approximately 360 km2. The site is typical for tropical and semitropical agricultural area in China, and includes many land use classes, such as crop planting land, orchard land, forest, grass land, water body, transportation land, and settlement place.
2.2 Data
The SPOT-5 images of the study area were from 2009. The vector land use map for 2009 at the scale of 1:10,000 was also collected for reference from the local bureau of land resource and environment management. Image segmentation was used to create land use objects from remote sensing images of study area. Segmentation clusters image pixels together into land use objects according to spectral and contextual information (Benfield et al. 2007; Platt and Rapoza 2008). Image segmentation mimics human visual interpretation of scenes, which groups pixels into homogeneous areas as image objects. Image segmentation of the SPOT-5 images was performed using ENVI 4.5 software. There are two parameters in the process, scale level and merge level. The parameters were chosen by a visually evaluation of the segmentation results. A higher Scale Level causes fewer segments to be defined, while a lower Scale Level causes more segments. Merge Level is used to further delineate the boundaries of features as well as possible by eliminating over segmentation in the former step. Finally the following user-defined inputs were used: scale level of 50 and merge level of 95.
Eight typical land use classes in this area were involved in this study, namely, cultivated lands, forest and grass lands, rivers, ponds, reservoirs, dams, roads and settlement places. The category of cultivated lands includes crop planting fields and orchard lands. Forest and grass lands are mostly natural areas covered by forest, shrub, and grass lands. Ponds are small water bodies usually used for aquiculture. Settlement places include towns and village settlements.
By referring the land use map and visual interpretation, we selected image segments as samples for each category of land use in a stratified random manner. Since settlement places typically exhibit a spatially heterogeneous land-cover, the image segments of each settlement sample were highly fragmented. The adjoining image segments of each settlement sample were merged into a single polygon to ensure that we can examine the shape characteristics of a settlement place as a whole. There are four reservoirs and five dams in the case area and all of them were included in sample set. Finally there were total 504 samples collected.
2.3 Shape characteristics of land use segments
Landscape in populated area is heavily influenced by human activities. An important aspect of anthropogenic effects on landscape that can be observed on remote sensing images is shape characteristic of land use patches. Theoretically, the shape of land use patches is determined by both natural forces and anthropogenic effects. While in populated area like most ISPRS Annals of the Photogrammetry, Remote Sensing and Spatial Information Sciences, Volume I-7, 2012
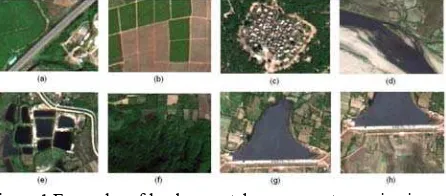
provinces in China, land is developed intensively, and the anthropogenic effects on the shape of land use patches are predominant. In the case area, human induced land uses occupy more than two third of the area. Roads, cultivated lands, and settlements places are the land uses most influenced by human activities. The land use patches of these land use classes usually have specific spatial characteristics. For example, roads are elongated, and cultivated lands are more regular-shaped. Ponds and reservoirs are the land uses that are half influenced by human. Many of these water bodies are used for aquiculture and water sources for irrigation. Rivers and forests are less influenced by human, and preserve more natural boundaries. Typical examples of various land uses are shown in Figure 1. Cultivated lands and forest and grass lands may both be covered by vegetation, but their shapes are distinct. Cultivated lands are often regularly shaped, while forest and grass lands are of with more complex boundaries. The patches covered by crop plants and the cultivated lands covered by bare soil may be separated into different classes when only spectral and textural information is used. But when shape characteristics and spatial context are considered, it is confirmed that they are actually the same class. The impervious surfaces on image may be roads, settlement places or dams, but they could be separated by shape characteristics. Similarly, rivers, ponds and reservoirs are all covered by water but have different shapes.
This study aimed to indentify the shape metrics to describe the spatial characteristics of different land use categories. The metrics could be considered as “Landscape Metric Signatures” (Herold et al., 2002) or “Shape Metric Signatures” for different land use categories. Particularly, the metrics that quantify the anthropogenic effects on the shape of land use patches could be termed as “Anthropogenic Metric Signatures”.
Figure 1 Examples of land use patches on remote sensing image (a. roads; b. cultivated lands; c. settlement places; d. rivers; e.
ponds; f. forest and grass lands; g. reservoirs; h. dams)
2.4 Metrics to characterize the shape of land use segments
The shape characteristics of land use segments could be summarized into two categories. One refers to the basic geometric characteristics, such as roundness and rectangularity. The other one represents the indices describing shape complexity, for example, fractal dimension of polygon.
We employed five metrics to characterizing the basic geometric characteristics, namely, CONV (CONV), SOLI (SOLI), Elongation (ELONG), Roundness (ROUND), and Rectangular Fitting (RECT), see table 1. CONV is a shape measure that compares the perimeter of the convex hull of a polygon to the perimeter of the polygon (Russ, 2002). The CONV value for a convex polygon with no holes is 1.0, while the value for a concave polygon is less than 1.0. SOLI compares the area of the polygon to the area of the convex hull surrounding the polygon (Russ, 2002). The SOLI value for a convex polygon with no holes is 1.0, and the value for a concave polygon is less than 1.0. ELONG is the ratio between the length and height of the region bounding rectangle enclosing the minimum area (Sonka et al.,
1993; Lewis et al., 1997). The ELONG value for a square is 1.0, and the value for a polygon whose minimum enclosing rectangle is not a square is greater than 1.0. ROUND is a shape measure that compares the area of the polygon to the area of the minimum circumcircle of the polygon (Russ, 2002). The ROUND value for a circle is 1, and the value for other shapes is larger than 1.0. RECT compares the area of a polygon to the area of the minimum rectangle enclosing the polygon, and indicates how well the polygon is described by a rectangle. The RECT value for a rectangle is 1.0, and the value for a non-rectangular shape is less than 1.0.
There are various shape metrics that have been proposed to measure shape complexity of polygon. Russ (2002) employed Compact (COMP) and Form Factor (FORM) to describe polygon complexity. Lewis et al. (1997) employed a similar index called Complexity. Complexity and FORM are actually the same, but FORM is normalized between 0 and 1. Frohn (1998) proposed a shape complexity measure called SqP. Fractal Dimension (FD) calculated from perimeter to area ratio has been used widely in landscape ecology to describe patch shape complexity. Shape Index (SI) is a simple and straightforward measure of overall shape complexity, and has been used widely in landscape ecology (McGarigal and Marks, 1995). McGarigal and Marks (1995) calculated SI on raster image, and let SI equal patch perimeter (given in number of cells) divided by the minimum perimeter (given in number of cells) possible for a maximally compact patch (in a square raster format) of the corresponding patch area. The five shape metrics, COMP, FORM, SqP, FD and SI, are all calculated from area and perimeter of polygons. All of them were used to represent shape complexity. But they were used separately in different studies, and the comparison of their effectiveness was not clear. All of these five metrics will be employed in this study, and we will investigate whether some of them can be used to effectively characterize land use segments in image. The shape metrics used in this study are listed in Table 1.
3. RESULTS AND DISCUSSION
3.1 Shape metrics of land use classes
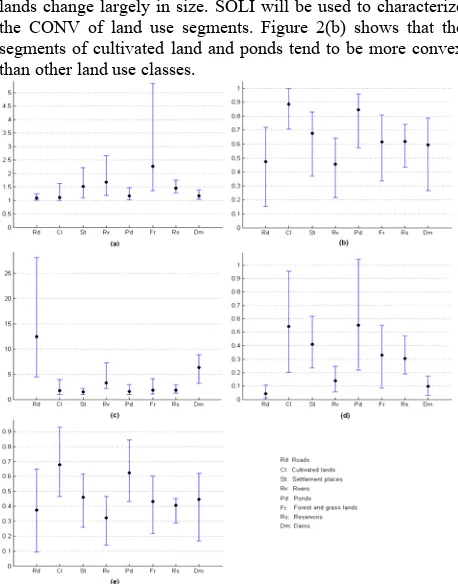
The shape metrics were calculated based on the samples of various land use classes using ENVI zoom. The shape metrics were compared by maximum, mean, and minimum values (Figure 2-3). Figure 2 shows the comparison of the five metrics characterizing the basic geometric characteristics of land use segments, and Figure 3 shows the comparison of the metrics for shape complexity.
Figure 2 shows that the basic shape metrics provide a clear representation of the geometric characteristics for the land use classes. It can be seen that there are some distinct differences among land use classes.
CONV and SOLI both describe the CONV of the polygon. The difference between these two metrics is that CONV uses perimeter ratio while SOLI uses area ratio to measure the CONV. A large polygon that seems like convex may has complex details so that the perimeter can be very large comparing to the perimeter of its convex hull, thus the CONV value could be low while the SOLI value is high. Thus the index of CONV cannot accurately represent the overall CONV of the land use segments with large areas. Therefore, CONV is more sensitive to the size of the land use segments, and SOLI is more robust. This can be verified by the fact that the ranges of CONV change more largely among land use classes than SOLI by comparing Figure 2(a) and Figure 2(b) since the average area of land use class varies largely. Roads, ponds, reservoirs, ISPRS Annals of the Photogrammetry, Remote Sensing and Spatial Information Sciences, Volume I-7, 2012
and dams change less in size of segments, and forest and grass lands change largely in size. SOLI will be used to characterize the CONV of land use segments. Figure 2(b) shows that the segments of cultivated land and ponds tend to be more convex than other land use classes.
Figure 2 Maximum, mean, and minimum values for the five metrics characterizing the basic geometric characteristics of land use segments (a. CONV; b. SOLI; c. ELONG; d. ROUND;
e. RECT)
Code Name Calculation scheme Range
CONV Convexity
p
pc , : perimeter
of convex hull, : perimeter of the polygon
c p
p
(0, 1]
SOLI Solidity
c a
a , : area of convex hull, : area of the polygon
c a
a
(0, 1]
ELONG Elongation
min max l
l , :
length of the major axis, : length of the minor axis
max
l
min
l
[1, +∞]
ROUND Roundness
) (
4×a π×lmax2 , : area of the polygon,
: length of the major axis
a
max
l
(0, 1]
RECT Rectangula r fitting
min
max l
l
a × , : area
of the polygon, : length of the major axis, : length of the minor axis
a
lmin
l
max
(0, 1]
COMP Compact
con
a
p
4
×
π
, : area of the polygon,: length of the out contour of the polygon
a
con
p
(0, 1/π]
FORM Form factor
2 ) 4
(π×a p , : area of the polygon, : perimeter of the polygon
a
p
(0, 1]
SqP Square
pixel metric
p
a
- 4
×
1 , :
area of the polygon, : perimeter of the polygon
a
p
[1−2/ π, 1)
FD Fractal
Dimension
( ) ( )
p
4
ln
a
ln
2
×
, :area of the polygon, : perimeter of the polygon
a
p
[1, 2]
SI Shape
index
(
a
)
p
4×
, : area of the polygon, : perimeter of the polygona
p
[ π/2, +∞)
Table 1 Shape metrics
ELONG indicates the degree that a polygon is elongated. Figure 2(c) shows that roads have the highest ELONG (between 4.5 and 28.2) and differs apparently from other land uses. The dams also have relatively high ELONG. The average ELONG value is 12.5 for roads; 6.3 for dams; and less than 5.0 for others. ELONG clearly discriminate roads and dams from other land uses.
ROUND and RECT indicate how well the polygon can be described by a circle and a rectangle, respectively. Cultivated lands and ponds have the highest ROUND (>0.5) and the highest RECT (>0.6). Roads and dams have the lowest ROUND (<0.1), which is according to the fact that their shapes are distinct to a circle.
Figure 3 Maximum, mean, and minimum values for the five metrics characterizing the shape complexity of land use
segments (a. COMP; b. FORM; c. SqP; d. FD; e. SI) ISPRS Annals of the Photogrammetry, Remote Sensing and Spatial Information Sciences, Volume I-7, 2012
Figure 3 shows that there are some significant differences among land use classes regarding shape complexity reflected by shape metrics. It will help to characterize land use classes to investigate these differences. First of all we need to select the metrics that better describe these differences. It can be seen from Table 1 that the calculation schemes for shape complexity could be divided into two groups. One is based on area-to-perimeter ratio, including COMP and FORM. The other one is based on perimeter-to-area ratio, including SqP, FD, and SI. As a result, we can see two inverse patterns in Figure 3. The patterns are reflected in Figure 3 by the dashed lines that illustrate the change trends of the metric values among land use classes. One pattern is found in Figure 3(a) and Figure 3(b), and the other pattern is found in Figure 3(c), Figure 3(d), and Figure 3(e). We employ two pairs of land use classes to compare the ability of the metrics to distinguish land use classes. One pair is cultivated lands and forest and grass lands, and the other is rivers and ponds. Both pairs are easily confused in spectral properties but have distinct shape signatures. Each pair of land use classes are expected to be discriminated clearly by the shape metrics. An indicator was designed to show how well the shape metrics can distinguish between each pair of land use classes:
nrange nj
ni
n
v
v
v
k
=
ٛ-
(7)where and are the average values of shape metric
n
for land use
i
and land useni
v
v
njj
, respectively;v
represents the observed range of shape metricn
in the case area. The observed range not the theoretical range of the shape metric was employed here because some theoretical values could not appear in the calculation of shape metrics on actual land use maps, for example, the theoretical range for SI isinfinite, but the observed range in this case is 6.0. A higher
indicates that the shape metric can separate the pair of land
use classes more clearly. According to the analysis of
values, we select FORM and SqP to describe the shape complexity of land use classes.
range
n
k
n
k
n
n
The highest two values of FORM (0.58 and 0.54) and the lowest two values of SqP (0.13 and 0.15) are all linked to cultivated lands and ponds. It indicates that the polygons of these two land use classes generally have simplest shapes, according with the fact that most cultivated lands are almost rectangularly shaped and most ponds are almost rectangular or round. FORM and SqP both show that roads, rivers, and forest and grass lands are the three land uses with more “complex” shapes (FORM: 0.08, 0.10, 0.11; SqP: 0.68, 0.66, 0.62). Although roads appear as elongated polygons seeming to be regular, they still have the lowest FORM and the highest SqP because their shapes are quite different from the assumed most “simple” polygons, square and circle. Settlement places show medium low complexity, and reservoirs and dams show medium high complexity.
3.2 Characterization of different land use classes using shape metrics
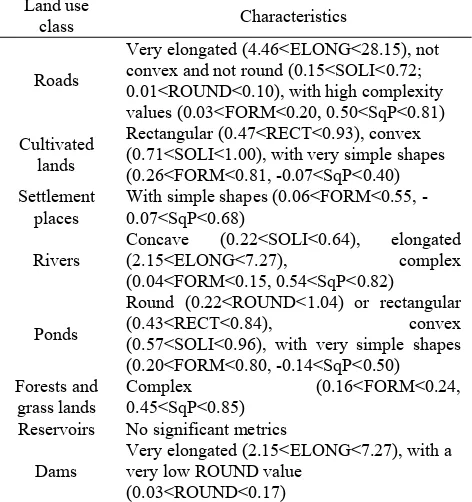
The typical shape characteristics of land use classes can be quantitatively described by corresponding shape metrics (see Table 2). It can be seen that the shape characteristics of land use classes usually described by natural language are measured precisely by the metrics.
It should be noticed that only the significant metrics of a land use class are used to characterize the land use class in Table 2. The number of significant metrics varies across land use classes. For example, the class of cultivated lands has five significant metrics, while the class of forest and grass lands has only two significant metrics. It does not mean that the later only has the two metrics that can be used to differ it from other classes. Which metrics can be used depends on which classes are involved in comparison. For example, when comparing cultivated lands and forest and grass lands, all the significant metrics for both classes can be used in the classification, namely, SOLI, ROUND, RECT, FORM and SqP. Actually, when we combine the metrics in classification, the land use classes can be differentiated more clearly. It is particularly useful for the classification of spectrally similar land use classes.
Land use
class Characteristics
Roads
Very elongated (4.46<ELONG<28.15), not convex and not round (0.15<SOLI<0.72; 0.01<ROUND<0.10), with high complexity values (0.03<FORM<0.20, 0.50<SqP<0.81)
Cultivated lands
Rectangular (0.47<RECT<0.93), convex (0.71<SOLI<1.00), with very simple shapes (0.26<FORM<0.81, -0.07<SqP<0.40) Settlement
places
With simple shapes (0.06<FORM<0.55, -0.07<SqP<0.68)
Rivers
Concave (0.22<SOLI<0.64), elongated
(2.15<ELONG<7.27), complex (0.04<FORM<0.15, 0.54<SqP<0.82)
Ponds
Round (0.22<ROUND<1.04) or rectangular
(0.43<RECT<0.84), convex (0.57<SOLI<0.96), with very simple shapes
(0.20<FORM<0.80, -0.14<SqP<0.50) Forests and
grass lands
Complex (0.16<FORM<0.24, 0.45<SqP<0.85)
Reservoirs No significant metrics
Dams
Very elongated (2.15<ELONG<7.27), with a very low ROUND value
(0.03<ROUND<0.17)
Table 2 Quantitatively characterizing land use classes by shape metrics
4. CONCLUSION
The first step of utilizing shape as a component in image analysis is to investigate shape metrics that could be used to measure the shape characteristics of image objects. This study probes into the use of shape metrics to characterize land use segments in SPOT-5 images in a case area located in south China.
There are total ten metrics were selected for the analysis. Five of them were used to measure the basic geometric attributes of land use segments. The five metrics, namely, CONV, SOLI, ELONG, ROUND, and RECT, measure convexity, solidity, elongation, roundness, and rectangular fitting, respectively. The other five metrics, namely, COMP, FORM, SqP, FD, and SI, were used to measure the complexity of shape. Some metrics describe shape characteristics from the same aspect, and are correlated to some extent. We select proper metrics that best characterizing land use classes in this research. Eight land use classes were investigated in the study, namely, roads, cultivated lands, settlement places, rivers, ponds, forest and grass lands, reservoirs, and dams. The results show that all typical shape properties of land use segments can be quantitatively described by shape metrics. Two of the five complexity metrics, FORM ISPRS Annals of the Photogrammetry, Remote Sensing and Spatial Information Sciences, Volume I-7, 2012
and SqP, were identified to be more effective in differentiation of land use classes in terms of complexity. The results show that the importance of different shape metrics for land use characterization. The study constructs the “Shape Metric Signatures” (SMS) of different land use classes. SMS can serve as accurate and predictive discriminators of land use classes within the study area. The spectrally similar land use classes can be separated clearly in shape metric spaces.
The shape characteristics of land use classes are largely influenced by human activities. The shape characterization of land use classes could also be considered as the measurement of anthropogenic effects on the shapes of land use patches to some extent. The anthropogenic effects will be larger in more densely populated and more intensively utilized area. Thus the shape characteristics will more significant in this kind of areas. An important future research objective is to build the proper probability models of shape metrics for different land use classes. Thus the shape metrics can be integrated into the process of rule-based land use classification along with spectral and textural information. A rule-based reasoning system integrating spectral, textural and shape information will eventually improve the object-oriented classification of land use classes.
REFERENCES
Bauer, M. E., Cipra, J. E., Anuta, P. E., Etheridge, J. B., 1979. Identification and area estimation of agricultural crops by computer classification of LANDSAT MSS data, Remote Sensing of Environment.8(1), pp. 77-92.
Bauer, M. E., Doyle, J. K., Heinert, N. J., 2002. Impervious surface mapping using satellite remote sensing. Proceedings of IEEE Geoscience and Remote Sensing Symposium, Toronto, Canada, 24- 28 June.
Benfield, S. L., Guzman, H. M., Mair, J. M., Young, J. A. T., 2007. Mapping the distribution of coral reefs and associated sublittoral habitats in Pacific Panama: A comparison of optical satellite sensors and classification methodologies. International Journal of Remote Sensing, 28(22), pp. 5047-5070.
Benz, U.C., Hofmann, P., Willhauck, G., Lingenfelder, I. Hetnen, M., 2004. Multi-resolution, object-oriented fuzzy analysis of remote sensing data for GIS-ready information. ISPRS Journal of Photogrammetry and Remote Sensing 58(3-4), 239-258.
Blaschke, T., 2010. Object based image analysis for remote sensing, ISPRS Journal of Photogrammetry and Remote Sensing, 65(1), pp. 2-16.
Frohn, R. C., 2006. The use of landscape pattern metrics in remote sensing image Classification, International Journal of Remote Sensing, 27(10), pp. 2025-2032.
Frohn, R.C., 1998. Remote Sensing for Landscape Ecology: New Metric Indicators for the Monitoring, Modeling, and Assessment of Ecosystems. Lewis Publishers, Boca Raton, FL. Gurney, C., 1981. The use of contextual information to improve land cover classification of digital remotely sensed data.
International Journal of Remote Sensing, 2(4), pp. 379-388. Herold, M., Scepan, J., Clarke, K. C., 2002. The use of remote sensing and landscape metrics to describe structures and changes in urban land uses, Environment and Planning A, 34, pp. 1443-1458.
Ji, C.Y., 2000. Land use classification of remotely sensed data using Kohonen self-organizing feature map neural networks.
Photogrammetric Engineering and Remote Sensing, 66, pp. 1451-1460.
Lewis, H.G., Cote, S., Tatnall, A.R.L., 1997. Determination of spatial and temporal characteristics as an aid to neural network
cloud classification. International Journal of Remote Sensing, 18, pp. 899-915.
Malaviya, S., Munsi, M., Oinam, G., Joshi, P. K., 2010. Landscape approach for quantifying land use land cover change (1972-2006) and habitat diversity in a mining area in Central India (Bokaro, Jharkhand), Environmental Monitoring and Assessment, 170, pp. 215-229.
McGarigal, K., Marks, B. J., 1995. FRAGSTATS: spatial pattern analysis program for quantifying landscape structure. Gen. Tech. Report PNW-GTR-351, USDA Forest Service, Pacific Northwest Research Station, Portland, OR.
Narumalani, S., Zhou, Y., Jelinkski, D. E., 1998. Utilizing geometric attributes of spatial information to improve digital image classification. Remote Sensing Review, 16, pp. 233-253. Nunes, C., Auge, J. I., 1999. Land use and Land-Cover Implementation Strategy. IGBP, Stockholm.
Ozesmi, S. L., Bauer, M. E., 2002. Satellite remote sensing of wetlands. Wetlands Ecology and Management, 10(5), pp. 381-402.
Pacifici, F., Chini, M., Emery, W. J., 2009. A neural network approach using multi-scale textural metrics from very high-resolution panchromatic imagery for urban land use classification, Remote Sensing of Environment, 113, pp. 1276-1292.
Platt, R. V., Rapoza, L., 2008. An evaluation of an object-oriented paradigm for land use/land cover classification. The Professional Geographer, 60, pp. 87-100.
Read, J. M., Lam, N. S-.N., 2002. Spatial methods for characterising land cover and detecting land-cover changes for the tropics, International Journal of Remote Sensing, 23(12), pp. 2457-2474.
Russ, J. C., 2002. The Image Processing Handbook, fourth ed. CRC Press, Boca Raton, FL.
Salas, W. A., Boles, S. H., Frolking, S., Xiao, X. Li, C., 2003. The perimeter/area ratio as an index of misregistration bias in land cover change estimates. International Journal of Remote Sensing, 24, pp. 1165-1170.
Sonka, M., Hlavac, V., and Boyle, R., 1993. Image Processing, Analysis, and Machine Vision. Chapman and Hall, London. Steele, B. M., 2000. Combining multiple classifiers: an application using spatial and remotely sensed information for land cover type mapping. Remote Sensing of Environment, 74, pp. 545-556.
Steele, B. M., Redmond, R. L., 2001. A method of exploiting spatial information for improving classification rules: application to the construction of polygon-based land cover maps. International Journal of Remote Sensing, 22, pp. 3143-3166.
Stuckens, J., Coppin, P. R. Bauer, M. E., 2000. Integrated contextual information with per-pixel classified for improved land cover classification. Remote Sensing of Environment, 71, pp. 282-296.
Thakur, R. S., Dikshit, O., 1997. Contextual classification with IRS LISS-II imagery. ISPRS Journal of Photogrammetry and Remote Sensing, 52, pp. 92-100.
Walker, B. H., Steffen, W. L., 1996. GCTE science: objectives, structure and implementation. In: Walker, B. H., Steffen, W.L. (Eds.), Global Change and Terrestrial Ecosystems. Cambridge University Press, Cambridge, pp. 3-9.
Zhou, Y., Narumalani, S. Jelinski, D.E., 1995. Improving demote sensing derived land use/land cover classification with the aid of spatial information. ACSM/ASPRS Annual Convention & Exposition Technical Papers (Bethesda, MD: ACSM/ASPRS), 4, pp. 363-374.