Quarterly Fiscal Bulletin July – September 2015 Page 1
Executive Summary
By the 30th September 2015, the General Government of Timor-Leste (GGoTL), including the Petroleum Fund (PF) and Donor Fund (DF) ran a net operating balance of $493.9 million and had a net lending capacity of $361.1 million. This is a strong fiscal position, as this money is then invested in the PF. However, the GGoTL is still strongly reliant on the PF to run its current level of operations as without the PF and DF, the GGoTL ran a net operating balance of $88.3 million.
QUARTERLY FISCAL BULLETIN
July
–
September 2015
Government Finance Statistics
(GFS)
GFS Vol. 11
General Directorate of State Finance National Directorate for Economic PolicyQuarterly Fiscal Bulletin July – September 2015 Page 2
1.
Revenues
By the end of September 2015, total revenues for the General Government of Timor-Leste (GGoTL), Petroleum Fund (PF)and Donor Fund (DF) amounted to $1,273.7 million, including $1,039.6 million from oil revenues1, $762.8 million from non-oil revenues and $109.8 million from DF.2
1.1.
Non-oil Revenues
Non-oil revenues are composed of taxes, grants from PF and other revenue by the end of the third quarter of 2015.
Non-oil taxes are the greatest source of revenue in the domestic non-oil economy (62.2% of total non-oil
revenues) totalling $77.3 million by the end of the third quarter of 2015. These are divided into:
Taxes on income, profits and capital gains were 10.0% higher at the end of September 2015 compared to
the same period last year, reaching $32.9 million at the end of the third quarter of 2015.
Taxes on goods and services totalled $36.3 million at the end of the third quarter of 2015. This collection
was 13.0% lower than the $41.9 million collected by the end of the third quarter 2014.
Taxes on international trade and transactions were 16.0% lower at the end of the third quarter of 2015
compared to the same period in 2014 and amounted to $7.9 million by the 30th September 2015. This is mainly due to the decrease in the international price of oil and the appreciation of the US dollar, which have resulted in lower sales tax and import duty collections.
Other taxes totalled $0.1 million at the end of the third quarter 2015, compared to no other taxes collected
during the same period of 2014.
Grants: By the end of the third quarter of 2015, $638.5 million was received in transfers from the PF - this is
100% of the budgeted ESI for this year.
Other revenue totalled $35.9 million by the end of the third quarter of 2015, 16.3% higher than the same
period in 2014. This increase was mostly due to a strong rise in property income (increased from $3.1 million by the end of the third quarter of 2014 to $7.7 million during the same period of 2015) together with a 14.5% increase in the sale of goods and services, particularly in court fees, hospital and medical fees, sale of local produce and permits for accessing forestry product. In addition, electricity fees increased by 18% compared to the same period in 2014.
1.2.
Donor Fund Revenues
Revenues in the DF are obtained by means of grants received from all development partners. By the end of the third quarter of 2015, total DF revenues amounted to $109.8 million.
1.3.
Oil Revenues
Oil revenues are the major source of revenues in Timor-Leste (representing 81.6% of total oil and non-oil
revenues by the end of the third quarter). These are divided into:
Taxes at the end of the third quarter of 2015 totalled $365.9 million, mostly due to taxes on income, profits
and capital gains (which reached $334.9 million by the end of the third quarter of 2015).
1
This excludes grants received by the PF worth $638.5 as total of ESI + Excess Withdrawals million.
2
Quarterly Fiscal Bulletin July – September 2015 Page 3
Other revenue covered from profit from oil, first tranche petroleum, interest, and trust and dividend
income and totalled $763.6 million by 30th of September 2015.
2.
Expenses
Expenses incurred by the end of the third quarter of 2015 by the GGoTL, PF and DF amounted to $779.8 million. The GGoTL spent $674.5 million, DF spent $92.7 million while $12.6 million were expenditures in the PF3.
a.
General Government Expenditures
Expenditure categories for GGoTL are composed of:
Compensation of Employees was 6.8% higher than the $118.5 million spent by the end of the third quarter
of 2014, totalling $126.5 million by the 30th September 2015.
Use of Goods & Services reached $210.6 million by the end of the third quarter of 2015 (a 12.1% decrease
compared to the same period of 2014).
Social benefits totalled $117.2 million at the end of the third quarter of 2015, 43.3% higher than was
recorded in the same period of 2014. This increase was mainly attributed to the current transfer of personal benefits, which is a transfer to veterans and non-government organizations.
Other expenses more than doubled the amount recorded by the same date in 2014 and totalled $220.2
million by the 30th September 2015. This was mostly due to a strong increase in current transfer of public grants, which amounted to $213.5 million during the third quarter of 2015.
b.
Donor Fund Expenditures
DF expenditures reached $92.7 million by the 30th September 2015. This was divided into $13.8 million for expenditures on compensation of employees, $38.3 million spent on use of goods and services and $40.6 million spent on other expenses.
c.
Petroleum Fund Expenditures
PF expenses reached $651.1 million by the end of the third quarter of 2015. $12.6 million were management fees and $638.5 was transfers to the GGoTL.
3.
Net Operating Balance
The et ope ati g ala e is al ulated as e e ues i us e pe ses a d it sho s the Go e e t’s a ilit to sustain its current level of operations.
At the end of the third quarter of 2015, the GGoTL, DF and the PF were running a net operating surplus of $493.9 million. However petroleum revenues played a larger role in the overall fiscal surplus, as the net operating balance for the GGoTL without the PF and DF was $88.3 millionby the 30thSeptember 2015.
3
Quarterly Fiscal Bulletin July – September 2015 Page 4
4.
Net Acquisition of Non-Financial Assets
Net acquisition of non-financial assets e o ds t a sa tio s that ha ge GGoTL’s holdings of non-financial assets. It is broadly equivalent to capital expenditure as recorded in the Charter of Accounts in Timor-Leste. At the end of the third quarter 2015 total acquisition of non-financial assets for the GGoTL including DF and PF stood at $132.8 million. $17.1 million was spent by DF and $115.7 million was spent by the GGoTL (particularly in other infrastructure asset which totalled $82.1 million by the end of the third quarter of 2015).
5.
Net Lending/Borrowing
Net lending / borrowing is the difference between revenues and total expenditures, taking into account the net acquisition of non-financial assets. Net lending for the GGoTL with the PF and DF was $361.1 million at the end of the third quarter of 2015, taking into account the combination of total revenue, expenditures and acquisition of non-financial assets. This means that the GGoTL, the DF and the PF incurred a surplus which is being invested in financial assets, but which was also affected by the $10.0 million from loan disbursements at the close of the third quarter of 2015.
6.
Net Acquisition of Financial Assets
The i ease i the Go e e t’s holdi gs of fi a ial assets is e o ded u de et a uisitio of fi a ial assets. In the case of Timor-Leste, the net lending capacity is being invested, mostly through the PF, in a range of financial assets including shares, securities, currency and deposits, cash and other equities.
By the end of the third quarter of 2015, the net acquisition of financial assets for the GGoTL, DF and the PF was $380.9 million. This was composed of two parts: a $7.5 million deficit in the CFTL, equal to the expenses minus revenue in the GGoTL, and $388.4 million invested in financial instruments in the PF.
The unrealized market value of financial assets is recorded under Other Economic Flows and reached $524.3 million by the end third quarter 20154. This is recorded separately from the net acquisition of financial assets in table 5 of the annex, as it shows changes in value in PF investments which is Net gains/(losses) on FAL at fair value through profit or loss and Net foreign exchange gains/(losses)
7.
Net Incurrence of Liabilities
Net incurrence of liabilities shows the loans disbursement to date in the GGoTL. This totalled $10.0 million by the 30th September 2015.
8.
Final Conclusion
At the closing of the third quarter of 2015, the GGoTL including the PF and DF had a strong fiscal position. However, the GGoTL is still strongly reliant on the petroleum sector, as without the PF and DF, it would have a net lending capacity of $-27.4 million. Comparatively the GGoTL, together with the PF and DF, ran a net operating balance of $493.9 million and had a net lending capacity of $361.1 million. Total net lending capacity is then being invested in financial assets in the PF.
4
Quarterly Fiscal Bulletin July – September 2015 Page 5
Table 1. Statement of All Government Operations (GGoTL, PF, DF, Transactions)
Revenue 1 408.0 473.7 392.0 0.0 1,273.7
Taxes 11 174.1 140.6 128.6 0.0 443.3
Taxes on income, profits, and capital gains 111 140.3 117.5 109.9 0.0 367.8
Taxes on goods & services 114 31.2 20.4 15.8 0.0 67.3
Taxes on international trade & transactions 115 2.5 2.6 2.8 0.0 8.0
Other taxes 116 0.0 0.1 0.1 0.0 0.2
Grants 13 21.5 41.8 46.5 0.0 109.8
Other revenue 14 212.4 291.2 216.9 0.0 720.6
Property income 141 203.9 281.8 3.6 0.0 489.3
Other 142-145 8.5 9.4 21.3 0.0 39.2
Expense 2 217.3 240.3 322.2 0.0 779.8
Compensation of employees 21 47.0 45.1 48.3 0.0 140.4
Use of goods & services 22 40.8 96.5 124.2 0.0 261.5
Consumption of fixed capital 23 0.0 0.0 0.0 0.0 0.0
Interest 24 0.0 0.0 0.0 0.0 0.0
Grants 26 0.0 0.0 0.0 0.0 0.0
Social benefits 27 18.2 17.0 82.0 0.0 117.2
Other expense 28 111.3 81.7 67.7 0.0 260.7
Gross operating balance [1-2+23] GOB 190.7 233.4 69.8 0.0 493.9
Net operating balance [1-2] NOB 190.7 233.4 69.8 0.0 493.9
Net acquisition of nonfinancial assets 31 5.0 52.7 75.2 0.0 132.8
Acquisition of nonfinancial assets 311 5.0 52.7 75.2 0.0 132.8
Buildings & Structures 3111 4.2 46.9 70.8 0.0 121.9
Machinery & Equipment 3112 0.8 5.8 4.4 0.0 11.0
Consumption of fixed capital [=23] 313 0.0 0.0 0.0 0.0 0.0
Net lending / borrowing [1-2-31 = 1-2M] NLB 185.7 180.7 -5.3 0.0 361.1
Net acquisition of financial assets 32 185.9 192.3 2.7 0.0 380.9
by instrument 0.0 0.0 0.0 0.0 0.0
Currency and deposits 3202 187.0 123.3 48.0 0.0 358.4
Securities other than shares 3203 -25.8 22.8 -59.9 0.0 -63.0
Loans 3204 0.0 5.8 4.0 0.0 9.8
Shares and other equity 3205 -17.2 15.2 -40.0 0.0 -42.0
Other accounts receivable 3208 41.9 25.2 50.5 0.0 117.7
Net incurrence of liabilities 33 0.2 5.8 4.0 0.0 10.0
Loans 3304 0.2 5.8 4.0 0.0 10.0
Other accounts payable 3308 0.0 0.0 0.0 0.0 0.0
Statistical discrepancy [32 - 33 - NLB-] NLBz 0.0 5.8 4.0 0.0 9.8
Memorandum item:
Total expenditure [2+31] 2M 222.3 293.0 397.4 0.0 912.6
Note: Statistical Discrepancy should be zero.
Consumption of fixed capital will have to be calculated from inventory
Accumulated Total Data for 2015, in millions of US dollars. Total
Quarterly Fiscal Bulletin July – September 2015 Page 6
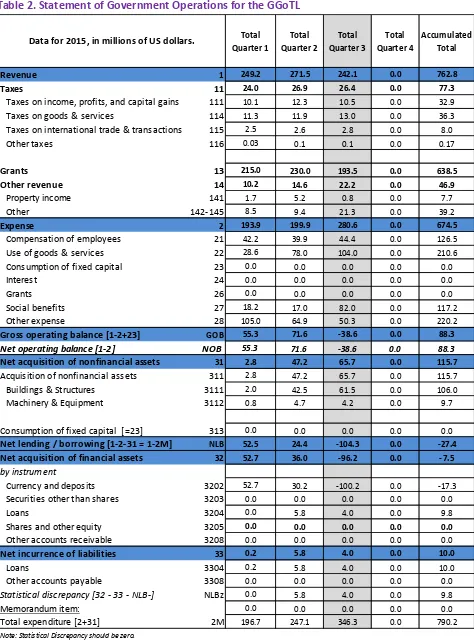
Table 2. Statement of Government Operations for the GGoTL
Revenue 1 249.2 271.5 242.1 0.0 762.8
Taxes 11 24.0 26.9 26.4 0.0 77.3
Taxes on income, profits, and capital gains 111 10.1 12.3 10.5 0.0 32.9
Taxes on goods & services 114 11.3 11.9 13.0 0.0 36.3
Taxes on international trade & transactions 115 2.5 2.6 2.8 0.0 8.0
Other taxes 116 0.03 0.1 0.1 0.0 0.17
Grants 13 215.0 230.0 193.5 0.0 638.5
Other revenue 14 10.2 14.6 22.2 0.0 46.9
Property income 141 1.7 5.2 0.8 0.0 7.7
Other 142-145 8.5 9.4 21.3 0.0 39.2
Expense 2 193.9 199.9 280.6 0.0 674.5
Compensation of employees 21 42.2 39.9 44.4 0.0 126.5
Use of goods & services 22 28.6 78.0 104.0 0.0 210.6
Consumption of fixed capital 23 0.0 0.0 0.0 0.0 0.0
Interest 24 0.0 0.0 0.0 0.0 0.0
Grants 26 0.0 0.0 0.0 0.0 0.0
Social benefits 27 18.2 17.0 82.0 0.0 117.2
Other expense 28 105.0 64.9 50.3 0.0 220.2
Gross operating balance [1-2+23] GOB 55.3 71.6 -38.6 0.0 88.3
Net operating balance [1-2] NOB 55.3 71.6 -38.6 0.0 88.3
Net acquisition of nonfinancial assets 31 2.8 47.2 65.7 0.0 115.7
Acquisition of nonfinancial assets 311 2.8 47.2 65.7 0.0 115.7
Buildings & Structures 3111 2.0 42.5 61.5 0.0 106.0
Machinery & Equipment 3112 0.8 4.7 4.2 0.0 9.7
Consumption of fixed capital [=23] 313 0.0 0.0 0.0 0.0 0.0
Net lending / borrowing [1-2-31 = 1-2M] NLB 52.5 24.4 -104.3 0.0 -27.4
Net acquisition of financial assets 32 52.7 36.0 -96.2 0.0 -7.5
by instrument
Currency and deposits 3202 52.7 30.2 -100.2 0.0 -17.3
Securities other than shares 3203 0.0 0.0 0.0 0.0 0.0
Loans 3204 0.0 5.8 4.0 0.0 9.8
Shares and other equity 3205 0.0 0.0 0.0 0.0 0.0
Other accounts receivable 3208 0.0 0.0 0.0 0.0 0.0
Net incurrence of liabilities 33 0.2 5.8 4.0 0.0 10.0
Loans 3304 0.2 5.8 4.0 0.0 10.0
Other accounts payable 3308 0.0 0.0 0.0 0.0 0.0
Statistical discrepancy [32 - 33 - NLB-] NLBz 0.0 5.8 4.0 0.0 9.8
Memorandum item: 0.0 0.0 0.0 0.0 0.0
Total expenditure [2+31] 2M 196.7 247.1 346.3 0.0 790.2
Note: Statistical Discrepancy should be zero.
Consumption of fixed capital will have to be calculated from inventory
Accumulated Total Data for 2015, in millions of US dollars. Total
Quarterly Fiscal Bulletin July – September 2015 Page 7
Table 3. Statement of Government Operations for the Donor Fund
Revenue 1 21.5 41.8 46.5 0.0 109.8
Taxes 11 0.0 0.0 0.0 0.0 0.0
Taxes on income, profits, and capital gains 111 0.0 0.0 0.0 0.0 0.0
Taxes on goods & services 114 0.0 0.0 0.0 0.0 0.0
Taxes on international trade & transactions 115 0.0 0.0 0.0 0.0 0.0
Other taxes 116 0.0 0.0 0.0 0.0 0.0
Grants 13 21.5 41.8 46.5 0.0 109.8
Other revenue 14 0.0 0.0 0.0 0.0 0.0
Property income 141 0.0 0.0 0.0 0.0 0.0
Other 142-145 0.0 0.0 0.0 0.0 0.0
Expense 2 19.3 36.3 37.0 0.0 92.7
Compensation of employees 21 4.8 5.2 3.8 0.0 13.8
Use of goods & services 22 8.2 14.4 15.7 0.0 38.3
Consumption of fixed capital 23 0.0 0.0 0.0 0.0 0.0
Interest 24 0.0 0.0 0.0 0.0 0.0
Grants 26 0.0 0.0 0.0 0.0 0.0
Social benefits 27 0.0 0.0 0.0 0.0 0.0
Other expense 28 6.3 16.8 17.5 0.0 40.6
Gross operating balance [1-2+23] GOB 2.1 5.5 9.5 0.0 17.1
Net operating balance [1-2] NOB 2.1 5.5 9.5 0.0 17.1
Net acquisition of nonfinancial assets 31 2.1 5.5 9.5 0.0 17.1
Acquisition of nonfinancial assets 311 2.1 5.5 9.5 0.0 17.1
Buildings & Structures 3111 2.1 4.4 9.3 0.0 15.8
Machinery & Equipment 3112 0.0 1.1 0.2 0.0 1.3
Consumption of fixed capital [=23] 313 0.0 0.0 0.0 0.0 0.0
Net lending / borrowing [1-2-31 = 1-2M] NLB 0.0 0.0 0.0 0.0 0.0
Net acquisition of financial assets 32 0.0 0.0 0.0 0.0 0.0
by instrument 0.0 0.0 0.0 0.0 0.0
Currency and deposits 3202 0.0 0.0 0.0 0.0 0.0
Securities other than shares 3203 0.0 0.0 0.0 0.0 0.0
Loans 3204 0.0 0.0 0.0 0.0 0.0
Shares and other equity 3205 0.0 0.0 0.0 0.0 0.0
Other accounts receivable 3208 0.0 0.0 0.0 0.0 0.0
Net incurrence of liabilities 33 0.0 0.0 0.0 0.0 0.0
Loans 3304 0.0 0.0 0.0 0.0 0.0
Other accounts payable 3308 0.0 0.0 0.0 0.0 0.0
Statistical discrepancy [32 - 33 - NLB] NLBz 0.0 0.0 0.0 0.0 0.0
Memorandum item: 0.0 0.0 0.0 0.0 0.0
Total expenditure [2+31] 2M 21.5 41.8 46.5 0.0 109.8
Note: Statistical Discrepancy should be zero.
Consumption of fixed capital will have to be calculated from inventory
Accumulate d Total Data for 2015, in millions of US dollars. Total
Quarterly Fiscal Bulletin July – September 2015 Page 8 Table 4. Statement of Government Operations for the Petroleum Fund
Table 5. Analytical Framework for the Petroleum Fund
Revenue 1 352.3 390.3 296.9 0.0 1,039.6
Taxes 11 150.1 113.7 102.2 0.0 365.9
Taxes on income, profits, and capital gains 111 130.2 105.2 99.4 0.0 334.9
Taxes on goods & services 114 19.9 8.5 2.7 0.0 31.1
Taxes on international trade & transactions 115 0.0 0.0 0.0 0.0 0.0
Other taxes 116 0.0 0.0 0.0 0.0 0.0
Grants 13 0.0 0.0 0.0 0.0 0.0
Other revenue 14 202.2 276.6 194.8 0.0 673.6
Property income 141 202.2 276.6 2.7 0.0 481.6
Other 142-145 0.0 0.0 0.0 0.0 0.0
Expense 2 219.1 234.1 198.0 0.0 651.1
Compensation of employees 21 0.0 0.0 0.0 0.0 0.0
Use of goods & services 22 4.1 4.1 4.5 0.0 12.6
Consumption of fixed capital 23 0.0 0.0 0.0 0.0 0.0
Interest 24 0.0 0.0 0.0 0.0 0.0
Grants 26 215.0 230.0 193.5 0.0 638.5
Social benefits 27 0.0 0.0 0.0 0.0 0.0
Other expense 28 0.0 0.0 0.0 0.0 0.0
Gross operating balance [1-2+23] GOB 133.3 156.3 98.9 0.0 388.4
Net operating balance [1-2] NOB 133.3 156.3 98.9 0.0 388.4
Net acquisition of nonfinancial assets 31 0.0 0.0 0.0 0.0 0.0
Acquisition of nonfinancial assets 311 0.0 0.0 0.0 0.0 0.0
Buildings & Structures 3111 0.0 0.0 0.0 0.0 0.0
Machinery & Equipment 3112 0.0 0.0 0.0 0.0 0.0
Consumption of fixed capital [=23] 313 0.0 0.0 0.0 0.0 0.0
Net lending / borrowing [1-2-31 = 1-2M] NLB 133.3 156.3 98.9 0.0 388.4
Net acquisition of financial assets 32 133.3 156.3 98.9 0.0 388.4
by instrument
Currency and deposits 3202 134.4 93.1 148.3 0.0 375.7
Securities other than shares 3203 -25.8 22.8 -59.9 0.0 -63.0
Loans 3204 0.0 0.0 0.0 0.0 0.0
Shares and other equity 3205 -17.2 15.2 -40.0 0.0 -42.0
Other accounts receivable 3208 41.9 25.2 50.5 0.0 117.7
Net incurrence of liabilities 33 0.0 0.0 0.0 0.0 0.0
Loans 3304 0.0 0.0 0.0 0.0 0.0
Other accounts payable 3308 0.0 0.0 0.0 0.0 0.0
Statistical discrepancy [32 - 33 - NLB-] NLBz 0.0 0.0 0.0 0.0 0.0
Memorandum item: 0.0 0.0 0.0 0.0 0.0
Total expenditure [2+31] 2M 219.1 234.1 198.0 0.0 651.1
Data for 2015, in millions of US dollars. Accumulated
Quarterly Fiscal Bulletin July – September 2015 Page 9
Terminology
Compensation of employees are remuneration in cash or kind, payable to an employee in return for work
done and social insurance contributions made by a general government unit on behalf of its employees. Compensation of employees is incurred on a monthly basis in Timor-Leste.
Expenses include all transactions that decrease the net worth of the general government sector.
Expenditures are financed from the ESI, excess withdrawals from the Petroleum Fund, loans or the use of cash balance.
General Government of Timor-Leste is the combination of the Consolidated Fund (CFTL), Human Capital
and Development Fund (HCDF) and the Infrastructure Fund in Timor-Leste.
Grants: are non-compulsory current or capital transfers from one government unit to another government
unit or an international organization. These are divided into estimated sustainable income (ESI) and excess withdrawals.
Gross Operating Balance is the revenue minus expenses other than consumption of fixed capital. It
indicates whether the government is able to sustain its current level of operations and ideally should portray a surplus. However consumption of fixed capital is not measured in Timor-Leste, therefore Gross Operating Balance is equal to Net Operating Balance.
Net lending/borrowing is a balancing item defined as the net acquisition of all financial assets less the net
incurrence of all liabilities from transactions. It is thus a summary measure indicating the extent to which GGoTL is either putting financial resources at the disposal of other sectors in the economy or utilizing the financial resources generated by other sectors.
Net Operating Balance is equal to revenue minus expenses and indicates whether the government is able
to sustain its current level of operations.
Other Revenue includes a variety of forms of revenue earned by GGoTL including property income, sales of
goods, fines & penalties and other miscellaneous revenue.
Revenues are all transactions that increase the net worth of general government sector and exclude
domestic and external borrowing. Revenues tend to increase during the last period of the year, due to the collection of accumulated taxes.
Social benefits are current transfers to households to provide for needs arising from events such as
sickness, unemployment, retirement, housing or family circumstances.
Taxes on goods & services are taxes levied on the production, extraction, sale, transfer, leasing or delivery
of goods and rendering of services.
Taxes on income, profits, and capital gains are composed of corporate taxes in Timor-Leste.
Taxes on international trade & transactions include sales tax and other import duties in Timor-Leste.
Transactions in financial assets and liabilities record financial transactions. I.e. they record transactions
that change a go e e t’s holdi gs of fi a ial assets a d lia ilities. I Ti o -Leste financial assets are all composed of currency and deposit.
Transactions in nonfinancial assets a d lia ilities e o d t a sa tio s that ha ge a go e e t’s holdi gs
of nonfinancial assets. In Timor-Leste these assets are classified as Buildings & Structures and Machinery & Equipment.
Use of goods & services includes total value of goods and services purchased by the general government