Analysis of grape ESTs: global gene expression patterns in leaf
and berry
Effie Ablett
a,*, George Seaton
b, Kirsten Scott
a, Dale Shelton
a, Michael W. Graham
c,
Peter Baverstock
d, L. Slade Lee
a, Robert Henry
aaCentre for Plant Conser6ation Genetics,Southern Cross Uni6ersity,P.O.Box157,Lismore,NSW 2480, Australia
bInstitute for Cell and Animal Population Biotosy,Ashworth Laborities,King’sBuildings,Edinburgh Uni6ersity,Edinburgh,EH9 3JT,UK cQueensland Agricultural Biotechnology Centre,Le6el4,Gehrmann Laboratories,Uni6ersity of Queensland,St Lucia,Qld4072,Australia
dGraduate Research College,Southern Cross Uni6ersity,P.O.Box157,Lismore,NSW2480,Australia
Received 9 March 2000; received in revised form 15 May 2000; accepted 3 July 2000
Abstract
Analysis of 2479 ESTs fromVitis6iniferaberry tissue and 2438 from leaf revealed that 1% of the ESTs match to knownVitis
proteins, 72% to plant proteins, 11% to non-plant, and 16% had no match (P[N]\0.5). The levels of redundancy were similar
in the leaf and berry libraries. Only 12% of the genes matched by the ESTs were common to both libraries indicating marked differences in the genes expressed in the two tissues. The abundance of transcripts with predicted cellular roles in leaf and berry were estimated by classifying the primary BLAST matches to known proteins (score \80) into functional categories. Thirty-six
percent of the leaf transcripts were involved in photosynthesis, compared to 3% in the berry. This is a much higher proportion of transcripts involved with a function limited to specialized cells, than was found when transcripts of 33 human tissues were compared using a similar approach, suggesting plant cells may involve their cellular machinery to a greater extent in specialized activities than animal cells. Relatively enhanced expression of specific transcription factors, and genes involved in defense, detoxification, stress response, proteolysis, trafficing, and signal transduction, suggests berry tissue is actively engaged in responding to environmental stimuli. © 2000 Elsevier Science Ireland Ltd. All rights reserved.
Keywords:Expressed sequence tags; Electronic Northern;Vitis6inifera; Gene expression; cDNA
www.elsevier.com/locate/plantsci
1. Introduction
To date there have been no large-scale EST projects on fruit-bearing woody cultivars, and rel-atively few ESTs are available from woody plant species. With the huge amount of effort that has gone into cereal EST projects, it is surprising that so little attention has been given to woody species. A recent assessment of dbEST listed nearly 245 000 plant ESTs. Most were from cereals, with the only significant listings of woody plant species being 7554 ESTs from loblolly pine, 4809 from poplar, 1251 from citrus and 430 from apple
(dbEST release 120399, December 3, 1999). The grape project at the Centre for Plant Conservation Genetics, Lismore, Australia, is producing grape (Vitis 6inifera) ESTs from a range of tissues and cultivars to advance gene discovery in woody plant species, particularly in the areas of dor-mancy and budburst, berry development and vine physiology.
ESTs were developed in 1991 as a relatively inexpensive and rapid means to identify large numbers of expressed genes [1]. Gene functions are assigned to ESTs based on homology to known proteins from other species. Currently about 50% of ESTs can be identified in this way. With the number of ESTs in dbEST approaching 3.4 mil-lion, other approaches are needed to assign func-tion to the growing numbers of unidentified ESTs.
* Corresponding author. Tel.: +61-2-66203486; fax: + 61-2-66222080.
E-mail address:[email protected] (E. Ablett).
As the scope of EST projects continues to increase, EST data on large numbers of expressed genes from a variety of tissues, cell types and develop-ment stages is becoming available. Analysis of ESTs is now being used to identify novel genes exhibiting specific expression patterns, and to as-sign gene function to certain cell types.
In order to analyze gene expression in specific samples from EST data, numbers of transcripts need to be quantitated from the sampled ESTs. In an unbiased cDNA library, the number of ESTs matching a particular gene should reflect the abun-dance of the corresponding cDNA in the library and the level of its mRNA in the tissue from which the library was derived. EST sampling can be an effective and quantitative measure of steady state mRNA levels [2]. This ‘electronic northern’ ap-proach has been used to develop expression profi-les in a range of human [3], mouse, invertebrate [4], and plant tissues [5].
Analysis of transcripts from EST data has also been used to discover novel genes only expressed in mouse renal proximal tubule [6] and human granu-locytes [7] as well as genes expressed at different levels in human neoplastic cells compared to their normal counterparts [8] and in cultured cells after nerve growth factor treatment [2]. Recently re-ported methods of EST analysis [5] allow identifi-cation of ESTs showing similar expression profiles, thereby raising the possibility of assigning function to novel genes by virtue of their having similar expression patterns to genes related in function. These applications will be escalated by the use of high density DNA arrays and chips (for review see [9]) and methods such as SAGE [10], that allow expression levels of even larger numbers of tran-scripts to be analyzed.
When data is available from sufficient libraries, temporal and/or developmental expression profiles can be generated. This has been demonstrated for six stages of soybean embryo development [11]. As in conventional northerns, this data can be used to help understand more fully the function of the corresponding gene products in biological pro-cesses, but with the EST approach this is extended to thousands of genes. Analysis of the expression of large numbers of genes combined with knowl-edge of their function allows us to perceive the global picture of biological processes in different cell types. These studies have been initiated by using primary BLAST homologues to divide ESTs
matching known proteins into functional cate-gories defined for bacteria [12] and modified for yeast [13] and plants [14]. Data for this type of analysis is available for 37 human tissues [3],
Schistosoma mansoni[4], cabbage bud flowers [15], and wood-forming tissues of poplar [16]. Here data from the analysis of the first 5000 grape ESTs of the Centre for Plant Conservation Genetics’ grape project are reported. Sequenced from two Char-donnay libraries, one derived from leaf tissue and the other from berry, the grape ESTs have allowed us to look at global gene expression in two fairly specialized types of plant cells.
2. Methods
2.1. cDNA library preparation
Total RNA was isolated as described by [17] from fully expanded Chardonnay leaves with no obvious signs of senescence. Poly A+ RNA was then purified using oligo (dT) cellulose according to the manufacturer’s (Boehringer Mannheim) pro-tocol. Total RNA was isolated from pre-veraison Chardonnay berries, average size 1.0 – 1.4 cm, using CTAB extraction and lithium chloride precipita-tion [18]. This procedure gave low yields of RNA, but it seemed to be of good quality as judged by agarose electrophoresis (not shown).
Double stranded cDNAs were prepared from 5 mg of poly A+ leaf RNA or 25 mg total berry RNA using a Stratagene cDNA synthesis kit (c200401) according to the manufacturer’s proto-col. This resulted in the production of hemimethy-lated cDNAs with 5% Eco RI and 3% Xho I restriction sites; these were cloned, asymmetrically, into Eco RI-Xho I digested pBluescript SK II+. Following ligation, plasmids were transformed into electro-competent XL1-Blue-MRF’ cells (Strata-gene) and plated for blue-white selection, all analy-ses were performed on white colonies. Total libraries of approximately 50 000 recombinants were obtained in both cases.
2.2. Sequencing and initial data processing
terminator sequencing chemistry and ABI377 au-tomatic DNA sequencers. Clones were sequenced from the 5% end only and sequences of more than 450 bp and less than 2% Ns were selected for further analysis. After vector trimming each EST was subjected to both a BLASTN 2.0.5 and a BLASTX 2.0.5 search [19] against the non-redun-dant protein and nucleotide databases of Gen-bank, EMBL and PIR and Swiss-Prot, releases 1.4.99. The BLAST score (bits) using the BLO-SUM62 and the PAM250 matricies for BLASTN and BLASTX respectively, was used to classify the alignments into strong, medium and weak homology.
For details of individual EST sequences contact the Centre for Plant Conservation Genetics, e-mail [email protected].
2.3. Library quality
Contaminating sequences (non grape and non cDNA) were detected by searching primary BLASTN matches for ESTs with very strong ho-mology (logP(N) or E value B−37) to viral, fungal, bacterial, mitochondrial, chloroplast, and ribosomal RNA genes. These usually fell into two distinct groups based on P(N) values. The weaker matches, score B150, logP(N)\−30) are likely to represent grape cDNAs with similar sequences
to the non-grape or non-cDNA BLAST matches. Grape ESTs were found with this level of homol-ogy to mammalian genes (see Table 2), suggesting this level of homology is consistent with highly conserved genes.
A comparison of the proportion of full length and near full length cDNAs represented in each of the libraries was made by assessing the position in the BLAST match of the 5% end of the region of homology identified in the BLAST output. This will give an underestimate of the number of cDNA clones that are full-length or near full-length, be-cause of evolutionary changes in the start site, and full alignments were not carried out. However it is a quick way of obtaining data directly from the BLAST output in order to compare library quality without lengthy analysis.
2.4. Cellular roles of primary homologues
The putative cellular roles of the transcripts identified by ESTs with strong or nominal homol-ogy with known proteins were assigned by exami-nation of primary BLAST matches (Genbank ‘definition’ entries), using a functional catalogue of plant genes [14] based on the yeast functional catalogue [13]. The assignments were carried out by the authors from their knowledge of biochem-istry and plant physiology, and reference to the JDBC website. The plant gene catalogue was modified to include an additional category 21 for genes related to specific areas of plant and grapevine development.
3. Results
Sequencing of two grape cDNA libraries pro-duced 2479 ESTs from berry tissue and 2438 from leaf; 99% were greater than 400 bp after trimming vector sequences, and all had less than 2% am-biguous bases. Library quality was assessed by estimating the proportion of contaminating non-cDNA pathogen sequences and 5% integrity from BLASTN and BLASTX outputs (see Table 1).
The libraries were of reasonable quality having only 5% contamination with non-cDNA (mainly ribosomal RNA) and pathogen sequences. At least 40 – 50% of the cDNAs were near full length. The berry library made from total RNA contains more full-length sequences than the leaf library made from mRNA, and a similar number of ribosomal
Table 1
Ribosomal RNA sequencesa
Other non-cDNA sequencesb 1.60 0.97 0.08 1.05 Pathogen cDNAsc
cDNA length
38.4 28.8
Contain translational start sited
45.1 56.9 Within 10 amino acids of
translational starte
aESTs with matches to ribosomal RNA (BLASTN score] 150, logP(N)B−37).
bESTs with matches to mitochondrial, chloroplast and vector DNA (BLASTN score]150, logP(N)B−37).
cESTs with matches to viral and other known pathogens (BLASTN score]150, 150, logP(N)B−37).
dRegion of homology with BLASTX match contains the translational start site.
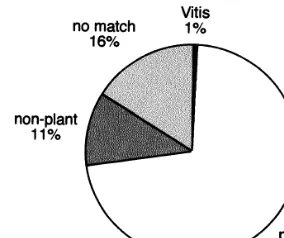
Fig. 1. Overview of the combined ESTs from both libraries. Primary BLAST homologues are grouped by source.
RNA and other non-cDNA sequences. This confi-rms that the use of total RNA rather than mRNA in the first step of library construction has not resulted in reduced reverse transcription or in-creased false priming during first strand synthesis.
3.1. O6er6iew of BLAST results
After removal of ribosomal and pathogen se-quences, primary homologies with P[N]B0.5, de-termined using BLASTX and the non-redundant protein database, were classified as strong (31%; BLAST score]150), nominal (26%; 150\score] 80), and weak (27%; scoreB80). The remaining ESTs with P[N]\0.5 were considered to have no match (16%).
The ESTs with measurable homology (P[N]B 0.5) were further classified according to the source of their BLAST match, and Fig. 1 gives an overview of the 4661 grape ESTs. Seventy-two percent matched to plant genes. The small percent-age of matches toVitisgenes reflects the number of grape genes (less than 100) listed in the non-redun-dant databases.
Eleven percent of the ESTs matched to non-plant genes, of these 4.6% of ESTs matched with the Bacteria and Archea, 2.2% with simple eukaryotes (including fungi, yeasts, and protozoans), 1.7% with invertebrate metazoans and 2.8% with the vertebrates. Within each of the major taxa groups the degree of homology (see Table 2) reflected in part evolutionary relationships with more distant taxa; grape genes having a higher degree of homol-ogy with higher plants than with genes from other kingdoms. All groups apart from higher plants, e.g. fungi, bacteria and vertebrates had similar propor-tions of high medium and low homology to the grape ESTs which does not reflect their evolution-ary distances from higher plants. A small propor-tion (11%) of vertebrate genes retained strong homology with the grape ESTs suggesting signifi-cant numbers of very highly conserved genes from prokaryotes to vertebrates and to higher plants.
3.2. Redundancy within and between the libraries
Redundancy of ESTs with strong or nominal homology (BLAST score\80) was analyzed by examining the primary BLAST matches to identify ESTs likely to represent the same gene. Fig. 2 gives an overview of the redundancy analysis
Table 2
Degree of homology within major taxa groups
Taxa group Strong (%)a Nominal (%)a Weak (%)a
Total ESTsb 36 31 32
Plantc 41.2 33.0 25.8
5.9 69.3
Simple 24.8
eukaryotesd
69.9 Prokaryotes 6.9 23.2
and virusese
Invertebrate 2.5 22.5 75.0
metazoaf
69.0 Vertebratesg 11.6 19.4
aESTs with measurable homology (P[N]B0.5) divided into strong (BLAST score]150), nominal (150\score]80), weak
(scoreB80).
bTotal ESTs from both the leaf and berry libraries. cESTs with homology to sequences from the Viridiplantae. dESTs with homology to sequences from the Fungi, and protozoa.
eESTs with homology to sequences from the Bacteria, Archaea and viruses.
fESTs with homology to sequences from the non-chordata metazoa.
gESTs with homology to sequences from the Chordata.
based on BLAST matches. The leaf and berry libraries had similar proportions of single and multiple copy ESTs. Twenty-two percent of the genes in each library (or 12% of the total number of distinct genes) were common to both libraries (see Fig. 2). Overall 2330 distinct gene matches were obtained from the total ESTs of both libraries.
3.3. Abundance of transcripts with predicted cellular roles in berry and leaf
Examination of the primary BLAST matches, revealed 4 classes of ESTs with varying potential to predict their cellular function (see Table 3). ESTs in class A, matching sequences of known proteins with strong and nominal homology, are likely to be transcripts of genes with similar func-tions. The function of the BLAST match has been used to assign cellular roles to this group (see below). Cellular roles could not be reliably as-signed to ESTs in class B (‘weak homology’) with-out carrying with-out motif analysis. Almost 10% of the ESTs (class C) matched to ‘unknown protein’ or ‘putative proteins’ with no indication of the func-tion of the gene product. Most of these were ESTs from other species that had been entered into the non-redundant database. The fourth class, D, of 756 ESTs with no matches, may contain gene sequences novel to grapes, along with ESTs from other species that have not yet been put into the public domain.
The putative cellular roles of the transcripts identified by ESTs of class A were assigned by examination of primary BLAST homologues,
us-ing 13 putative cellular roles for plant genes, and multiple subcategories (see Table 4). About 8% of class A ESTs in the leaf library and 13% in the berry library could not be assigned with certainty (unclassified).
A major proportion of the leaf ESTs (36%) represented transcripts involved in photosynthesis. These were grouped separately from the rest of the transcripts involved in energy production (cate-gory 2); in other cases categories were combined, to give an overview of the major cellular roles of the classified transcripts (see Fig. 3). Compared to the leaf library, the berry library had a smaller proportion of transcripts involved in photosynthe-sis (3%), but a higher proportion involved in de-fense and resistance (18 compared to 7%), energy minus photosynthesis (7 compared to 4%), signal transduction (8 compared to 5%), cell structure and plant growth (15 compared to 8%), and protein production and processing growth (24 compared to 17%). Primary and secondary metabolism transcripts were represented by a simi-lar proportion of ESTs in each of the libraries.
A detailed breakdown of the percentage of tran-scripts in each subcategory for the leaf and berry libraries is shown in Table 4. The high proportion of disease and defense category transcripts in berry was largely due to elevated defense-regulated (11.02), stress response (11.05) and detoxification (11.06) sub-categories. In the energy (02) minus photosynthesis, cell division (03) and plant devel-opment (21), signal transduction (10) and trans-porters (07) categories, the differences between leaf and berry transcript abundance in all of the sub-categories reflect the differences in the main
cate-Table 3
Classification of ESTs according to function prediction
N total(%)c
N berry (%)b
N leaf (%)a BLAST match
1102 (47.6)
Class A: known function strong and nominal homologyd 1176 (50.1) 2278 (48.9)
637 (27.5) 1168 (25.1)
Class B: known function, weak homologye 531 (22.6)
Class C: unknown functionf 191 (8.3) 268 (11.4) 459 (9.8)
Class D: no matchg 383 (16.6) 373 (15.9) 756 (16.2)
aNumber and percentage (in brackets) of ESTs in each class of the leaf library ESTs. bNumber and percentage (in brackets) of ESTs in each class of the berry library ESTs. cNumber and percentage (in brackets) of ESTs in each class of the combined ESTs.
dESTs with a BLAST match to genes encoding proteins of known or putative function, BLAST score]80. eESTs with a BLAST match to genes encoding proteins of known or putative function, BLAST scoreB80.
fESTs with a BLAST match to genes encoding ‘unknown, putative, or hypothetical proteins’ with no reference to any function or known protein.
Table 4
Abundance of transcripts with various roles in the leaf and berry librariesa
Functional category % leafb % berryc % berryc
Functional category % leafb
10.25
11.43 07 Transporters 1.45 3.99
01 Metabolism
0.36 07.07 Sugars 0.00 0.36
01.02 Nitrogen and sulphur
07.10 Amino acids 0.00 0.18
01.03 Nucleotides 0.54 0.45
07.13 Lipids 0.45
0.64 0.36
01.04 Phosphate 0.27
07.22 ATPase 0.09
01.05 Sugars and polysaccharides 2.63 4.26 0.91
07.25 ABC-type 0.09
1.81 0.09
01.06 Lipid and sterol 2.27
0.91
1.00 07.99 Others 0.45 1.45
01.07 Cofactors
08 Intracellular traffic 0.64
3.99 1.81
02 Energy(less photosynthesis) 7.08
02.01 Glycolysis 1.27 1.63 08.01 Nuclear 0.00 0.27
08.04 Mitochondrial 0.27
02.02 Gluconeogenesis 0.27 1.72 0.09
08.07 Vesicular 0.18
0.54 1.00
0.18 02.07 Pentose phosphate
08.10 Peroxisomal 0.18
02.10 TCA pathway 0.27 0.54 0.27
08.16 Extracellular 0.00
09 Cell structure 4.26 6.26
02.30Photosynthesis 35.57 3.36 09.01 Cell wall 1.18 3.36
09.04 Cytoskeleton 1.72 1.63
09.07 ER/Golgi 0.00
2.00 0.45
03 Cell growth/di6ision 1.45
09.13 Chromosomes 0.36
03.01 Cell growth 0.36 0.09 0.09
09.16 Mitochondria 0.09
0.00 0.00
03.16 DNA synth/replication 0.09
0.27
0.27 09.19 Peroxisome 0.00 0.27
03.19 Recombination/repair
0.45 09.26 Chloroplast 0.64 0.27
03.26 Growth regulators
09.99 Others 0.09
03.99 Other 0.09 0.27 0.00
10 Signal transduction 4.72
5.81 8.89 8.17
04 Transcription
10.01 Receptors 0.64
04.01 rRNA synthesis 0.64 0.64 0.73
10.04 Mediators 1.09
0.09 2.27
04.10 tRNA synthesis 0.36
04.19 mRNA systhesis 0.36 0.64 10.0404 Kinases 1.54 2.36
10.0407 Phosphatases 0.27
0.82 0.73
0.54 04.1901 General TFs
4.99
2.72 10.0410 G proteins 1.18 2.09
04.1904 specific TFs
04.1907Chromatin modification 0.09 0.36
11 Disease/defense 6.90
1.36 18.78
04.22 mRNA processing 1.09
11.01 Resistance genes 0.18 0.36 11.02 Defense-regulated 1.45
10.98 5.44
05 Protein synthesis 6.53
5.90
4.08 11.03 Cell death 0.36 0.73
05.01 Ribosomal proteins
11.05 Stress responses 1.54
4.99 4.63
2.00 05.04 Translation factors
0.09
0.09 11.06 Detoxification 3.18 7.62
05.07 Translation control
11.99 Others 0.18
05.10 tRNA synthases 0.09 0.00 0.00
0.00 0.27
05.99 Others
20 Secondary metabolism 3.18 2.63 20.1 Phenylpropanoids/phenolics 1.54
7.08 1.00
06 Protein destination and storage 4.54
0.82
0.73 20.2 Terpenoids 0.73 0.82
06.01 Folding and stability
20.4 Non-protein 0.18
0.09 0.18
0.18 06.04 Targeting
0.64
0.27 20.5 Amines 0.09 0.00
06.07 Modification
20.99 Others 0.64 0.64
06.13 Proteolysis 3.09 5.35
0.18 06.20 Storage proteins 0.27
21 De6elopment 1.18 2.00
21.0 General 0.09 0.18
13.43
8.35 21.1 Leaf and stem 0.27 0.73
Unclassified
21.2 Fruit and flowers 0.82 1.27
aESTs matching known proteins with BLASTX scores\80 have been classified into functional categories. b% of ESTs in each category for the leaf library.
gory. Increased proportions of ESTs involved in sugars and polysaccharide metabolism (01.05), vesicular traffic (08.07) in the berry and increased proportion of cytoskeleton (09.04) transcripts in the leaf reflect differences in berry and leaf physi-ology and biochemistry. Although the primary metabolism category has similar numbers overall, the berry transcripts are elevated for sugars and polysaccharides (01.05) and the leaf transcripts are elevated for the amino acid (01.01) and lipid and sterol (01.06) sub-categories. Ribosomal RNA synthesis (04.01), ribosomal proteins (05.01) and
folding and stability (06.01) sub-categories do not reflect the increased proportion of berry tran-scripts found in the rest of these categories.
4. Discussion
The BLAST analysis of 5000 ESTs from Char-donnay leaf and berry tissue reported here re-vealed matches with 2330 distinct sequences in the non-redundant protein databases. One can now assign function to nearly 2000 partial grape gene sequences. Prior to this project commencing late in 1997, less than 40 known grape gene sequences had been published; the gains in the authors’ knowledge of grape genomics from an EST based approach have been considerable, and are continu-ally increasing with accelerating numbers of se-quences of known genes becoming available from a range of species.
With a genome size of 511 Mb [20] similar to rice, the grape genome could contain 20 000 – 30 000 genes. One percent of the ESTs match to 15 distinct known Vitis proteins. At the time of analysis, there were about 110 known Vitis
proteins in the non-redundant protein database. Thus the ESTs analyzed here (matching 2330 dis-tinct sequences) may represent up to 13% Vitis
genes, suggesting the total genome is greater than 18 000 genes. By the completion of the project one may have a better understanding of the number of genes coded by the grape genome.
Categorizing the BLAST matches into the ma-jor taxonomic groups of living organisms and examining the degree of homology in each group indicated that although the majority of grape ESTs had high homology with genes from other species of higher plants, a significant proportion of grape sequences are highly conserved from prokaryotes to vertebrates. Many genes con-trolling development have been found to have homology and some functional similarity across wide evolutionary distances. The rice homologue (OSEya1) of the Drosophila eyes absent (eya) gene, for example, has recently been reported to regulate the morphogenesis of lateral organs in plants; the eyagene functions at multiple stages in the development of animal organs [21].
The degree of homology with BLAST matches, proportion of plant and non-plant matches, and levels of redundancy were similar in the leaf and berry libraries. Only 12% of the genes matched by
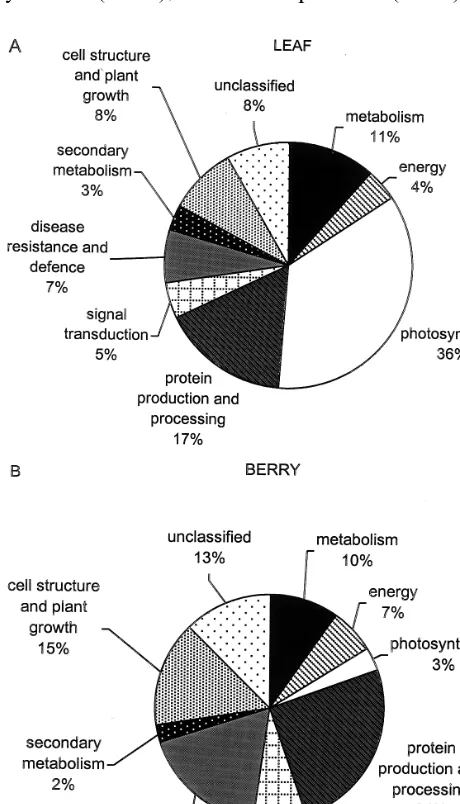
Fig. 3. Abundance of transcripts with various cellular roles in leaf (A) and berry (B). ESTs matching known proteins with BLASTX scores\80 were classified into functional categories
the ESTs were common to both libraries indicating marked differences in the genes expressed in the two tissues.
The abundance of transcripts with predicted cellular roles in leaf and berry were estimated by classifying the primary BLAST matches with ho-mology to known proteins (class A, Table 3) into functional categories. The proportion of transcripts involved in metabolism apart from photosynthesis (01, 02−02.3, and 20) was 18.6% in the leaf and 20.0% in the berry. This compares to an average of 16.4% in a range of human tissues (with most between 14 and 20%; [3] about 14% in the cambial-region and 15% in the developing xylem of poplar [16] percentage adjusted to include only class A matches). Comparison of these values from several different ‘electronic northern’ analyses indicates that levels of metabolism are similar in cells from different sources.
Thirty-six percent of the leaf transcripts were involved in photosynthesis, compared to 3% in the berry. This is a much higher proportion of tran-scripts involved with a function limited to special-ized cells, than was found when transcripts of 33 human tissues were compared [3], suggesting plant cells may involve their cellular machinery to a greater extent in specialized activities. Transcripts in the berry also reflect a high degree of specialization, with 18% of the berry transcripts in the disease/ de-fense category, compared to 7% in the leaf. The increased proportion in this category were due to higher proportions of defense-regulated, detoxifica-tion, and stress response genes. Differential screen-ing has identified cDNAs encodscreen-ing putative cell wall and stress response proteins that are expressed during berry ripening [22]. Defense proteins such as thaumatin-like, chitinases and lipid-transfer proteins have been shown to accumulate in grape berries at veraison and this is coordinated with sugar production and anti-fungal activity [23]. The berry ESTs also exhibit increased protein produc-tion and processing (mainly proteolysis), and signal transduction. These results suggest berry tissue is actively engaged in defense and maintenance of homeostasis; with heightened signal transduction activity and proteolysis, and levels of specific proteins being in a state of flux. Transcripts in-volved in general protein making machinery such as ribosomes, and those involved in splicing mRNA and protein folding and stability, were similar in both tissues.
Berry transcripts were elevated for sugar and polysaccharide metabolism, and the leaf transcripts for amino acid, lipid and sterol metabolism; result-ing in primary metabolism beresult-ing the same overall. Increased proportions of sugars and polysaccharide metabolism, gluconeogenesis, vesicular traffic and ATPase (vacuolar) transporters in the berry may reflect sugar production and transport activities in the berry. For a tissue expected to be engaged in storing sugars and modified metabolites a surpris-ingly low number of sugar transporters and sec-ondary metabolism transcripts were found in the berry. The higher proportions of cytoskeleton and chloroplast structural protein transcripts in the leaf and higher cell wall components in the berry, may be consistent with differences in cell structure, but with nearly 40% of the leaf transcripts involved in photosynthesis, a larger number of chloroplast structural gene messengers might be expected.
It has been possible to gain some new insights into the differences between leaf and berry cells from the global examination of gene expression based on the analysis of the first 5000 ESTs. The gene expression data is presently being extended by studies of berry and vine development using medium density cDNA grids. The grape project has a 16 times BAC library and is expressing novel grape genes in Arabidopsis. With up to 40 000 additional ESTs planned, these tools will be a powerful combination for advancing grape genomics.
Acknowledgements
The authors thank Dr David Oag for supplying the Chardonnay berries, Mrs Lee Cole for data entry, and the Australian Agricultural Research Institute for funding and initiating the project. The Australian Genome Research Facility (AGRF) was established through the Commonwealth-funded Major National Research Facilities Program and is supported by the University of Queensland and the Walter and Eliza Hall Institute of Medical Re-search.
References
[2] N.H. Lee, K.G. Weinstock, E.F. Kirkness, J.A. Ear-lehughes, R.A. Fauldner, S. Marmaros, A. Glodec, J.D. Gocayne, M.D. Adams, A.R. Kerlavage, et al., Compar-ative expressed sequence tag analysis of differential gene expression profiles in PC-12 cells before and after nerve growth factor treatment, Proc. Natl. Acad. Sci. USA 92 (1995) 8303 – 8307.
[3] M.D. Adams, A.R. Kerlavage, R.D. Fleischmann, R.A. Fauldner, C.J. Bult, N.H. Lee, E.F. Kirkness, K.G. Weinstock, J.D. Gocayne, O. White, et al., Initial assess-ment of human gene diversity and expression patterns based on 83 million nucleotides of cDNA sequence, Nature 377 (1995) 3 – 17.
[4] T.M. Santos, D.A. Johnston, V. Azevedo, I.L. Ridgers, M.F. Martinez, G.B. Marotta, R.L. Santos, S.F. Fon-seca, J.M. Ortega, E.M.L. Rabelo, et al., Analysis of the gene expression profile ofSchistosoma mansonicercariae using the expressed sequence tag approach, Mol. Biochem. Parisitol. 103 (1999) 79 – 97.
[5] R.M. Ewing, A.B. Kahla, O. Poirot, F. Lopez, S. Audic, J. Claverie, Large-scale statistical analysis of rice ESTs reveal correlated patterns of gene expression, Genome Res. 9 (1999) 950 – 959.
[6] M. Takenaka, E. Imai, T. Kaneko, T. Ito, T. Moriyama, A. Yamauchi, M. Hori, S. Kawamoto, K. Okubo, Isola-tion of genes identified in mouse renal proximal tubule by comparing different gene expression profiles, Kidney Int. 53 (1998) 562 – 572.
[7] K. Itoh, K. Okubo, H. Utiyama, T. Hirano, J. Yoshi, K. Matsubara, et al., Expression profile of active genes in granulocytes, Blood 92 (1998) 1432 – 1441.
[8] L. Zhang, W. Zhou, V.E. Velculescu, S.E. Kern, R.H. Hruban, S.R. Hamilton, B. Vogelstein, W.K. Kinzler, Gene expression profiles in normal and cancer cells, Science 276 (1997) 1268 – 1272.
[9] P.O. Brown, D. Botstein, Exploring the new world of the genome with DNA microarrays, Nat. Genet. 21 (1999) 33 – 37.
[10] V.E. Velculescu, L. Zhang, B. Vogelstein, W.K. Kinzler, Serial analysis of gene expression, Science 270 (1995) 484 – 487.
[11] J.A. Rafalski, M. Hanafey, G. Miao, A. Ching, J. Lee, M. Dolan, S. Tingey, New experimental and computa-tional approaches to the analysis of gene expression, Acta Biochem. Polonica 45 (1998) 929 – 934.
[12] M. Riley, Functions of gene products inE.coli, Microb. Rev. 57 (1993) 862 – 952.
[13] H.W. Mewes, K. Albermann, M. Bahr, D. Frishman, A. Gleissner, J. Hani, K. Heumann, K. Kleine, A. Maierl, S.G. Oliver, et al., Overview of the yeast genome, Nature (Suppl.) 387 (1997) 7 – 84.
[14] M. Bevan, I. Bancroft, E. Bent, K. Love, H. Goodman, C. Dean, R. Bergcamp, W. Dirkse, M. Van Staveran, W. Stiekema, et al., Analysis of 1.9Mb of contiguous se-quence from chromosome 4 of Arabidopsis thaliana, Nature 391 (1998) 485 – 488.
[15] C.O. Lim, H.Y. Kim, M.G. Kim, S.I. Lee, W.S. Chung, S.H. Park, I.H. Hwang, M.J. Cho, Expressed sequence tags of Chinese cabbage flower bud cDNA, Plant Phys-iol. 111 (1996) 577 – 588.
[16] F. Sterky, S. Regan, J. Karlosson, M. Hertzberg, A. Rhonde, A. Holmberg, B. Amini, R. Bhalerao, M. Larsson, R. Villarroel, et al., Gene discovery in the wood-forming tissues of poplar: analysis of 5,692 ex-pressed sequence tags, Proc. Natl. Acad. Sci. USA 95 (1998) 13330 – 13335.
[17] M. Bahloul, G. Burkard, An improved method for the isolation of total RNA from spruce trees, Plant Mol. Biol. Reporter 11 (1993) 212 – 215.
[18] S. Chang, J. Puryear, J. Cairney, A simple and efficient method for isolating RNA from pine trees, Plant Mol. Biol. Reporter 11 (1993) 117 – 121.
[19] S.F. Altschul, T.L. Madden, A.A. Schaffer, J. Zhang, Z. Zhang, W. Miller, D.J. Lipman, Gapped BLAST and PSI-BLAST: a new generation of protein database search programs, Nucleic Acids Res. 25 (1990) 3389 – 3402.
[20] M.R. Thomas, S. Matsumoto, P. Cain, N.S. Scott, Repetitive DNA of Grapevine: classes present and suit-able for cultivar identification, Theor. Appl. Genet. 86 (1993) 173 – 180.
[21] Y. Takeda, S. Hatano, N. Sentoku, M. Matsuoka, Ho-mologues of animal eyes absent (eya) genes are found in higher plants, Mol. Gen. Genet. 262 (1999) 131 – 138. [22] C. Davies, S.P. Robinson, Differential screening
indi-cates a dramatic change in mRNA profiles during grape berry ripening. Cloning and characterization of cDNAs encoding putative cell wall and stress response proteins, Plant Physiol. 122 (2000) 803 – 812.
[23] R.A. Salzman, I. Tikhonova, B.P. Bordelon, P.M. Hasegawa, R.A. Bressan, Coordinate accumulation of antifungal proteins and hexoses constitutes a develop-mentally controlled defence response during fruit ripen-ing in grape, Plant Physiol. 117 (1998) 465 – 472.