1
R&D INTENSITY AND IPO UNDERPRICING: CASE STUDY
ON PHARMACEUTICAL AND BIOTECH
INDUSTRIES IN THE US
Tommy C. Efrata
E-mail : [email protected]Universitas Ciputra
ABSTRACT
Asymmetric information between the issuer to potential investors believed by some academics in finance as one of the main causes of the phenomenon of underpricing at the time of the initial public offering (IPO). On science and technology-based company main problem lies in how to conduct assessments on the future value of a product that is still in the development stage. The issue became more prominent on pharmaceutical companies and biotechnology, due to the characteristics of this industry is the high expense, complex process, and the lengthy process of research and development (R & D) of a product. This study describes the characteristics above is associated with the phenomenon of underpricing when companies conduct IPO. The samples are 82 pharmaceutical companies and biotechnology conduct IPO in the United States stock market in 1998-2005. The results of this study revealed a negative correlation between the intensity of R & D and IPO underpricing phenomenon in this industry. These studies have identified R & D as the main source of information asymmetry that led to the phenomenon of underpricing for pharmaceutical companies and biotechnology.
Keywords: underpricing, asymmetric information, R & D intensity, pharmaceutical and biotechnology, IPO.
INTRODUCTION
For the science and technology based firm especially in the pharmaceutical and biotech industries, the potential source of asymmetric
information between the firm’s insiders (firm’s managers and underwriters) and
investors, is on how to value the future outcomes of research and development (R&D) activities. Firms within the industries are characterized by relatively high investments in R&D and have very few tangible assets. The value of the firm
therefore, depends on the success of R&D, which is related to new and untested technologies or products, while the future outcomes of the efforts are
uncertain. In this regard, the firm’s
2 Fortunately, it is common for the firms
within pharmaceutical and biotech industries, to supplement their prospec-tuses with vast disclosure of the R&D activities. Therefore, investors in the industries are relatively better informed concerning the prospect of the firms in the future. In this particular way, there are possibilities that some optimistic investors may overestimate the benefit of R&D efforts of the firm. As a result, potential investors may take optimistic predictions about the future cash flows generated by technological breakthroughs or brand new products from the R&D efforts. Accordingly, the conjecture in this paper is that underpricing phenomenon still exists in the pharmaceutical and biotech firms during IPO.
The empirical literature related to this study documents that R&D intensity is associated with return volatility after controlling for some variables such as firm size, age, and industry effects (Chan et.al.:2001). Chan et. al. argue that the insufficient accounting disclosure regarding R&D activities may have a IPO anomalies by R&D finds that for the overall industries, the extent of IPO first-day underpricing and long term performance is positively related to the R&D intensity of the issuers (Guo et. al.: 2006). Guo et. al suggest that R&D is the main contributor for asymmetric information surrounding the IPO which
in turn, has an impact on the IPO underpricing. Both studies have shown the relationship between the problem of asymmetric information on R&D activities and mispricing of the stocks, which is important for the arguments in this paper.
Relative to the overall industries, the problem of asymmetric information is magnified on pharmaceutical and biotech firms in which their efforts are mainly based on the R&D activities. For investors, asymmetric information regarding R&D activities can heavily
affect the process of firm’s evaluation
during IPO. Therefore, adequate disclosure of R&D activities for the IPO firms within the industries is crucial in order to prevent misvaluation.
3 (standard deviation), the time, and the
costs needed for each stage which are very unique for each firm (even specific for each product), may differ from those
applied by the firm’s insiders.
Secondly, despite extensive disclosures in the prospectus regarding R&D activities, the asymmetric information problem may still persist due to the corporate strategy. Sensitive information is believed to be retained within the insiders and it can not be revealed in the prospectus as it may benefit competitors. Pharmaceutical and biotech firms are basically in a strict competition to discover new products or drugs and secure their patent protections. Therefore, proprietary information concerning the research and development of the product should be treated carefully before releasing it to public.
The theories and previous studies linked the contribution of R&D to asymmetric information, and then have a consequence on the valuation of the firms, are important to develop the hypothesis in this paper. In pharmaceutical and biotech industries, the firms are characterized by high level of R&D intensity which is defined as how much resources of the firm are dedicated to the R&D activities. Despite vast information regarding R&D has been disclosed in the prospectuses, R&D still presumes as the main contributor for uncertainty for investors. Furthermore, earlier studies also indicate the relationship between asymmetric information and IPO underpricing. Accordingly, the hypothesis for this paper is that,
“Hypothesis: For the firms within pharmaceutical and biotech industries, the R&D intensity as a proxy for asymmetric information is associated with the initial IPO underpricing.”
Therefore, the purpose of this research paper is to examine whether R&D intensity is the main source of asymmetric information between the potential investor and the insider for pharmaceutical and biotech firms. As consequence, it will lead to cause underpricing for the firms during IPO.
Compare to other papers which are trying to explain IPO underpricing phenomenon within the firms with relatively high R&D intensity, this paper is focus to the pharmaceutical and biotech industries. Given the complexity of the product development process, obviously this characteristic makes the study of examining these industries even more specific to address the problem. Furthermore, this study pays more attention on finding the source of asymmetric information which is in other study is still unclear, hence use other variables as proxies.
THE ORETICAL BACKGROUND
Research and Development Process for Pharmaceutical and Biotech Firms
4 biological compounds), the risks of
failure during the development and the novelty of the products. Some of new products are created based on the existing products (incremental modifications) and some of those are developed from the scratch. The former product development substantially requires fewer R&D investments relative to those does in the latter. A recent empirical study indicates that the average costs of developing a brand new innovative drug can reach 802 millions dollars (measured in year 2000 US dollars) including the costs spent on the failed drugs and the costs of capital (DiMasi et. al.:2003).
Not only the product development in the industries requires large investments in R&D, but also the process of development itself is very time consuming. It can take about 10 until 15 years to develop a new drug from the discovery stage until receiving the marketing approval from the FDA. To create a new drug, the process of product development has to follow sequences (possibly overlapping sequences) of steps which is called a development paradigm.
In the US, the drug’s development
paradigm is relatively unique and can be modeled as presented in Table I. The development begins with the discoveries of biological or synthetic compounds which are then tested on animals during a pre-clinical step. Only approximately 250 compounds out of 5.000-10.000 compounds created during the discovery stage can actually go into the pre-clinical testing. The process is continued to Phase I to perform the clinical tests on healthy humans. In this clinical phase, about 20-100 healthy human volunteers are needed to collect the data concerning the safe dozes, metabolic effects, and toxicity of the compounds. Out of 250 compounds during the pre-clinical stage, only about five most promising compounds can enter the clinical phases. Phase II clinical tests is conducted to the patients who suffer targeted diseases, to gather the data concerning the safety of the compounds, the validity of the data collected in the previous phase, and the preliminary data on efficacy. The scale of observations in this stage is substantially larger than those in the Phase I by involving about 100-500 patients.
Table I: The R&D Process, Average Time and Compounds Success Rate by Stage
Stage Description Average
Time
Compound Success Rate Discovery Find a candidate drug.
Conduct initial tests on every promising compound.
Optimize remaining leads for safety and effectiveness.
6 years 5000-10.000 compounds
Preclinical Testing
Test candidate drugs in the laboratory and in animals.
Develop and test process to make
5 drugs for clinical trials.
Clinical Phase I
Conduct Phase I trials (20–100 healthy volunteers).
To establish safe dosages and to gather information on the absorption, distribution and metabolic effects, excretion and toxicity of the compound.
1.8 years 5 compounds
Clinical Phase II
Conduct Phase II trials (100–500 volunteers with the target condition). To obtain evidence on safety and
preliminary data on efficacy.
2.1 years
Clinical Phase III
Conduct Phase III trials (1,000– 5,000 volunteers with the target condition).
Design to firmly establish efficacy and to uncover side-effect that occur infrequently.
2.5 years
FDA Approval Submit New Drug Application (NDA), which includes up to 100,000 pages of information on research findings, analysis of clinical trial results, and proposed labeling and manufacturing plan.
1.5 year 1 compound
Sources: PhARMA (2007), DiMasi (2003) In Phase III, the scale of the tests even larger than those in Phase II, by testing about 1.000-5.000 patients to establish the efficacy of the compounds in curing the diseases, and to uncover irregular side effects of the compounds. The final step is to submit a new drug application, which includes information on research findings, analyses of clinical tests results, and proposed labeling and manufacturing plan, to the FDA for marketing approval. Only one out of five new drug candidates that enter the clinical phases is actually received the marketing approval from the FDA. An investigation on the marketing
performance of the drugs approved by the FDA reveals that only 30 percent of marketable drugs generate enough income to cover the R&D expenses, spent during the development (PhARMA: 2007).
6 months (DiMasi et. al. 2003). As this
estimation is based on the newly innovative drug samples, the length of the development process can be relatively shorter for the incremental modification drugs.
As described above, for each stage during product development, firms hold the risks of failure. If during the process, the tested compounds fail to meet the designated requirements and hence the likelihood to be granted a marketing approval by the FDA is small, the firms must withdraw the compounds from the development. DiMasi et. al. document that the probability of investigational compounds to enter the next step during the development is narrower for the latter stage. Focusing on the clinical phases during the process of drug development, the paper documents that the probability of entering the successive phase decrease by clinical stage. Measuring from Phase I (100 percent), the probability of investigational compounds to enter Phase II is 71 percent and the probability decreases at 31.4 percent on Phase III.
The paper from the same authors also finds that the average of the clinical stages costs per investigational compound increases considerably by clinical phase. This is particularly true for Phase III which requires large scale of observations, involving many human volunteers to gather the data. The paper increases substantially by more than three
folds compare to the average costs of the previous phase.
Given the importance and complexity of R&D activities in the pharmaceutical and biotechnology industries above, there is no wonder that these backbone activities become a subject of much attention for firms’ insiders and investors during valuation of the firms. In the sectors, the large amount of expenditures in R&D activities is regarded as intangible assets for the firms. Some of the firms even have very few tangible assets so that the R&D expenses actually exceed the total assets of the firms. Hence it is crucial to understand the nature of these particular assets in order to better evaluate the firms. Under current US accounting principals (GAAP), the firms do not oblige to report intangible assets in the financial statements. Hence, when the firms have a considerable amount of intangible assets, the lack of detail in financial reporting of these assets complicate the valuation of the firms for the investors.
Asymmetric Information and Underpricing
When a firm decides to trade their shares publicly, the most important issue yet has to be determined is to value the company. Based on the valuations, the
firm’s insider then set the new issuance’s
7 novelty of the products and untested
technologies. During the valuation, the firm usually hires investment bankers or
underwriters to assist the firm’s managers
on the pricing and marketing of new
stocks. Underwriters also help the firm’s
manager to conduct due diligence investigations, write the prospectuses, and file the necessary documents to the Securities Exchange Commission (SEC). In order to value the firms, the underwriters usually perform several approaches simultaneously such as discounted cash flows analyses, comparable firm analyses, a compound real option model, etc. In this regard,
along with the firm’s managers,
underwriters are believed to have better knowledge and information which are necessary for determining the offering price of the new issuance. On the preparation of IPO, SEC will ask the firm to disclose information to the public in the prospectus including the R&D budget prior to IPO. In the US, the regulations also require the firm to file the documents
covering the descriptions of the firm’s
business and financial statements in accordance GAAP.
Unfortunately, most of the firms only report barely the aggregate amount of R&D expenditures in the prospectuses without further explanations. Hence the accounting information of R&D only provides limited usefulness for investors. Exception on this condition includes pharmaceutical and biotechnology firms. The firms in the industries reveal extensive information about their R&D activities in their prospectuses (Guo et. al.: 2006). In addition, they also consistently disclose the information
regarding the R&D activities in the annual financial statements. The firms often explain broadly about their R&D activities and the prospect of the products under development. Even so, the detail of the sensitive information is believed still to be retained by the firm’s insiders due to competitive consideration as it may benefit the competitors. The information regarding the failures of some compounds to enter Phase II or Phase III during the clinical tests will not be passed to the hand of competitors (Aboody and Lev: 2000). On the other hand, as described above, the detail information about the progress including the probability to successfully receive the marketing approval from the FDA, during product development is essential for the valuation of the firms. In this regard, despite the extensive disclosure about the R&D activities in the sectors, information asymmetry still persists
because the firms’ insiders have better
information about R&D activities. The insiders can continually monitor the progress of the product development as well as the probability of success while the investors obtain only aggregate information provided by the firms in the prospectuses.
Further, the asymmetric informa-tion can also come from the limitainforma-tion of the potential investors to comprehend the valuation of the company, given the information they have. Because of the relative complicated process of R&D activities and product development, it is difficult for investors to understand about the productivity and the value of the
firm’s R&D (Aboody and Lev: 2000).
8 information is also costly for investors,
requiring them to have sufficient scientific knowledge and considerable time. In addition, public may also overwhelm with too many R&D information pouring to them so that selecting relevant information is an exhausting process. As a result, some investors may overestimate the long term benefit of the R&D outcomes, due to the wide coverage of the possible success of certain medicines by the media, and systematic marketing effort by the investment industry.
Regardless relatively extensive information about the progress of product development has been explained in the prospectuses, asymmetric information
between firm’s insiders and potential investors still persists during IPO for the firms within pharmaceutical and biotech industries. As a consequence, the value of the company perceived by the investors will most probably differ than the value measured by the corporate insiders or underwriters. The valuation of the firms by the issuers is reflected on the offering prices at the time of IPO. On the other days of trading is higher than the offering price set by the firm. In general, the new issued underpricing exists in stock markets of every country even though the extent of underpricing varies one to each other (Ritter: 1998).
The asymmetric information may create the sense of uncertainty for the
potential investors concerning the true value of the firms. The existence of information asymmetry is also believed by many scholars as the explanation for IPO underpricing phenomenon (Ritter (2004), Carter et. al. (1998)). However, they rarely identify the source of asymmetric information, instead they vaguely use less clear-cut variables such as firm age, retained ownership, underwriter reputation etc. as proxies of asymmetric information (Guo et. al.: 2006). In the pharmaceutical and biotechnology industries, R&D has a function to support the continuity of the firms. For the firms within the industries, investments in R&D is regarded as intangible assets which like any other intangible assets such as branding and staff training physically is very difficult to value. To value the company by comparing it with the similar or matching firms may not yield an intended result since as describe above the R&D activities in very unique and specific to the each firm. The IPO firms are generally dominated by new and young establishments so that the valuation of the firm in connection with the tangible asset is very tricky to measure.
9 insufficient disclosure of R&D activities;
and the possibility for the firm’s insiders to benefit from it. The study provides the
evidence that insiders’ gains on the firms
which are actively engaged in the R&D activities are significantly larger than the firm without R&D activities (Aboody and Lev: 2000).
RESEARCH METHODOLOGY
Sources of the Data
The initial sample consists of 115 initial public offering (IPO) firms in the
US stock exchange markets (NASDAQ, American Exchange and NYSE) during 1998-2005 for the biotechnology and pharmaceutical industries. The IPO firms for the sample therefore must be within the first three digits 283 on the industrial classification code (SIC) including 2833 for medicinal chemicals and botanical products, 2834 for pharmaceutical preparations, 2835 for in vitro and in vivo diagnostic substances and 2836 for biological products, except diagnostic substances.
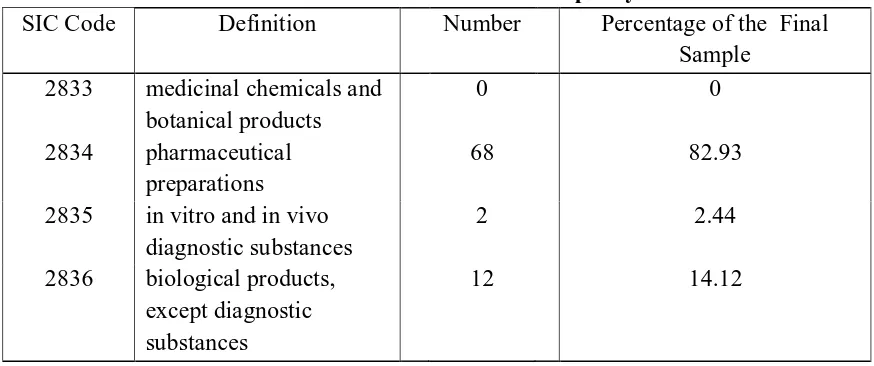
Table II: Distribution of IPO Firms in the Final Sample by SIC Code
SIC Code Definition Number Percentage of the Final Sample
2833 medicinal chemicals and botanical products
0 0
2834 pharmaceutical preparations
68 82.93
2835 in vitro and in vivo diagnostic substances
2 2.44
2836 biological products, except diagnostic substances
12 14.12
The primary data for IPO firms and the offering prices are derived from
SEC’s Electronic Data Gathering and
Retrieval (EDGAROnline) which is available at http://ipoportal.edgar-online.com. The other data such as total assets, long term liabilities, research and development expenditures, number of outstanding shares prior to IPO including number of new issued shares, managing underwriters and presence of venture capitalists are taken from SEC’ filings
10 index and S&P 500 PHARM for
pharmaceutical industry) are retrieved from the Thomson Financial Datastream (TFD).
Sampling Method
The initial sample is then filtered due to unavailability or inconsistency of the data. Most notably, some the firms within the initial sample are not included because the daily market closing prices
are not provided by the TFD because of
the trading suspensions or the firms’
stocks are no longer actively traded in the markets when the data of this research was collected. Some initial samples also exhibit inconsistency in the values among the data sources (SEC-Edgar, Edgar Online and TFD) and for those which can not be verified are excluded from the observation. In total, 21 IPO firms within the initial sample fall into this category.
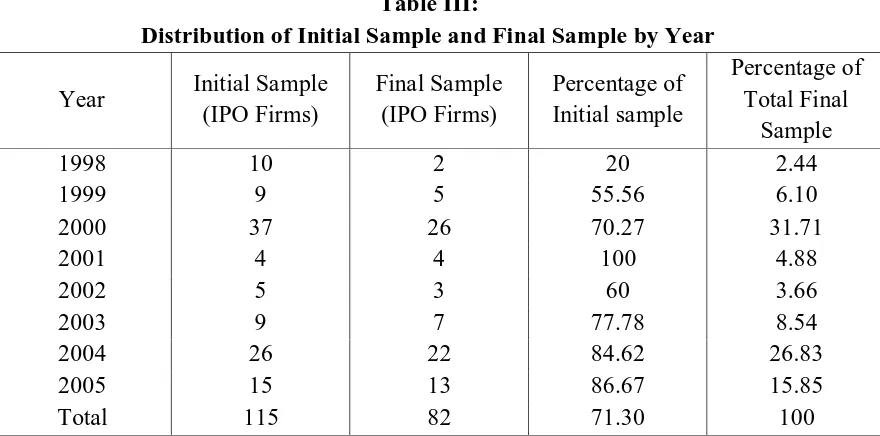
Table III: Distribution of Initial Sample and Final Sample by Year
Year Initial Sample (IPO Firms)
Final Sample (IPO Firms)
Percentage of Initial sample
Percentage of Total Final
Sample
1998 10 2 20 2.44
1999 9 5 55.56 6.10
2000 37 26 70.27 31.71
2001 4 4 100 4.88
2002 5 3 60 3.66
2003 9 7 77.78 8.54
2004 26 22 84.62 26.83
2005 15 13 86.67 15.85
Total 115 82 71.30 100
Further, some of firms’ financial
statements reported zero R&D expenditures prior to IPO (7 IPO firms) and those firms also are excluded from the final sample. At the end, I also observed some irregularities on the ratios of R&D expenditures to the book value for some IPO firms (5 IPO firms), in which I consider these firms as the outliers therefore I also leave out these firms and do not include them for the observation. Therefore, the final sample of this research includes 82 IPO firms or about 71.30 percent of 115 IPO firms in the initial sample.
11 high stock market returns and the volume
of IPO activities (Ritter: 1998). On the contrary, the low number of IPO firms between those two years is presumably caused by bearish markets during the post internet bubble as well as nine-eleven tragedy.
Main Variables
The dependent variable in the regression models is the first-day IPO underpricing which is described as the difference between the offering price set by the firm and the first-day closing price. For the explanatory variable, the R&D intensity is measured as a ratio between the annual R&D expenditures and the net assets of the firm. Alternatively, the R&D intensity is calculated as the ratio of R&D expenses to the expected market value of the firm. Thus in this case one can safely say that both indicators for the R&D intensity are observable to public at the time of IPO.
MODELS AND ANALYSIS
Models
To examine the association between the extent of IPO underpricing and information asymmetry as proxied by the level of R&D intensity of the firms, I developed the ordinary least square (OLS) models. The main reason for using natural logarithm on both R&D intensity variables in the models is to impose a non linear relationship between the extent of underpricing and the level R&D intensity. The non linear regression models are actually better suited to mimic the association between underpricing and
the level of R&D intensity. This is important because the effect of information asymmetry on the extent of underpricing is unlikely to be uniform across different level of R&D intensity of the firm, given the nature of R&D activities in the industries. Having a non linear relationship in the models implies that the every percentage increase on the level of R&D intensity will give a constant level increase or decrease on the extent of underpricing, which depend on the sign of estimated coefficient of the R&D intensity. Stated differently, the change on the extent of underpricing decreases, as the level of R&D intensity increases.
adj_ret_1d = α + β
logR&D/net_assets + ε ....(1) adj_ret_1d = α + β
logR&D/exp_mv + ε ...(2)
12 and (2) respectively. The outcomes
confirm the hypothesis that the extent of IPO underpricing is related to the R&D
intensity of the firms within the pharmaceutical and biotechnology industries.
Table IV: Simple Regression Models of the First-Day IPO Adjusted Returns on the R&D
Intensity
Model (1) Model (2)
adj_ret_1d adj_ret_1d
logR&D/net_assets -0.072 ** (-2.93)
logR&D/exp_mv -0.077**
(-2.95)
Constant 0.005
(0.21)
-0.171 (-2.26)
Observations 82 82
F-test 8.61** 13.02**
R-squared 0.11 0.14
Note:
Absolute value of t-statistics in parentheses (with robust s.e.) * significant at 5%; ** significant at 1%
Some early empirical studies proved that some factors also have contributions to influence the extent of IPO underpricing. Therefore, on the subsequent models, I introduced these factors as the controlling variables. The first explanatory variable is the
age of the firm at the time of issuance (age). The rationale for the variable age is that older firms have a lower information asymmetry than do younger firms. The earlier literatures on this issue also suggest that there is a negative relation between IPO first day initial returns and the age of the firm (i.e. Loughran and Ritter: 2004; Megginson and Weiss: 1991; and Carter and Manaster:1990). Accor-dingly, the hypothesis for this
variable is that the age of the firm will have a negative association with the extent of underpricing.
I also include the underwriter reputation (uwriter_rep) in the models. A previous empirical research finds that IPOs endorsed by well known underwriters will have less underpricing compare to the ones which are supported by less reputable underwriters (Carter and Manaster: 1990). Therefore the hypothesis of this independent variable is that underwriter reputation will have a negative relation with the level of underpricing.
13 study on this issue documents that the
presence of venture capitalists will lower the costs of due diligence for the potential investors (Megginson and Weiss: 1991). Stated differently, the existence of venture capitalists
prior to the IPO within the firm’s
ownership is expected to reduce the uncertainty for the investors about the value of the firms. Accordingly the hypothesis for this variable is that the presence of the venture capitalists is expected to have a negative association with the degree of underpricing during IPO.
The last controlling variable for the models is the fraction of ownership retained by the insiders after IPO (ret_ownership). The high percentage of ownership retained by the incumbents after IPO indicates that the firm is still highly valuable hence the degree of underpricing is positively associated with
incumbents’ fractional holding
(Grinblatt and Hwang: 1989). Accordingly, the hypothesis for this controlling variable is a positive relation between the retained ownership and the degree of underpricing.
Considering all of the controlling variables above and including them in the models, the comprehensive regression model is as the following
adj_ret_1d = α + β1
logR&D/net_assets + β2age +
β3uwriter_rep + β4venture_cap +
β5ret_ownership + ε. ...(3)
Alternatively, R&D intensity is measured by the ratio of R&D expenditures and expected market value, therefore the model is as shown below
adj_ret_1d = α + β1
logR&D/exp_mv + β2age +
β3uwriter_rep + β4venture_cap +
β5ret_ownership + ε. ...(4)
14
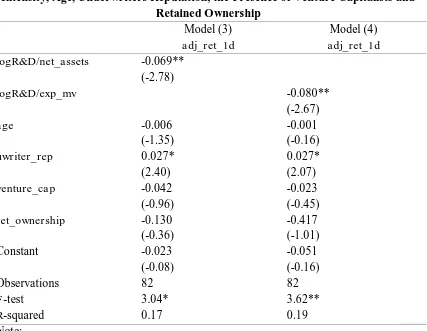
Table V: Multiple Regression Models of the First-Day IPO Adjusted Returns on the R&D
Intensity, Age, Underwriters Reputation, the Presence of Venture Capitalists and Retained Ownership
Model (3) Model (4)
adj_ret_1d adj_ret_1d
logR&D/net_assets -0.069** (-2.78)
logR&D/exp_mv -0.080**
(-2.67)
age -0.006 -0.001
(-1.35) (-0.16)
uwriter_rep 0.027* 0.027*
(2.40) (2.07)
venture_cap -0.042 -0.023
(-0.96) (-0.45)
ret_ownership -0.130 -0.417
(-0.36) (-1.01)
Constant -0.023 -0.051
(-0.08) (-0.16)
Observations 82 82
F-test 3.04* 3.62**
R-squared 0.17 0.19
Note:
Absolute value of t-statistics in parentheses (with robust s.e.) * significant at 5%; ** significant at 1%
Likewise the estimated coefficient of underwriter reputation is also negatively significant at five percent level of confidence. The sign of the coefficient of underwriter reputation for both models are counterintuitive with the hypothesis that the underwriter reputation is negatively associated with the extent of underpricing. Interpreting the estimated coefficient from the models, one can say that ceteris paribus, one point increase of the underwriter reputation rank will raise the extent of underpricing as much as 0.027 point. Nevertheless, this result is
15
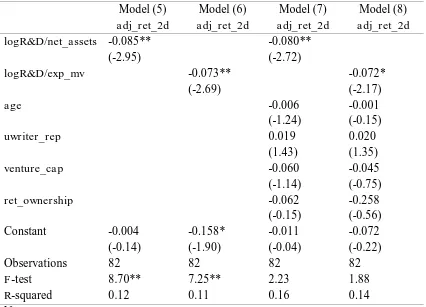
Table VI: Simple and Multiple Regression Models of the Second-Day IPO Adjusted Returns
on the R&D Intensity, Age, Underwriter Reputation, the Presence of Venture Capitalists and Retained Ownership
Model (5) Model (6) Model (7) Model (8) adj_ret_2d adj_ret_2d adj_ret_2d adj_ret_2d
logR&D/net_assets -0.085** -0.080**
(-2.95) (-2.72)
logR&D/exp_mv -0.073** -0.072*
(-2.69) (-2.17)
age -0.006 -0.001
(-1.24) (-0.15)
uwriter_rep 0.019 0.020
(1.43) (1.35)
venture_cap -0.060 -0.045
(-1.14) (-0.75)
ret_ownership -0.062 -0.258
(-0.15) (-0.56)
Constant -0.004 -0.158* -0.011 -0.072
(-0.14) (-1.90) (-0.04) (-0.22)
Observations 82 82 82 82
F-test 8.70** 7.25** 2.23 1.88
R-squared 0.12 0.11 0.16 0.14
Note:
Absolute value of t-statistics in parentheses (with robust s.e.) * significant at 5%; ** significant at 1%
To examine the robustness of the outcomes, I also developed the alternative models by substituting the dependent variable in the previous models with the extent of underpricing described as the difference between the offering price set by the firm and second-day market closing price. Inspection of Table VI for Model (5) and (6) indicates that compare to Table IV for Model (1) and (2) which employ the first-day initial returns as dependent variable, the estimated coefficients of R&D intensity do not differ significantly at the same level of confidence. The underpricing consistently
has a strong and negative association with R&D intensity on both models. The relatively similar outcomes also applies for the Model (7) and (8) of the same table which are comparable to the Model (3) and (4) respectively of Table V, even though for the Model (8) the level of confidence shifts to 5 percent.
16 asymmetric information and uncertainty
between the issuers and outsiders during IPO. The outcome of this study is consistent with the finding of previous literature. Guo et. al. documents that the influence of R&D intensity on the level of IPO underpricing in pharmaceutical and biotech industries is significantly lower than those of overall industries in the US (Guo et. al.:2006). Hence, the finding of this research paper here magnifies the distinct characteristic of the IPO underpricing phenomenon in the pharmaceutical and biotechnology sectors compare to the overall industries.
Analysis
For the industries, the product development is characterized by long term process through the completion of the serial laboratory tests, human trials and regulatory review process. In the US, the development process has to undergo more exhaustive process and has to follow a pre-clinic and several clinical trials phases before receiving the approval from the FDA. On this long term process, the firms have to allocate a large amount of R&D budget which is distributed into each stage of development. A previous study on the US pharmaceutical industry documents that R&D costs per drug in the latter stage of product development are higher than those in the earlier stages of product development. (DiMasi et. al.:2003). Moreover, the nature of R&D of the
industries also relates the latter stage of development with more risks than those does on the earlier stages during the product development. At the advanced stages of product development, the firms have already dedicated the considerable amount of resources for R&D activities. In this case, if the product candidates failed to meet a certain intended target so that the likelihood of getting an approval from the FDA is small, then the firms must discontinue the product development.
17
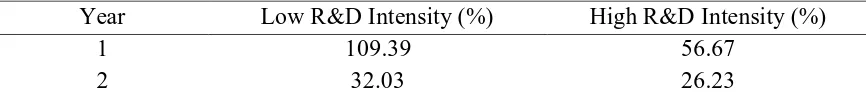
Table VII: The Average Increase of R&D Expenditures between Low and High R&D
Intensity
Year Low R&D Intensity (%) High R&D Intensity (%)
1 109.39 56.67
2 32.03 26.23
Using the same sample of 82 IPO firms as in the previous section, the firms are grouped based on whether they are above or below the median of R&D intensity measured by the ratio of R&D expenditures to the book value. Further, the increase of nominal R&D expendi-tures within two years following IPO is calculated after adjusting it with the CPI index for the US and using year-2005 as a based year for each firm. By taking the average of the increase of R&D expenditures for both categories, we can then see the difference between these two groups.
Inspection of Table VII shows that for the low R&D intensity firms, the average increase of R&D expenditures relative to the R&D expenditures prior to IPO is 109 percent. It implies that their budgets for product development raise more than two folds at the year of IPO and it is followed by 32 percent increase on the subsequent year. In contrast, for the firms with high R&D intensity, the R&D budgets only increase 57 and 26 percent during the year of IPO and a year afterward respectively. The difference on the average increase of R&D expendi-tures between low and high R&D intensity firms confirms the expectation, that the firms with low R&D intensity are most likely still in the earlier stages of product development while the high R&D intensity firms have been in the
advanced stage of product development. For the low R&D intensity firms, the substantial increase in R&D expenditures is expected as the firms move to the latter phase of product development which requires a considerable amount of resources.
18 risks of failures of the development. As a
result, the investors will perceive the value of the firm modestly, close to the offering price set by the issuers. Hence, the firms with high R&D intensity tend to be less underpriced relative to those with low R&D intensity during IPO.
On the other hand, for the firm with low R&D intensity, the product development is presumably still in the earlier stages of development. In these stages, the information regarding the progress of development is actually very limited. Hence, less specific information regarding R&D activities is actually ready to be revealed to the public. Given the level of asymmetric information here, investors or financial analysts may give excessive value on the future of the firm, because of the over optimism about the prospect of product development. On the
contrary, the firm’s managers or
underwriters indeed will act more carefully in valuing the firm on these stages, since there are many uncertainties regarding the prospect of product development. They also have to take into account the possibility to face future lawsuit from the investors if their valuation proven to be inaccurate. Therefore, considering the risks factors above, the issuer may set the offering price of the new issuance modestly. Given the high degree of asymmetric information, the firms with low R&D intensity will have higher underpricing compare to the firms with high R&D intensity during IPO.
Given the argument above, accordingly, the extent underpricing will have a non linear relationship with the level of R&D intensity. The level of
R&D intensity indicates the extent of asymmetric information between the issuers and investors. Information regarding the progress of product development becomes more available and accessible to public when the firms are on the advanced stage of the development than those does in the earlier stages of development. In other words, the information regarding R&D activities is becoming less asymmetric between issuers and investors as the progress of development move to the more mature stages. In this sense, any relevant information revealed to the public during earlier stages will be worth more to the investors relative those revealed on the latter stage of development. For example, investors will react stronger to the information regarding the success of the firms in registering the patent during the earlier stages than does in the latter stage, assuming that several patents may have been generated in the latter stage of development. As a result, the effort to reduce the problem of asymmetric information (by revealing more relevant information) will have a higher impact to the extent of underpricing when the firms are on the earlier stages of development and conversely it has a lower impact when the firms are on the advanced stages of development.
Summarizing, this study argues that the information asymmetry between the
19 information. Assuming that the offering
price set by the insiders has reflected the underlying value of the firm, a negative association between underpricing and the level of R&D intensity implies that investors, who manage their portfolio on the lower R&D intensity firms, perceive more optimistic regarding the prospect of the firm in the future. In contrast, given more information they have, the higher R&D intensity investors will actually behave more carefully resulting on less initial underpricing. By identifying R&D activities as the main source of asymmetric information which in turn, has an impact on the initial underpricing during IPO, this study offers a contribution to solve the underpricing puzzle especially for the firms in the pharmaceutical and biotechnology industries.
Considering that underpricing is actually costly for firms during IPO, the issuers can actually reduce the problem of asymmetric information by acting more progressively to reveal more relevant information regarding their R&D activities to the public. In this regard, the IPO firms may reduce the “money left on
the table” problem by letting the market
to judge the fair price of the new stocks during the book building and then consider this market truthful revelation of the stock price before finalizing the offering price on the IPO date. With this effort, the firms can be prevented from the excessive underpricing during IPO so that they can optimize the raise of capital from going public. On the other hand, given the importance of R&D activities for the current and future productivity and growth of the firms, it is rational to
expect the investors and financial analyst to acquire the information more aggressively. Given the complexity of the R&D for the firms within this sectors, they may educate them self through the various ways in order to better evaluate the firms.
CONCLUSION
20 REFERENCES
Aboody, D. and B. Lev (2000),
“Information Asymetry, R&D, and Insider Gain”, The Journal of Finance, Vol. LV No. 6 (Dec. 2000), pp 2747-2766.
Carter, R. and S. Manaster (1990),
“Initial Public Offering and Underwriter Reputation”, Journal of Finance, Vol. 45 No. 4 (Sept. 1990), pp. 1045-1067.
Cassimon, D., Engelen, P.J., Thomassen
L. and van Wouwe M. (2004), “The
Valuation of NDA Using a 6-fold
Compound Option”, Research Policy, No. 33 (2004), pp.41-51. Chan, K., J. Lakoniskok and T Sougianis
(2001), “The Stock Market
Valuation of Research and
Development Expenditure”,
Journal of Finance, Vol. 56 pp 2431-2456.
Cumming, D.J. and J.G. Macintosh
(2000), “The Determinants of R&D Expenditures: A Study of the
Canadian Biotech Industry”,
Review of Industrial Organization, No. 17/2000 pp. 357-370.
De Maeseneire, W., S. Manigart (2002),
“Initial Returns: Underpricing or
Overvaluation? Evidence from
Easdaq and EuroNM”, Working
Paper (University of Gent).
DiMasi, J.A., R.W. Hansen and H.G.
Grabowski (2003), “The Price of
Innovation: New Estimate of Drug
Development Cost”, Journal of Health Economics, Vol. 22/2003, pp 151-185.
Garnier, J.P. (2008), “Rebuilding the
R&D Engine in Big Pharma”, Havard Business Review, May 2008, pp. 69-76.
Grinblatt, M. and C. Hwang (1989),
“Signaling and the Pricing of New Issues”, Journal of Finance, Vol. 44 No. 2 (June 1989), pp. 392-420. Grabowski, H. and J. Vernon (2000),
“The Determinants of
Pharmaceutical Research and Development Expenditures, Journal of Evolutionary Economics, Vol. 10/2000, pp 201-215.
Guo, R., B. Lev and C. Shi (2006),
“Explaining the Short and Long
Term IPO Anomalies in the US by
R&D”, Journal of Business Finance & Accounting, Vol. April/May 2006, pp. 550-579. Loughran, T. and J.R. Ritter (2004),
“Why Has IPO Underpricing Changed Over Time?”, Financial Management, Autumn 2004, pp. 5-37.
Megginson, W.L. and K.A. Weiss (1991),
“Venture Capitalist Certification in
21 PhARMA, (2007), Pharmaceutical
Industry Profile 2007.
Pukthuanthong, K. (2005), “Biotech IPO
Valuation: R&D, Human Capital
Quality, Underwriter Education”,
Working Paper, San Diego State University.
Ross, S.A., R.W. Westerfield and J. Jaffe (2003), Corporate Finance, 7th edition, McGraw-Hill.
Ritter, J.R. (2003), “Difference between
European and American IPO
Market”, European Financial Management, Vol. 9, No. 4 pp 421-434.
Ritter, J.R. (2002), “Investment Banking and Security Issuance”, Handbook of Economic of Finance, North Holland.
Ritter, J.R. (1998), “Initial Public Offering”, Contemporary Finance Digest, Vol. 2 No. 1 (Spring 1998), pp 5-30.