Spreads Out
in the Sky
Gathers the Wind
Grandiose and brave challenge the sky. Gathering the power from the universe to across the ocean. It seems no fear to be blown by the wind.
Synergized in moion and ime to lead the way
THE ROLE OF FINANCIAL SYSTEM
STABILITY IN SUPPORTING
ECONOMIC ACTIVITIES
CHAPTER
The dynamics of the global and domesic economies
over the past two years have demonstrated that
inancial system stability has played a more strategic role in supporing economic aciviies. This was illustrated by the fact that disrupions to inancial system stability during the global inancial crisis in
2008 precipitated a catastrophic economic collapse
in developed countries. In contrast, countries that has successfully maintained inancial system stability were able to minimize the negaive fallout from the global inancial crisis. In the context of the ongoing global crisis, one factor among others that has supported the resilence of Indonesian economy is the robust inancial system, paricularly the banks, which is now beter equipped to deal with external shocks
compared to circumstances during the 1997/1998
crisis.
Awareness regarding the importance of inancial system stability and economic aciviies is not a new found concern, paricularly since the 1997/1998 monetary and inancial crisis that had propagated a severe economic contracion.80 Such awareness
80 The correlaion between inancial system stability and
macroeconomic performance is in line with empirical evidence and experience over the past several decades. Abundant literature
empirically proves the posiive relaionship between inancial system
growth and economic growth. See Levine, Ross (1997), “Financial Development and Economic Growth: Views and Agenda,” Journal of Economic Literature, Vol. 35(2). See Olivier J. Blanchard, Giovanni Dell Ariccia, Paulo Mauro (2010) ”Rethinking Macroeconomic Policy”,
IMF Staf Posiion Notes SPN/10/03 on the importance of regulaion
policy as part of macroeconomic policy.
The Role of Financial System Stability
encouraged Bank Indonesia to strengthen inancial system stability, ad ininitum, through reforms in the banking system.
Policies instated in 2009 were extensions of the various policies applied intensively at yearend 2008. In quarter IV 2008, Bank Indonesia in cooperaion
with the Government implemented several measures
to alleviate pressures on domesic inancial system stability. In conjuncion with easing the liquidity pressures at several banks due to counterparty risk, Bank Indonesia broadened the deiniion of collateral for uilizing its long-term funding facility, extended the maturity proile of FTO and forex swap transacions as well as reduced the overnight repo rate.81 In addiion, Bank Indonesia and the
Government also provide funding faciliies under crisis condiion. This is legislated by the second amendment to Act No. 23/1999 regarding Bank Indonesia and Act No. 6/2009. These regulaions represent the legal foundaions for Bank Indonesia to extend credit or inancing to banks sufering from short-term liquidity problems and the provision of an emergency liquidity assistance for banks with systemic impact. Furthermore, in an efort to strengthen inancial system resilience several
supplementary policies were instated concerning the
implementaion of risk management and prudenial principles for aciviies associated with structured
81 These policy steps are presented in the Indonesian Economic Report
of 2008 and Financial Stability Review No. 12, March 2009.
products. Meanwhile, in line with the reducion of BI rate, Bank Indonesia reduced the risk weight for MSMEs in order to expand bank intermediaion.
Ater experiencing escalaing pressures up to quarter I 2009, the array of policies instated managed to achieve domesic inancial system
stability82. This was relected in the easing of risk
and the improvements in a number of inancial sector indicators, principally since quarter II 2009. The Jakarta Composite Index (JCI) rallied on the back of propiious economic growth, low domesic inlaion, and a rebound on global and regional markets. Moreover, the price of government bonds (SUN) strengthened in harmony with the improved domesic economic outlook supported by a decline in Indonesia’s risk premium. Credit risk, which was iniially projected to intensify, was managed well by the banks and, therefore, did not trigger any signiicant inancial market shocks. Liquidity risk was more controlled and market risk tended to ease in accordance with a stronger exchange rate, lower BI rate and restored internaional conidence in Indonesia’s inancial market. Rupiah denominated
credit to the real sector grew favorably on the
strength of preserved banking system stability,
whereas foreign currency credit contracted due to
a decline in export-import aciviies. The various improvements in the inancial system were generally
82 A detailed assessment is presented in Box 1.1. – Policy Response to
the market’s ability to absorb risks; therefore, it has the potenial to disrupt inancial system stability.
Further discussions on these issues are presented in the ive secions that follow. The irst secion outlines inancial sector stability and inancial system resilience in 2009. The second describes the self-inancing phenomenon that contributed to inancial system resilience. The third secion details the relaionship between inancial system stability and macroeconomic stability amid vast capital inlows, including the phenomenon of asset price bubble. The fourth secion illustrates inancial shallowness in Indonesia’s inancial system and several challenges
that need to be resolved in order to improve
performance and stability. The chapter is closed with conclusion and several related policy implicaions. relected in the improvement of the Financial
Stability Index (FSI).
4.1
Financial System Stability
in a Dynamic Economic Environment
Financial system stability in Indonesia was afected by the dynamics of the global and domesic inancial markets. The turbulence in the global inancial markets from quarter IV 2008 unil quarter I 2009 afected the performance of Indonesia’s inancial market. Sluggish stock market and SUN market performance, mouning rupiah volaility and liquidity shorfalls on the rupiah money market placed addiional pressures on inancial system stability. As menioned earlier, in quarter IV 2008, Bank Indonesia and the Government took several measures designed to loosen rupiah and foreign currency liquidity, as well as restore conidence in the inancial system. Such measures were in accordance with those taken by various countries around the world, but at a
relaively lower intensity.83 In the banking sector, these
steps successfully provided breathing space for banks to overcome their liquidity problems during that period, as well as an opportunity to consolidate. In the capital market, rising opimism surrounding a domesic economic recovery, underpinned by a global economic recovery in quarter II 2009 restored the risk appeite of global investors, therefore, foreign capital inlows returned to emerging markets, including Indonesia. This further reduced market risk and improved the performance of Indonesia’s inancial market. Against such an auspicious backdrop, inancial system stability in Indonesia was sustained.
g
Risk Miigaion in the Financial Sector
Condiions on the global inancial market afected the performance of the domesic inancial market and the banking sector. Pressures on the inancial system that emerged in quarter IV 2008 unil quarter I 2009, stemming from global inancial market volaility, undermined the inancial market and banking sector performance. Tight liquidity on the global inancial market spurred investors to adjust their investment porfolio in emerging countries, including Indonesia, which hastened a foreign capital low reversal and intensiied pressures on the domesic inancial market. This was relected in a sharp depreciaion of the rupiah exchange rate, coupled with tumbling share prices and a slump in the price of SUN. In the banking sector, ight liquidity was also found in the interbank money market as a result of the banks’ preference to hoard liquidity and limit interbank transacions.
Improving inancial sector performance and strong domesic bank resilience reinforced inancial system stability. In line with momentum on the global inancial market since quarter II 2009, market conidence in the domesic inancial market began to recover. Growing opimism concerning an economic and global inancial recovery encouraged foreign investors to again seek investment porfolio that provided higher returns through increased investment in emerging markets. This triggered a surge in inlows of foreign capital to the domesic inancial market, which caused equity and government bond price indices to soar. Meanwhile, banking sector resilience improved due to reduced market risk, improved liquidity condiions on the money market and internal consolidaion. Consequently, FSI dropped below the
maximum indicaive limit of 2.00.84
The stability of Indonesia’s inancial system was primarily atributable to inancial system solvency and supported by the panoply of Bank Indonesia’s banking policies. In 2009, Bank Indonesia policy was directed towards simulaing credit extension by emphasizing risk miigaion and bank resilience. To encourage credit allocaion, Bank Indonesia lowered its BI rate and loosened the regulaion on risk-weighted assets to MSMEs. To ameliorate risk
84 FSI is an indicator of inancial system stability based on three blocks: the banking system, stock market and bond market. The psychological threshold of FSI is 2. An FSI value in excess of 2 implies a disrupion to inancial system stability. Comprehensive details on FSI are available in the Bank Indonesia’s Financial Stability Review No. 8, March 2007 and No. 9, September 2007.
miigaion by bank and maintain banking sector stability, Bank Indonesia promulgated Bank Indonesia Regulaion (Peraturan Bank Indonesia or PBI) No. 11/25/PBI/2009
dated July 1, 2009 regarding a bank’s obligaion to efecively apply risk management, both individually and also by consolidaing with subsidiary companies. This regulaion aimed to improve the quality of risk control by banks; therefore, banks were systemically resilient to the variety of emerging risks. Bank Indonesia also issued PBI No. 11/26/PBI/2009 to regulate aciviies related to structured products in order to maintain public conidence in the banking system as well as miigate the market risks associated with structured product transacions.
To miigate liquidity problems, the second amendment to Act No. 23/1999 regarding Bank Indonesia, superseded by Act No. 6/2009 was applied. This law forms the legal basis for Bank Indonesia to extend credit and inancing to banks with short-term funding diiculies, as well as an emergency liquidity assistance for banks with systemic impact. To ensure more cauion regarding potenial imbalances in the inancial system, which was one of several commitments made as a G-20 member, Indonesia implemented the Financial Sector Assessment Program (FSAP). FSAP includes a series of aciviies to diagnose vulnerabiliies in the domesic inancial sector, compaibility to internaional standards including legal aspects, as well as development aspects of the sub-sectors of the inancial system, including banks, the capital market, insurance, the payment system and monetary policy, which all correlate to Indonesia’s inancial system. The results of FSAP becomes a feedback for improvements of structure and various domesic inancial system policies, as well as contribute to improve the architecture of the global inancial system.
minimize the market risk exposure to banks due to weak asset prices on the bond market. These improvements, among others, contributed to inancial system resilience in Indonesia.
In terms of the capital market, price volaility was ofset by the relaively high appeal of Indonesia’s capital market products to foreign investors as well as the paucity of external shocks that could signiicantly disrupt the domesic stock market. Indonesia’s bonds market, consising purely of tradiional products due to the relaively thin market, did not trigger any noteworthy disturbances in the inancial market as a whole. Bank Indonesia noted that the banking system maintained
a 79.5% share of the total inancial system.85 Banking
system performance also has a signiicant impact on the inancial system due to the concentraion of capitalizaion within the inancial sector. Therefore, for the case of Indonesia, stable banks also create a stable inancial system. Conversely, unstable banks will lead to inancial market instability through negaive market seniments toward shares and obligaion from inancial companies and declining market conidence. Looking ahead, the nascent global economic recovery requires close atenion and Indonesia’s inancial system must maintain sound fundamentals in order to avoid any negaive impacts stemming from a recurrence of global inancial or economic turbulence.
85 See Financial System Review No. 13, September 2009, Bank
Indonesia.
g
Financial System Stability and
Development in the Financial Sector
Banking Sector Adjustments
Fluctuaions in the global inancial market that dried up liquidity on the global money market also impacted domesic liquidity and bank performance. Several banks were unable to fulill their short-term liquidity requirement due to ight bank liquidity in quarter IV 2008. Interbank market segmentaion problem was compounded by a lower supply of funds from the banks that actually maintained a liquidity surplus but tended to avoid risks, and therefore, preferred to hoard their liquidity.
Liquidity shorfalls had a major impact on the behavior of banks, which were iniially aggressive in seeking credit expansion in 2008 but became more prudent. The prudent stance of banks coupled with apprehension concerning a potenial rise in NPL encouraged banks to place their funds in BI Ceriicates and FASBI, which is evidenced by expanding shares of BI Ceriicates and FASBI to earning assets, whereas the share of credit diminished (Chart 4.1). This trend is a relecion of the banks’ eforts to miigate liquidity risk by maintaining adequate liquidity. One of the numerous indicators of banks liquidity is the liquid assets to deposit raio. The higher this raio, the more capable a bank is in dealing with deposit withdrawal risk that exceeds the daily average. In 2009, banks successfully miigated their liquidity risk and maintained their liquid assets to deposit raio in the range of 20% (Chart 4.2).
Chart 4.1 Share of Credit and SBI plus FASBI to
Producive Assets
Chart 4.2 Liquid Assets (LA) to Deposit Raio SBI and FASBI Credit (rhs)
percent percent
LA/DPK Raio (rhs)
trillions of rupiah
As liquidity risk dispersed, market risk also improved, thus shoring up bank performance. Beter stock market and bond market performance together with rupiah appreciaion eased market risk. The 6.98% increase in the SUN price index lowered the risk of a decline in the SUN price on the trading porfolio of the banks’ balance sheets. From the perspecive of the banks’ porfolio maturity proile, bank liabiliies were dominated by short-term liabiliies, whereas banks assets tended to be longer term, both on the rupiah and foreign currency porfolios (Chart 4.3 and 4.4). Consequently, banks had the opportunity to re-price, where the downward interest rate trend in the irst semester of 2009 was favorable due to the lower cost of funds. Furthermore, this form of short-term bank liquidity was placed in assets with a longer maturity proile. In terms of foreign currency, the short-term liabiliies of banks decreased in line with rupiah depreciaion and a lower foreign currency deposit interest rate level in quarter IV 2008 and quarter I 2009. Meanwhile, bank aversion to extend foreign-currency-denominated credit was demonstrated by declining long-term foreign currency assets in quarter I through quarter III 2009. This was necessary to reduce exposure on the foreign currency porfolio as banks awaited conirmaion of the global economic recovery.
Credit risk, which escalated in early 2009, began to recover as relected by a lower NPL raio at yearend 2009. The bank gross NPL raio was 3.79% at the end of 2009, declining from its peak in 2009 at 4.71% in May. The highest nominal NPL increase occured in trade and miscellaneous sectors, which concomitantly experienced the most expansive credit growth compared to other sectors. The growing raio of loan loss provisions to NPL persisted from early 2008
unil yearend 2009 (Chart 4.5), which highlights the banks’ endeavors to alleviate their credit risk.
Bank consolidaion also contributed to the improvement in bank performance. Banks began to lower their interest rates on ime deposits in line with the reducions in the BI rate. However, the percepion of a high-risk real sector inevitably resulted in a slower decline in lending rates compared to saving rates, therefore, interest rate spread increased. Earnings accrued from the interest rate spread, when added to the fee-based income, helped maintain bank proitability. This was relected by the relaively high Return on Assets (ROA), averaging 2.67% in 2009. Despite the contribuion of an increase in bank proitability to maintain banking system stability as a whole, regrefully it somewhat undermined the intermediaion funcion.
Improved banking sector performance was also relected by relaively sound bank solvency, which manifested in
Chart 4.3 Rupiah Porfolio Maturity Proile Chart 4.4 Forex Maturity Proile
trillions of rupiah
1 month 1-3 months 3-6 months 6-12 months > 12 months
millions of USD Rp/USD
1 month
Chart 4.5 NPL and Loan Loss Provision Gross NPL Loan Loss Provision Net NPL trillions of rupiah
Nominal NPL
a Capital Adequacy Raio (CAR) that was jumped 117 bps to 17.37% in 2009, compared to a 310 bps decline in 2008 (Table 4.1). Such condiions were a relecion of bank eforts to consolidate internally in order to reinforce solvency by accumulaing more capital, which cushions economic turbulence and provides clear signals regarding the soundness of the bank. The conservaive stance of banks was further evidenced by signiicantly slower asset expansion in 2009 as a result of sluggish credit growth in response to economic condiions and the wait-and-see aitude when dealing with growing uncertainies on the global inancial market. The slowdown in global and domesic economic aciviies in 2009 also reduced the expansion of bank deposits. Deposits only grew by 12.53% compared to 16.06% in 2008.
Stock Market Development
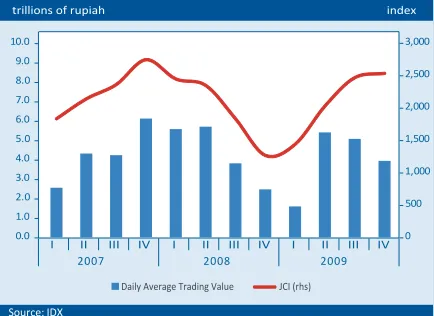
Stock market performance in 2009 recovered ater the iniial blip in quarter I 2009. The drasic decline in the Jakarta Composite Index (JCI) that began in quarter IV 2008 reached its nadir at a level of 1,256 in March 2009, its lowest level since 2006. Trading volume also contracted signiicantly to Rp1.57 trillion per day, compared to the annual average of Rp3.99 trillion per day (Chart 4.6).
Notwithstanding, stock market performance gradually recovered in line with improvements in global inancial market condiions during quarter II 2009, which sparked a resurgence in foreign capital inlows. An increase in transacion aciviies by foreign players, closely mirrored by domesic players, insigated an impressive 86.98% upswing in the JCI closing at 2,534 in 2009. This upswing was the highest experienced by any index in the Asian region (Chart 4.7). In addiion to the resurgence in capital inlows, the rally on the JCI was also due to the improved fundamentals of companies issuing shares, therefore restoring the conidence of market players. In accordance with increasing trading aciviies, average trading volume in 2009 achieved Rp3.99 trillion per day, with the net foreign purchases valued at Rp13.92 trillion.
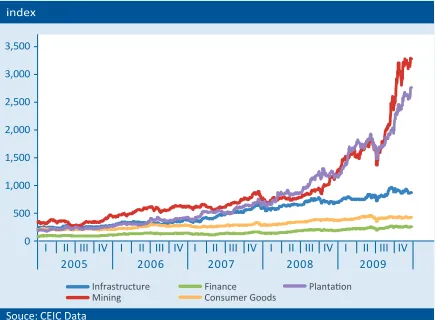
JCI momentum was also supported by sectoral price index increases. Opimism regarding the end of the global recession sparked commodity price hikes on the internaional market. This encouraged investors to seek stocks in primary commodiies such as mining, hence, the signiicant upturn (Chart 4.8). The rapid upsurge in the mining sector was also buoyed by investor preference towards commodity-based sectors rather than the inancial sector. Meanwhile, share price index volaility also gradually dissipated in accordance with the improvement in stock market performance despite the domesic poliical situaion that tended to heat up at yearend 2009, which intensiied volaility (Chart 4.9).
Amid improving stock market performance, inancing through the issuance of shares, through Iniial Public Oferings (IPO) or rights issues, decreased. Total shares issued in 2009 achieved just Rp13.0 trillion as follows: IPOs amounted to Rp3.7 trillion and right issues Rp9.3
Year Growth (%)
CAR Asset Deposits
2007 -117 bps 14.75 17.39
2008 -310 bps 16.32 16.06
2009 117 bps 9.68 12.53
Table 4.1 Growth of Capital, Asset and Third Party Fund
Chart 4.6 JCI and Average of Stock Trading Value Chart 4.7 Global Stock Market 2009
Source: IDX trillions of rupiah
JCI (rhs) Daily Average Trading Value
trillion (Chart 4.10). Total issuances declined by 83.5% compared to the previous year that reached Rp79.2 trillion (IPOs Rp23.7 trillion and right issues Rp55.5 trillion). The number of companies issuing shares nearly halved from 42 in 2008 to 25 in the reporing year. Most companies issuing shares were from the inancial and trading sectors. Cumulaively, shares issued by companies in the inancial sector accounted for 46.2% of the total, whereas the trading, services and investment sector made up 21.0%.
A precipitous drop in share prices heavily afected the decline in issuances during quarter IV 2008 and quarter I 2009. Due to the slump in share prices, several companies that had previously obtained permits to issue shares postponed issuances as it was deemed unproitable. Issuances usually gain momentum during periods of share price hikes because the capital investment cost becomes relaively cheaper, which further boosts the
asset valuaion raio (Q raio).86 However, the opportunity
provided by the increase in Q raio was underuilized by companies issuing shares to inance their investment aciviies. The impressive rally on JCI in 2009, which approached its peak during a boom period, was not followed by a corresponding rise in issuances (Chart 4.11).
Bond Market Development
In line with condiions prevalent on the inancial market, SUN market performance also experienced pressures from quarter IV 2008 unil quarter I 2009, before subsequently recovering. Pressures on the SUN market stemmed from
86 When share prices increase, the Q raio value, which is the raio of share market value against asset value, will increase (Tobin, James (1969), “A General Equilibrium Approach to Monetary Policy”, Journal of Money, Credit and Banking Vol. 1 No. 1). When Q>1, the replacement cost of capital is cheaper, therefore moivaing companies to increase investment by issuing shares.
Chart 4.8 Sectoral Price Index Chart 4.9 The Volaility of Asian Stock Indices
Source: Bloomberg
Source: Bloomberg percent
Indonesia Japan Thailand Malaysia Singapore Hong Kong
Chart 4.10 Share Issuance, IPO, and Right Issue Chart 4.11 JCI and Share Issuance Volume
Source: Indonesia Capital Market and Financial Inituaion Supervisory Agency
trillions of rupiah
Source: Indonesia Capital Market and Financial Insituion Supervisory Agency
trillion of rupiah, percent index
widespread selling by foreign investors, which depressed the SUN price index to 81.32 in March 2009 (Chart 4.12 and Chart 4.13). Along with the decline in SUN price, the yields of SUN for all tenures increased. Yield average for all tenures was 12.4% in February 2009. However, with the return of foreign capital lows to the SUN market and Indonesia’s improved sovereign raing, the SUN market began to rebound. The risk appeite of foreign investors returned in quarter II 2009, which brought vast inlows of foreign capital to the SUN market. Besides, relaively sound macroeconomic fundamentals in Indonesia and improved debt risk helped restore market player conidence in SUN instruments. The upgraded sovereign raing of Indonesia awarded by Moody’s to Ba2 spurred posiive seniment that strengthened the average price of FR series SUN for all tenures. This led to a 6.98% increase in the SUN price index (IDMA), climbing from 88.21 at the end of 2008 to 94.37 by the end of 2009 (Chart 4.13).
SUN of all tenures improved on their respecive markets (Chart 4.13). In 2009, the monthly average price of medium-tenure and long-tenure SUN strengthened most signiicantly, by 1,361 bps (increase of 13.98%) and 1,632 bps (18.83%) respecively. Meanwhile, short-tenure SUN increased by just 407 bps (4.03%). Even though long-tenure SUN experienced the most signiicant price hikes, the decline in long-tenure SUN yield was relaively slow, dropping by just 129 bps, compared to 379 bps and 236 bps for short and medium-tenure SUN respecively. This was associated with the lack of liquidity for long-tenure SUN market. Meanwhile, in accordance with improved SUN performance, foreign SUN ownership increased by Rp20.1 trillion. However, the trading volume of SUN, on average, declined to Rp3.39 trillion per day compared to Rp4.49 trillion per day in 2008.
Corporaions exploited the SUN market to obtain cheaper inancing through the issuance of bonds. Lower SUN yield, which is oten applied as a reference point for the issuance of bonds, encouraged companies to issue bonds in order to inance their business aciviies. That was relected by the growing value of corporate bonds issued, which even exceeded the value of shares issued. Corporate bonds issued in 2009 were valued at Rp27.2 trillion, which was a 128.7% increase compared to the previous year (Chart 4.14). Of the total bonds issued, sharia bonds accounted for Rp1.3 trillion (4.9%); dominated by bonds based on leasing
principles (ijarah). Meanwhile, the value of corporate
bonds that matured in 2009 totaled Rp12.3 trillion, thus giving a net increase in inancing from corporate bonds of Rp14.9 trillion. This net increase boosted outstanding corporate bonds by the end of reporing year to Rp88.3 trillion. In addiion to the lower SUN yield, two other factors indicated the high value of corporate bonds issued during the reporing year, namely the large value
Chart 4.12 Foreign Investment Chart 4.13 SUN Average Price Indices
Source: CEIC Data
SBI SUN Share
trillions of rupiah
Source: Bloomberg
Short term < 5 years Long term > 7 years Medium term 5-7 years Monthly Average index
Chart 4.14 The Issuance of Corporate Bonds
Source: Indonesia Capital Market and Financial Inituaion Supervisory Agency
trillions of rupiah trillions of rupiah
Corporate Bond Issuance Corporate Bond Outstanding (rhs)
of bonds reaching maturity that required reinancing and the banks’ reluctance to extend credit, as relected by the phenomenon of credit interest rate rigidity. Consequently, companies seek alternaive inancing sources.
By sector, companies in the inancial sector dominated those using bonds as a source of inancing. The cumulaive share of bonds issued by companies in the inancial sector by the end of 2009 reached 47.9% (Chart 4.15). The relaively high share of the infrastructure and transportaion sector was paricularly noteworthy, amouning to 22.7%. Cumulaively, the value of bonds issued by the infrastructure and transportaion sector exceeded the value of shares issued. This was an indicaion that companies in the infrastructure and transportaion sector were more likely to issue bonds rather than shares to inance their investments. However, the concentraion of share and bonds issuances on the inancial sector highlights an important risk potenial that requires further observaion. In the event of a shock befalling a inancial insituion, the high concentraion will signiicantly disrupt stability on the bonds market.
The combinaion of lower risks in banking, improved proitability and solvency at banks, as well as improved
stock market performance contributed to improve the stability of Indonesia’s inancial sector. FSI (inancial stability index) declined from 2.43 during the height of the global crisis to 1.91 in December 2009 (Chart 4.16). The favorable characterisics of low market risk and sound bank solvency in Indonesia’s inancial system were in stark contrast to condiions in more developed countries. Currently, developed countries are sill struggling to improve their solvency condiions. The relaively solid foundaion that is Indonesia’s banking system, as a result of a restructuring program implemented in conjuncion with the 1997/1998 economic crisis recovery, has
bolstered bank resilience in terms of dealing with liquidity issues. Therefore, banks can coninue to perform their funcion, primarily supporing the payment system, and can drive economic growth. In this context, inancial system resilience is associated with the availability of reliable payment system infrastructure. Bank Indonesia maintained payment system infrastructure reliability through the development and implementaion of the
Bank Indonesia - RTGS system and Bank Indonesia - 2nd
Generaion SSSS in 2008. The more reliable, secure and eicient infrastructure, as well as the improved risk-miigaion capabiliies of BI-RTGS support inancial system stability.
Chart 4.15 Cumulaive Share of Bond Issuance by Issuer
Business Sector
Chart 4.16 Financial Stability Index (FSI) Source: Indonesia Capital Market and Financial Inituaion Supervisory Agency
Agriculture, 2% Mining2%, Basic Industry & Chemical, 5%
Miscellaneous Industry, 2%
Transportaion, 23%
Mini crisis 2005: 2.33 Crisis 1997-1998
March 1997: 3.23
4.2
Financing Economic Acivity:
The Internal Financing Phenomenon
Amid limited credit extension by banks, economic players sought alternaive inancing sources, which include the capital market, non-bank inancial insituions and internal inancing. Based on the ideniicaion of economic inancing sources, internal inancing was the main
economic source of inancing compared to other sources like banks, capital market, government and foreign sources. In this regard, the corporate sector tended to opimize inancing sources from retained earnings and asset structure adjustments, paricularly on inventory and other current assets. Analysis using the Flow of Funds approach also demonstrated that when economic aciviies wane, the business sector adjusts porfolio asset placements to obtain alternaive inancing sources. Such condiions imply that business players maintain a inancing bufer amid limited bank credit and inancing through the capital market.
their investments, thus encouraging the uilizaion of internal sources.
To analyze economic sources of inancing, several approaches have been taken, namely survey, the Gross Fixed Capital Formaion approach, Flow of Funds approach and Listed Company Balance Sheet approach. In general, these approaches all conirmed the dominant use of internal funds in company inancing.
g
Financing Source Survey
The survey approach was conducted to reveal the dominant role of internal inancing during the
post-crisis period. The survey was performed in 200187 and
showed that the share of internal sources reached 56%, whereas inancing from bank loans was just 24%, foreign borrowing 5%, equity 6% and bonds 3%. The 2002 survey, however, indicated an increasing share of internal inancing to 60.7%, whereas the share of inancing from
bank loans shrank to 20.7%.88 The dominance of internal
inancing, hitherto, coninued, which was conirmed by the 2009 Bank Indonesia survey that revealed the share of internal inancing remained in the range of 60%,
87 Agung, Juda, Bambang Kusmiarso, Erwin G. Hutapea, Bambang Pramono, Andry Prasmuko, Nugroho Joko Prastowo (2001), “Credit Crunch in Indonesia in the Atermath of the Crisis: Facts, Causes and Policy Implicaions”. Directorate of Economic Research and Monetary Policy, Bank Indonesia, p.48
88 Kusmiarso, Bambang, Elisabeth Sukawai, Sudiro Pambudi, Dadal Angkoro, Andry Prasmuko, Iss Savitri Haidz (2002), “Interest Rate Channel of Monetary Transmission in Indonesia,” Transmission Mechanism of Monetary Policy in Indonesia. Directorate of Economic Research and Monetary Policy, Bank Indonesia, p. 60
whereas the share of domesic bank loans was in the 21%
range (Chart 4.17).89
g
Gross Fixed Capital Formaion
The above changes in the structure of economic inancing sources was also conirmed by the Gross Fixed Capital Formaion approach that clearly indicated a decreasing share of bank loan inancing and an increasing share of internal inancing. Prior to the crisis, the share of bank loans reached 31.8%, whereas internal inancing was just 12.4%. The composiion changed to 16.1% for bank loans and 46.0% for internal inancing in 2008 (Table 4.2). Despite the improvement in the intermediaion funcion in line with the post-crisis economic recovery, the share of bank loans remains well below that prior to the crisis. Companies did not opimally exploit the period of rising share prices from 2005 to mid 2008; therefore, the porion of share issuances remains relaively small.
g
Flow of Funds
The relaively minor share of bank loans in economic inancing was also evidenced by data analysis using the low of funds, which showed the correlaion between inancial transacions of various economic sectors, both in the domesic sector and foreign sector, in inancing their economic aciviies. Flow of funds staisics detailed the inancial transacions of eight categories of economic
89 Bank Indonesia (2009), The 2009 Adhoc Survey “ The Condiions of Companies’ Employment, Finance and Financing,” Directorate of Economic and Monetary Staisics, Bank Indonesia.
Chart 4.18 Share of Non-Financial Investment, Flow of Funds Balance 2005-2007
Chart 4.17 Source of Financing of Corporate Investment
Source: BPS-Staisic Indonesia (processed)
73% 73%
State-Owned Enterprise GovermentHousehold Financial Sector (monetaryauthority, bank & non-bank)
agents, namely the monetary authority, banks, non-bank inancial insituions, households, the Government, state-owned enterprises, businesses and foreign. Flow of funds data for 2005-2007 demonstrated that non-inancial investment in the Indonesian economy was dominated by the business sector (private companies) with an average share of 69.7%, followed by the Government with 12.7%, state-owned enterprises with 8.8% and 8.2% for households (Chart 4.18). In terms of the source of funds, inancing to the business sector and state-owned enterprises (including non-investment aciviies) in 2007 was dominated by equity and ownership investment, as well as saving. Meanwhile, inancing from bank loans accounted for just only 18% for the business sector, 7% for state-owned enterprises and 15% for households (Chart 4.19).
Table 4.2 Sources of Investment Financing in Indonesia
*government investment data (processed from State Budget)
**the diference between investment credit and working capital credit ***FDI withdrawal realisaion and external debt, balance of payment (BoP) ****internal fund is residual which included retained earning and addiional capital, etc
trillions of rupiah
Chart 4.19 Source of Financing for Firm and Household Aciviies,
Flow of Funds Balance 2007
Source:BPS-Staisic Indonesia (processed)
33%
22%
37%
18 %
7%
15% 42%
56 %
0%
Gross Deposit
Share and Paricipaion Cerificate SecuriiesCredit Commercial CreditOthers
Descripion 1995 2000 2005 2007 2008
Gross Fixed Capital Formaion (Nominal
Investment) 129.2 275.9 655.9 983.8 1,369.6
Sources of inancing:
1. Government* 33.6 29.2 77.3 133.7 181.3
2. Banking Loans** 41.1 27.9 80.7 151.8 220.7
3. Foreign Financing*** 27.5 84.7 170.4 203.6 244.1
FDI, equity capital & RE 6.2 8.1 76.2 69.2 67.9
FDI, loan disbursement 7.4 17.8 16.0 50.0 81.4
Other, loan disbursement 13.9 58.9 78.3 84.4 94.8
4. Stock Issuance 8.9 19.4 10.2 47.3 78.9
5. Bond Issuance 2.0 5.6 8.2 31.3 14.2
6. Internal Fund**** 16.1 109.1 309.2 416.1 630.4
Total 129.2 275.9 655.9 983.8 1,369.6
Porion of Source of Financing
1. Government* 26.0% 10.6% 11.8% 13.6% 13.2%
2. Banking Loans** 31.8% 10.1% 12.3% 15.4% 16.1%
3. Foreign Financing*** 21.3% 30.7% 26.0% 20.7% 17.8%
FDI, equity capital & RE 4.8% 2.9% 11.6% 7.0% 5.0%
FDI, loan disbursement 5.7% 6.4% 2.4% 5.1% 5.9%
Other, loan disbursement 10.8% 21.3% 11.9% 8.6% 6.9%
4. Stock Issuance 6.9% 7.0% 1.5% 4.8% 5.8%
5. Bond Issuance 1.6% 2.0% 1.2% 3.2% 1.0%
6. Internal Fund**** 12.4% 39.5% 47.1% 42.3% 46.0%
Data analysis using the low of funds revealed an interesing behavioral trait. The business sector adjusted its porfolio to fund business aciviies when the economy was in a crisis. Porfolio adjustment was performed by: (i) reducing deposits in forex and rupiah, (ii) reducing placements in short-term securiies, and (iii) reducing the capital accumulaion. Reducing porfolio placements by the business sector was one source of funding during a period of sluggish economic growth and limited alternaive sources of inancing.
g
Balance Sheet of Listed Companies
Analysis of the balance sheets of listed companies90 also
revealed the use of liquid assets and retained earnings as sources of inancing, as relected by the decreasing share of inventory to total assets and increasing share of retained earnings to total assets. Among the 170 companies sampled under the categories of manufacturing, infrastructure, agriculture and mining, inventory shares declined during the period of January 2007 to June 2009 (Chart 4.20). In addiion to reducing
90 Analysis was performed on balance sheets of 170 listed companies
in the Indonesian Stock Exchange during the period of irst quarter of 2007 to second quarter of 2009.
inventory, companies in the manufacturing, mining and agricultural sectors also uilized retained earnings as a source of inancing (Chart 4.21). The uilizaion of inventory and increasing retained earnings are a business survival strategy amid inauspicious economic condiions to overcome the requirement for inancing from limited sources. A larger raio indicates a greater potenial to uilize retained earnings for future company inancing.
The sustaining role of internal inancing up unil now, on one hand, could indicate that the corporate sector was resilient to the crisis due to favorable proitability and, therefore, can aford the inancing requirement. Yet on the other hand, it could indicate constraints to accessing external sources of inancing, either from banks or the capital market. Constraints to external inancing sources were primarily sufered by MSMEs, which were mainly due to administraive factors, such as the feasibility of inancial statements and insuicient collateral. Nevertheless, internal inancing was a reliable alternaive to inance economic acivity, paricularly during a crisis, which enabled the economy to coninue expanding.
Chart 4.20 Inventory to Total Assets Raio Chart 4.21 Retained Earnings to Total Assets Raio
Manufacture Mining
Plantaion Infrastructure (rhs)
Source: IDX (processed)
Plantaion Mining Manuf acture Inf rastructure
4.3
Financial System and Macroeconomic
Stability amid Surging Foreign Capital Inlows
The dynamics of the global and domesic economies indicated a close correlaion between the performance of the inancial sector and macroeconomic condiions. Developments in the global economic environment over the past decade, closely followed by rapid changes in the inancial system, have created a stronger feedback loop between inancial system stability and macroeconomic stability. This was undoubtedly evidenced during the global inancial crisis in 2008. Financial market instability brought with it relaively signiicant negaive impacts on macroeconomic performance. Despite extensive inancial product innovaion that enriched investment choices and broadened access to inancing for households and the corporate sector, inancial system instability had a strong impact on macroeconomic stability due to exising market imperfecions. Such a weakness could prolong the impacts of the crisis on the inancial sector and undermine economic performance in general.
desinaions favored by global investors due to maintained macroeconomic stability, posiive economic growth and relaively high yields compared to other emerging markets. On the one hand, capital inlows shore up inancial system stability. However, on the other hand, capital inlows have the potenial to trigger inancial system instability in the event of a sudden capital reversal, therefore disruping macroeconomic stability.
In Indonesia’s case, vast foreign capital inlows to Indonesia afected inancial sector and macroeconomic performance. For the inancial sector, a rapid upsurge in foreign capital inlows signiicantly contributed to an
increase in performance and lead to rupiah appreciaion.91
Eventually, such growth dissipate market risk and maintained the bank intermediaion funcion, therefore, preserving inancial system stability. Rupiah appreciaion due the surging capital inlows also contributed to macroeconomic stability in the short run.
Amid various posiive efects brought about by foreign capital inlows on inancial system stability and
macroeconomic stability, one phenomenon that requires closer observaion is soaring asset prices, in paricular share prices. As described previously, the strong upsurge in foreign capital inlows to Indonesia improved inancial market performance, especially the stock market (Chart 4.22 and Chart 4.23). Vast foreign capital inlows to the domesic inancial market were also atributable to propiious domesic economic condiions. Furthermore, favorable social and poliical condiions as well as sound
91 Detailed explanaions on the inluence of foreign capital lows
on exchange rate growth and monetary stability are presented in Chapter 3, Monetary Policy Response during the Global Crisis.
economic fundamentals raised the percepion of foreign investors. Indonesia represents one of the few countries that recorded posiive economic growth amid the threats of global recession in 2008. In addiion, inlaionary pressures subsided; therefore, Bank Indonesia had the opportunity to reduce its policy rate to 6.50%. Bank Indonesia’s policy to trim its BI rate was responded to
favorably by market players.92
Surging capital inlows and auspicious macroeconomic condiions were the primary factors driving posiive stock market growth. Indonesia’s stock market rallied 86.98% in 2009. Meanwhile, over the past four years,
JCI had skyrocketed by 153.38%93. Market capitalizaion
also expanded exponenially by 189.49% from Rp676.66 trillion in 2004 to Rp1,958.83 trillion at yearend 2009. By sector, the performance of the mining and agricultural sectors improved tremendously (Chart 4.24) on the back of soaring commodity prices on internaional markets. Market players expect that such growth on the internaional market will posiively impact company performance.
Regretably, the impact of vast capital inlows on stock market indices was occasionally excessive. The purchase of shares by foreign investors was frequently mirrored by domesic market players, therefore, the impact on prices was muliplied and the index increased sharply. Despite the posiive impact of foreign investors on share price index growth, oten imes the price hikes were not supported by macroeconomic or microeconomic
92 Test results by BI demonstrate that a BI rate reducion is one factor
that afects share prices and SUN yield.
93 Posiion at yearend 2004 compared to posiion at yearend 2009.
Chart 4.22 Capital Inlow and JCI Chart 4.23 Daily Capital Inlows and JCI 2009
Source: CEIC Data
JCI (rhs)
millions of USD index
Foreign by Net Inflow
Net inflow Net ouflow
JCI (rhs)
millions of USD index
Net Foreign Inlow/Ouflow
Inflow
Ouflow
fundamentals. This was considered as the case in 2009. JCI growth far exceeded that of macroeconomic fundamentals, which was relected by growth in M1 and currency (Chart 4.25 and 4.26). From a micro perspecive, the strong rally on the price index was not supported by a corresponding improvement in company fundamentals, as relected by Earnings before Interest, Taxes,
Depreciaion and Amorizaion (EBITDA), which all grew negaively for several sectors that experienced expansive growth (Table 4.3). Sharp hikes in the prices of inancial market instruments without strong fundamentals were an alarming signal of a potenial asset price bubble that could trigger a new crisis when the bubble bursts.
Signs of a share price bubble emerged in several periods. Over the past ive years, price bubbles had been in evidence since mid 2003. Observaions during the period of 2003-2006 indicated relaively persistent
yet not explosive price bubbles94. This coninued unil
2007 but subsequently burst at the beginning of 2008, plummeing to its nadir in October 2008 following the bankruptcy of Lehman Brothers. Test results empirical
prove the existence of such condiions95 (Chart 4.27).
Concerns of an asset price bubble reemerged mid 2009 ater the Indonesian stock market experienced a very sharp upswing. Notwithstanding, indicaions of an asset price bubble faded away by yearend 2009. Market players exploited the strong JCI through proit taking, which occurred several imes in 2009, therefore necessitaing correcions to alleviate the risks associated with an asset price bubble burst.
94 Test used the autoregressive and unobserved component methods.
95 Asset price bubble potenial was measured using an Autoregressive Distributed Lag /ADL(1,1) Dynamic Structural Model with an observaion period from January 2003 – November 2009.
Chart 4.24 Sectoral Price Index Chart 4.25 The Growth of JCI and M1
index
Souce: CEIC Data Source: IDX
JCI M1 (rhs)
yoy yoy
Table 4.3 Growth of Sectoral Indices and EBITDA
Sectors
6.46 179.84 67.26 -54.34
Mining -32.79 151.06 49.11 -72.85
Consumer Goods 25.77 105.39 39.34 -26.04
Basic Industry -11.38 102.93 73.65 -43.89
Plantaion -78.95 90.81 -87.76 -64.75
Trade 5.49 85.91 25.29 -62.32
Finance 0.00 70.94 0.00 -33.85
Infrastructure 10.42 48.57 -7.32 -46.79
Property -20.27 41.85 30.59 -59.17
Chart 4.26 The Growth of JCI and Currency Chart 4.27 JCI, Fundamental JCI, Spread
JCI Currency (rhs)
yoy yoy
Source: IDX Source: IDX (processed)
index spread
Spread (rhs) JCI Fundamental JCI
Indicaions of a share price bubble in 2009 were also noted from the technical indicator Price Earnings Raio (PER) of the Indonesian stock market. PER at the end of 2009 reached 28.1, which exceeded the annual average for 2009 of 23.3 and easily surpassed the historical average for the last ive years of 17.00. Indonesian PER was the highest in the region, with the excepion of China. When observed in more detail, indicaions of a price bubble were found on the share prices of the mining sector and inancial sector in line with opimism surrounding a global economic recovery and rising global commodity prices.
Financial asset price bubbles also afected other countries. A more rapid pace of inancial market recovery compared to real sector recovery demonstrated excessive asset price increases. However, the 2009 phenomenon of inancial sector asset price increases in developed countries involved limited risk if the bubble bursts because the ongoing hikes in inancial asset prices in developed countries were not accompanied by a credit boom bubble. Therefore, when the bubble bursts its impact on the
inancial sector will be insigniicant.96 Such condiions
would be diferent in emerging markets, such as China and India. Soaring asset prices in emerging markets were among several factors triggered by government iscal simuli and increasing credit allocaion, as occurred in
96 Mishkin menioned that a credit boom bubble is a condiion where over expecions of economic prospects or structural changes in the inancial market would generate excessive credit allocaion. Credit funds used to purchase credit assets will trigger soaring asset prices and strong credit demand will encourage banks to lower their requirements for credit extension, as happened prior to 2007 (Mishkin, Frederic (2009), “Not all bubbles present a risk to the economy”, Financial Times, November 29).
China. Therefore, the risk of an asset price bubble burst could bring negaive impacts to the inancial sector. Due to close integraion among inancial markets in Asia an asset price bubble burst in China would precipitate a capital low reversal from emerging markets in the region to developed countries such as the U.S.
Amid indicaions of a share price bubble, the negaive impacts on the domesic inancial sector are predicted to be minimal if a sharp correcion takes place as occurred in quarter IV 2008. Skyrockeing share prices on the domesic stock market were principally triggered by the upsurge in foreign capital lows, whereas banking sector involvement in stock trading remained limited. Systemic risk in the inancial sector tends to intensify if asset price hikes are inanced by bank loans and assets are used as collateral. Under such circumstances, asset price increases tend to spur credit growth, as happened in developed countries prior to the subprime mortgage debacle. A sharp decline in asset prices has the potenial to increase bank’s balance sheet exposure to credit extended for the purchase of such assets. In Indonesia, asset prices that indicated a price bubble only afected share prices, for which the increase was not inanced by bank loans. The impact of share price movements on banking sector performance was relaively minimal due to Bank Indonesia regulaions to prohibit banks from purchasing shares on the capital market.
4.4
Financial Sector Deepening and
Instrument Development
Financial sector deepening is a crucial aspect of inancial market development in a country. Relaing to the business community, a deep inancial market can facilitate an increase in economic aciviies by availing various inancing alternaives. In terms of investors, a deep inancial market provides more investment opions, therefore allowing the opimizaion of investment yield. Nonetheless, inancial sector deepening should be performed measurably and prudently. Experience garnered from the 2008 inancial crisis provided many valuable lessons that inancial market deepening without clear regulaions can disrupt inancial system stability.
Chart 4.30 Financial Sector Assets to GDP Raio
Limited investment alternaives in the inancial sector also afect bank liquidity management. Consequently, the banks are more likely to place any excess liquidity at Bank Indonesia. However, learning from experience gleaned during the 2008 inancial crisis, prudenial regulaions must be prepared beforehand and market deepening should be measurable and prudent to enable Indonesia’s inancial sector to beneit from inancial sector deepening and minimize the risk of moral hazard behavior of the market paricipants.
Several indicators relect the relaively shallow inancial market of Indonesia. The M2/GDP raio, one of several inancial sector deepening indicators, has followed a
downward trend since the 1997/1998 crisis.97 The global
inancial crisis, which afected the domesic inancial sector, was revealed to coninuously lower this raio (Chart 4.28). This signiies that the inancial sector in Indonesia has become shallower compared to the inancial sectors of other countries in the Asian region. At the end of 2009, the M2/GDP raio of Indonesia was 38.0%, which was below that of the Philippines. This shallowness opened up gaps in inancial sector deepening in the region, such as Malaysia, Thailand, Singapore and South Korea (Chart 4.29). Meanwhile, the inancial sector assets to GDP raio also evidenced a shallow inancial sector in Indonesia compared to other countries in the region (Chart 4.30). To simplify the comparison, inancial sector assets comprised
97 The most common indicator used to assess inancial sector depth is
the raio of liquid liabiliies in inancial system against gross domesic product, in this case M2/GDP (King and Levine, 1993). Such liquid liabiliies consist of currency in circulaion which is added to deposits (interest bearing liabiliies) collected by banks and non-bank inancial insituions, that staisically are reported as broad money (M2 or M3).
of total bank assets and the capitalizaion value of the capital market.
There were two main contribuing factors for the shallowness of Indonesia’s inancial sector, namely: (i) limited intermediaion performed by insituions in the inancial sector, and (ii) low capital market uilizaion to inance investment. The limited inancing capacity of banks led to a relaively low loan-to-GDP raio in Indonesia compared to other countries (Chart 4.31). Slow loan extension will persist if banks coninue their risk-averse behavior and limit loan allocaion, therefore, the Loan-to-Deposit Raio (LDR) will also be low. For banks with high LDR, the availability of non-deposit fund accumulaion instruments, such as bonds and derivaives like Asset Backed Securiies (ABS) that increase bank liquidity, can improve the intermediaion capacity of banks.
Chart 4.28 M2 to GDP Raio of Indonesia Chart 4.29 M2 to GDP Raio of Region
The lack of interest shown by companies in Indonesia to issue stocks and bonds as a source of inancing has restricted the availability of investment instruments for investors. Intense demand pressures for investment instruments that are not followed by a corresponding increase in supply will create a price bubble that could trigger a crisis if the bubble bursts. This is relected by the correlaion between market capitalizaion value and stock price index, which in this case implies that an increase in stock market capitalizaion value is atributable more to price hikes than an expansion in volume (Chart 4.32). Meanwhile, on the bonds market the Government issued large quaniies of SUN, mainly for the bank recapitalizaion program, yet the raio to GDP remained relaively small when compared to the Philippines, Malaysia and Thailand (Chart 4.33). Moreover, the raio for corporate bonds was a long way behind Malaysia and Thailand.
A shallow inancial market also leads to a less liquid inancial market. Limited investment instruments cause investors to be less acive; therefore, the market is not liquid. Such condiions beset Indonesia’s inancial market with thin liquidity that was found not only in the bond market but also in the stock market. The liquidity of Indonesia’s bond market is comparaively lower than other countries in the Asian region, both for government bonds and private bonds. Such condiions are emphasized by two leading liquidity indicators, namely the turnover raio of bond transacions and bond trading volume. An assessment conducted in September 2009 indicated that the turnover raio of government bonds in Indonesia was just 0.16, far below that of Malaysia and Thailand, which achieved 0.61 and 0.74 respecively. Meanwhile, the turnover raio of corporate bonds in Indonesia was similar to that of Malaysia and Thailand (Chart 4.34). The trading volume indicator for the bond market also demonstrated
Chart 4.31 Credit to GDP Raio Chart 4.32 Stock Market Capitalizaion and JCI
Source: CEIC Data
Value of Market Capitalizaion (trillions of rupiah) JCI (index, point)
Chart 4.33 Bonds Outstanding to GDP Raio Chart 4.34 Bond Market Turn Over Raio in Asia
Source: CEIC Data
Government Bonds Corporate Bonds
Source: CEIC Data
imes
Government Bonds Corporate Bonds
relaively low liquidity (Chart 4.35) for both government bonds and private bonds.
Tight market liquidity also shaped the stock market, as relected by the raio of stock market capitalizaion to GDP. Based on observaions, liquidity on Indonesia’s stock market over the past three years was the lowest in the Asian region. The raio of stock market capitalizaion to GDP was sill below 50%, compared to Singapore and Malaysia that are in excess of 100%.
From observing the current portrait of inancial sector shallowness, eforts to deepen the inancial market in Indonesia are required constantly. A deep inancial market can atract more investors to place their funds in the inancial market, therefore yielding posiive impacts to economic inancing. This can be accomplished through the enrichment of investment instruments, such as long-term instruments, structured products and derivaive products that can be uilized as hedging instruments or insurance for inancial transacions. Financial market deepening can also be done to absorb excess liquidity in
to the economy and minimizing the risk of disrupion to inancial system stability that emanates from exchange rate volaility as well as luctuaions on the stock or bonds markets. However, to minimize the negaive impacts of inancial market deepening, microprudenial regulaions for inancial insituions must be applied.
Chart 4.35 Bond Market Trading Volume in Asia
Sumber: CEIC Data millions of USD
Government Bonds Corporate Bonds
9.3
60.1
98.0
370.9
20.5
0.4 4.3 1.3
4.5
Conclusion
The dynamics of the inancial market and banking sector in 2009 demonstrated that inancial system stability in Indonesia was maintained, supported by improving inancial market performance and strong domesic bank resilience. This relates to fundamental inancial system improvements that have taken place since the 1997/1998 inancial crisis as well as various policy measures to miigate the negaive impacts of the crisis on the domesic inancial system.
However, despite the relaively stable inancial system a number of challenges remained, including a shallow domesic inancial sector and the vast upsurge in foreign capital lows that have the potenial to create a inancial asset price bubble.
To overcome these issues, inancial deepening and inancial broadening are required. These eforts relate to the development of diversiied inancial market products that avail inancial instruments for short-term and
medium-term investment, hedging of inancial transacion using foreign exchange and risk distribuion.
be uilized for term inancing. In this case, the short-term money market can also support short-short-term liquidity management in the inancial system.
The development of these inancial products should be directed towards broadening access to inancing for business and the general public. Indonesia has a long history of providing special atenion to micro, small and medium enterprises. In this context, household paricipaion in the inancial sector should be encouraged through increased exposure to inancial products. This can be achieved by enhancing inancial educaion to the public regarding appropriate inancial products and the potenial risk that must be considered. Furthermore, inancial educaion will improve market discipline. Meanwhile, household paricipaion in the inancial system will improve the eicient allocaion of inancial resources in the economy.
The development of inancial products should be butressed by the implementaion of prudenial regulaions. Such regulaions should be designed to dissuade the uilizaion of speculaive products and those concerned with excessive proit taking behavior.
Furthermore, the need to anicipate inancial system development has necessitated sound macroprudenial surveillance and policy coordinaion regarding inancial
system regulaion and supervision (See Box: 4.1 Global inancial crisis and the structure of inancial sector supervision). To this end, the role of Bank Indonesia as a systemic regulator has become imperaive. This role is primarily associated with Bank Indonesia’s task of maintaining monetary stability and inancial system stability. Uilizing its role as systemic regulator, BI policies on inancial system stability will be more efectual. Meanwhile, an efecive crisis management protocol should be available to anicipate risk potenial in the inancial system.
Bank Indonesia implements banking policy based on the provision of incenives and disincenives in order to strike a balance in the intermediaion funcion while maintaining controlled risk condiions in the inancial
system.98 Incenives is aimed at loan extension, whereas
disincenives are instated to minimize excessive risk-taking behavior. Policy design that uses incenives and disincenives must consider the correlaion between macroeconomic, macroprudenial and microprudenial objecives. Such policy design is expected to reduce the procyclical behavior of banks, therefore, leading to a sound banking system that can contribute posiively to economic development.
Box 4.1
:
Global Financial Crisis and the Structure of Financial Sector Supervision
Since the onset of the global inancial crisis in 2008, many countries around the world again considered giving central banks a bigger role in maintaining inancial
system stability.1 This was based on the increasing
number of inancial insituions that had defaulted necessitaing prompt acions from the respecive governments and central banks to restore inancial system stability. Based on empirical experience from the United States, United Kingdom, Germany, South Korea and France; bank default was thought to be caused by weak implementaion of macroprudenial policy and inefecive coordinaion between the authoriies responsible for inancial sector regulaion and
supervision. Against this backdrop, central banks, which generally act as the lender of last resort (LOLR), were late in responding to the crisis situaion that required immediate acion. This exacerbated the recovery costs to the inancial sector.
World Financial Sector Supervision Map
A survey conducted by the IMF (2007)2 showed that
60%3 of respondents, primarily central banks, retained
1 In the late 90s, there was a major tendency to separate the banking supervision funcion from the central bank. One of the irst was Government of England that established the Financial Services Authority (FSA) in October 1997.
2 Survey was conducted involving 140 inancial sector regulatory and
supervision insituions in 103 countries worldwide from February to April 2007. The sample represented around 56% of IMF member countries and 91% of world GDP, as of World Bank Key Development Data & Staisics in June 2006. Around 68% of the respondents were from developing countries, whereas 32% were from developed countries.
3 A combinaion of respondents who stated that they supervised
the authority to perform the banking supervision funcion. Survey results also illustrated that only around 23% of respondents performed a consolidated supervision funcion of the enire inancial sector that includes banks, the capital market and other inancial insituions (Table 1). Meanwhile, most of the respondents (58%) acknowledged their independence when performing tasks, either as supervisors or
regulators.4 In terms of inancial sector supervisors
at a central bank, survey results showed that 80% of respondents could set regulaions independently.
Financial Sector Regulatory Structure: Empirical Experience from Several Countries
In general, the insistence to form an independent inancial supervisory insituion is more prevalent in countries beset by a relaively heavy and extended inancial crisis. In some cases, the decision to shit the supervisory role from one insituion to another can be emoional and is heavily inluenced by poliical pressures during a inancial crisis.
Unfavorable developments were experienced by South Korea. Ater the 1997/1998 Asian inancial crisis, the Government of South Korea decided to separate the banking supervisory funcion from the Bank of Korea (BoK), by forming the Financial Supervisory Services
banks, either unitary (31%), integrated (6%) or consolidated (23%). Around 7% of respondentd performed an integrated supervision funcion but did not supervise banks.
4 Independence is deined as impariality in the implementaions of policy instruments which are free from poliic and business player inluences.
No Type of Supervision Number of Respondents Percentage
1 Banking only (unitary supervisor) 44 31
2 Insurance only (unitary supervisor) 16 11
3 Securiies only (unitary supervisor) 25 18
4 Integrated (integrated supervisor) 18 13
5 Consolidated (consolidated supervisor) 32 23
6 Others 5 4
Table 1. Type of Financial Sector Supervision*
(FSS) in 1999. At the outset most of the employees and directors of FSS originated from work units in BoK that handled the banking supervisory funcion, however, over ime the low of informaion regarding banks and inancial condiions that could be accessed by BoK was restricted. This was because no work mechanism had been put in place to form a strong legal basis for BoK to access various informaion on banks and inancial insituions in South Korea.
Considering the various weaknesses that emerged ater the separaion of the supervisory funcion, BoK recently proposed that the Government amend the law giving authority to BoK to access informaion relaing to banks in South Korea. However, so far these eforts by BoK have not yielded a response from Parliament. The unresolved problems contributed to weak anicipaion by BoK and FSS in dealing with the 2008 global inancial crisis. During that period, BoK as a monetary authority could not obtain the informaion required in relaion to its funcion of maintaining inancial system stability and also in applying monetary policy, therefore, the inancial system in South Korea had to endure relaively widespread instability.
In addiion, weaknesses stemming from inancial sector authoriies in anicipaing and miigaing the risks inherent with a inancial sector failure in the U.S. were also experienced in countries such as UK, Germany and France. Developments in UK demonstrated a tendency to return the bank supervisory funcion to the Bank of England (BoE). During the 2008 global inancial crisis, BoE was deemed inept in performing its task of maintaining inancial system stability as it did not have the authority to supervise banks. To prevent a similar failure, the BoE will be provided with macroprudenial and microprudenial regulatory authority over all banks, building socieies (a form of Rural Bank), and other vital inancial insituions. The Financial Services Authority will presently be reassigned as the Consumer Protecion Agency.
This issue was based on the inability of the inancial authority in UK to anicipate potenial bank failure, which urged the Government to naionalize Northern Rock Bank and bail out Lloyds TSB and the Royal Bank of Scotland. This experience demonstrated that acion to wrestle the bank supervisory authority away from the central bank cannot guarantee inancial system stability.
Consequently, the strong correlaion between a central bank and the bank supervisory funcion was conformed by the governments of several countries. The funcion of a central bank as LOLR can only be opimally employed if the monetary authority has the power to directly access accurate and complete informaion relaing to the condiion of an individual bank or the banking industry in general. To this end, a central bank should have the authority for macroprudenial supervision (systemic supervision) and microprudenial supervision (supervising individual banks).
A similar case was reported in Germany. In May 2002, Germany formed a inancial services supervisory insituion (consolidated supervision), known as BaFin to supervise banks, securiies and insurance. However, during the 2008 crisis the Government of Germany commited to return bank supervision to the central
bank, the Bundesbank.5 To this end, three opions have
been considered. First, bank supervision becomes a separate department in the Bundesbank. Second, BaFin is part of the Bundesbank. Third, adopt the Twin Peaks model where the Bundesbank acts as prudenial
supervisor. 6
Latest update from France. On 21st January 2010, the
Prudenial Supervisory Authority (PSA) was established, tasked with supervising the banking and insurance industries. Legally PSA is a separate enity from the central bank, however, several regulaions have been designed to ensure a ight relaionship between PSA and Banque de France (B de F). The regulaions have underlined several salient issues: (i) all PSA employees are also employees of the central bank; (ii) PSA has an autonomous budget within the central bank’s budget, yet it is paid on an acivity basis for the evaluaion and supervision of the insituion it supervises; and (iii) the Governor of the Banque de France is also the Director of
the newly founded PSA. 7
In accordance with the trend of developed countries to return the bank supervisory funcion to the central bank,
5 See the aricle “German coaliion agrees Bundesbank to takeover bank supervision,“ Reuters, 8 October 2009.