This art icle was dow nloaded by: [ Universit as Dian Nuswant oro] , [ Ririh Dian Prat iw i SE Msi] On: 29 Sept em ber 2013, At : 21: 03
Publisher: Rout ledge
I nform a Lt d Regist ered in England and Wales Regist ered Num ber: 1072954 Regist ered office: Mort im er House, 37- 41 Mort im er St reet , London W1T 3JH, UK
Accounting and Business Research
Publicat ion det ails, including inst ruct ions f or aut hors and subscript ion inf ormat ion: ht t p: / / www. t andf online. com/ loi/ rabr20
Bankruptcy costs, leverage and multiple secured
creditors: The case of management buy
‐
outs
David Cit ron a & Mike Wright b
a
Cass Business School, 106 Bunhill Row, London, EC1Y 8TZ, UK Phone: +44 (0)207 040 8665 E-mail:
b
Cent re f or Management Buy‐out Research, Not t ingham Universit y Business School Published online: 04 Jan 2011.
To cite this article: David Cit ron & Mike Wright (2008) Bankrupt cy cost s, leverage and mult iple secured credit ors: The case of management buy‐out s, Account ing and Business Research, 38: 1, 71-89, DOI: 10. 1080/ 00014788. 2008. 9663320
To link to this article: ht t p: / / dx. doi. org/ 10. 1080/ 00014788. 2008. 9663320
PLEASE SCROLL DOWN FOR ARTI CLE
Taylor & Francis m akes every effort t o ensure t he accuracy of all t he inform at ion ( t he “ Cont ent ” ) cont ained in t he publicat ions on our plat form . How ever, Taylor & Francis, our agent s, and our licensors m ake no
represent at ions or warrant ies w hat soever as t o t he accuracy, com plet eness, or suit abilit y for any purpose of t he Cont ent . Any opinions and view s expressed in t his publicat ion are t he opinions and view s of t he aut hors, and are not t he view s of or endorsed by Taylor & Francis. The accuracy of t he Cont ent should not be relied upon and should be independent ly verified w it h prim ary sources of inform at ion. Taylor and Francis shall not be liable for any losses, act ions, claim s, proceedings, dem ands, cost s, expenses, dam ages, and ot her liabilit ies w hat soever or how soever caused arising direct ly or indirect ly in connect ion w it h, in relat ion t o or arising out of t he use of t he Cont ent .
This art icle m ay be used for research, t eaching, and privat e st udy purposes. Any subst ant ial or syst em at ic reproduct ion, redist ribut ion, reselling, loan, sub- licensing, syst em at ic supply, or dist ribut ion in any
1. Introduction
The efficiency of the bankruptcy process has been the subject of extensive debate among academics, practitioners and policymakers (e.g. Lightman, 1996; Chew et al., 2004). The study of bankruptcy costs is important because it sheds important light on the efficiency of the bankruptcy process (Ferris and Lawless, 2000; Franks and Sussman, 2005). There is increasing recognition of the need to con-sider different types of firms in this context since their heterogeneity may also be reflected in the na-ture of the distress process and its outcomes (Ferris and Lawless, 2000; Franks and Sussman, 2005; Bris et al., 2004). A number of studies, primarily focused on public corporations in the US and Canada, show substantial variation in the direct costs of distress, although several suggest that the administrative fees in Chapter 11 bankruptcies have been of the order of 7.5% of the liquidation value of the bankrupt firm’s assets (Ang et al., 1982; Weiss, 1990; Betker, 1997; Tashjian et al., 1996; Lubben, 2000; Fisher and Martel, 2001; Bris et al., 2004).
Andrade and Kaplan (1998) examine a sample of 31 formerly publicly listed corporations in the US that were taken private in highly leveraged transactions (HLTs) in which management ob-tained an equity interest and which subsequently became distressed. The costs of financial distress in these firms amounted to 10–23% of firm value. Betker (1997) finds that the ratio of direct costs of bankruptcy to assets for traditional Chapter 11 cases is lower if the firm is an HLT than for dis-tressed firms in general and suggests that this is because HLTs reduce creditor coordination prob-lems. Franks and Sussman (2005) provide detailed analysis of 542 small UK firms in bankruptcy and distress, concluding that the direct costs of bank-ruptcy appear to be relatively high, with a mean ranging between 24.3% and 42.4% (median 18.5% to 26.8%) of total bankruptcy proceeds. Franks and Sussman conclude that these costs are higher than those found by Thorburn (2000) for Sweden. This paper extends analysis by focusing on the costs of the bankruptcy process related to manage-ment buy-outs (MBOs). MBOs have higher failure rates than firms generally.1 They may provide a
Bankruptcy costs, leverage and multiple
secured creditors: the case of management
buy-outs
David Citron and Mike Wright*
Abstract—Using a unique, hand-collected final dataset of 57 management buy-outs in distress, this paper analy-ses the determinants of bankruptcy costs under the UK’s receivership regime. We show that the direct costs of re-ceivership consume a significant percentage of the rere-ceivership proceeds, with mean rere-ceivership costs equal to 30% of receivership proceeds. Importantly we find that while the average length of receivership was 3.0 years, 95% of repayments are made on average within 1.9 years. Our findings do not support the argument that multiple lenders create inefficiencies resulting in significantly lower secured creditor recovery rates. However, when there are mul-tiple secured lenders, the senior secured lender gains at the expense of other secured creditors. We find that re-ceivership costs are positively related to the proportion of secured debt repaid and that, consistent with the presence of a scale effect, the relative significance of receivership costs declines as firm size grows. Receiverships last longer the larger the amount of debt owed to the secured lenders.
Key words: bankruptcy; secured debt; financial distress costs; management buy-outs; private equity
*David Citron is at Cass Business School, London and Mike Wright is at the Centre for Management Buy-out Research, Nottingham University Business School. They gratefully ac-knowledge financial support from Barclays Private Equity and Deloitte. The paper has benefited from the comments of partic-ipants of seminars at Cranfield School of Management and Cass Business School. Thanks to Julian Franks, the editor, and an anonymous reviewer for comments on an earlier draft. They would also like to thank Rod Ball and Fred Rippington for their valuable research assistance. Correspondence should be ad-dressed to: Professor David Citron, Cass Business School, 106 Bunhill Row, London EC1Y 8TZ, UK. Tel: +44 (0)207 040 8665. E-mail: [email protected]
This paper was accepted for publication in November 2007.
1On the basis of data in www.berr.gov.uk/files/file/10698.pdf,
‘Companies in 2001–2002’, specifically Tables A1 and C2, which we adjusted for the number of dormant companies, we estimate the overall annual receivership rate of all active com-panies to be about 0.2% in 2000. On the basis of Centre for Management Buy-out Research (CMBOR) data, the percent-age of outstanding MBO/MBIs that failed in 2000 was 1.9% (104 receiverships divided by 5,474 non-exited deals). Since deals selected for buy-out are likely to be riskier than all ac-tive companies generally, because they are more likely to be underperforming and generally have higher leverage, a higher receivership rate is to be expected.
stronger test of the efficiency of the bankruptcy process for three main reasons. First, MBOs may help to shed light on the ‘lazy banking’ critique that over-secured creditors have little incentive to control the costs of the bankruptcy process (Manove et al., 2001; Franks and Sussman, 2005; Mokal, 2004). MBOs are typically highly lever-aged and their banks are less likely to be over-se-cured than with other firms since there may be greater reliance on stable cash flows than asset se-curity (Kaplan and Stein, 1993).2 Second, MBOs
shed light on the coordination costs in the distress process arising from the presence of more than one secured creditor and on whether senior secured lenders take advantage of other secured lenders. MBOs provide an interesting context in which to test hypotheses relating to the number of creditors since, unlike private firms generally in the UK (Franks and Sussman, 2005), many of them are fi-nanced by multiple lenders (Citron et al., 1997). MBOs will be more likely to involve multiple lenders since lenders will seek to spread the finan-cial risk from the higher leverage. An additional incentive for this lending structure is provided by the heightened operational risk of MBOs due to the fact that these entrepreneurs will not have prior owner-manager experience. Third, in contrast to Franks and Sussman (2005) MBOs may be more highly leveraged. Following Jensen (1989), de-fault should occur when more going concern value is preserved. Hence, it would be expected that MBOs will have lower costs of distress and more going concern sales when they enter distress than firms with lower leverage. A study of highly geared MBOs is particularly of current interest in view of the recent growth of highly leveraged pri-vate equity transactions. Regulators have high-lighted excessive leverage and the associated high risks of default as one of the most significant risks arising from these deals (FSA, 2006). This re-search provides early evidence of the scale and de-terminants of bankruptcy costs likely to be incurred when such defaults occur.
We study bankruptcy costs for a sample of MBOs in receivership. Three dimensions of bank-ruptcy costs are examined. First, we examine the impact on creditor recovery rates of potential coor-dination costs arising from the presence of multi-ple lenders. Second, we analyse bankruptcy costs in the form of fees paid to the receivers plus other direct receivership costs. Finally, we consider the length of the receivership, which Bris et al. (2004) argue is a good indicator of the efficiency of the process, suggesting in particular that indirect
bankruptcy costs, such as bankruptcy’s adverse impact in product and capital markets, increase with the time spent in bankruptcy.
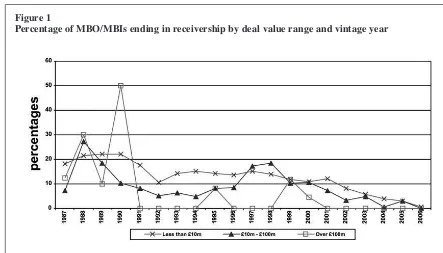
To address these issues, we survey the popula-tion of MBOs in the UK completed in the period 1990–1995 that subsequently went into financial distress. Given the pattern of failures of MBOs, es-pecially those in the cohort covered in this study (Figure 1), our sample companies generally in-volve smaller MBOs. We hand-collected a unique dataset specifically for this study from the records of the receivers involved in each case. The detailed nature of data collection has typically meant that sample sizes in studies of financial distress have been quite small, ranging from 11 (Warner, 1977) to 108 (Gilson, 1997) with a mean size of less than 50. An exception is the study by Franks and Sussman (2005) which used a sample of 542 firms. Accordingly, our main final set of 57 firms is in line with the majority of studies in this area.
We provide data on the receivership process and the financial characteristics of the firms in re-ceivership. Our main conclusions do not support the argument that multiple lenders create ineffi-ciencies resulting in significantly lower secured creditor recovery rates. However, an important new finding is that there is strong evidence that, when there are multiple secured lenders, the senior secured lender gains at the expense of other se-cured creditors. This finding extends previous re-search, showing that secured lenders take advantage of unsecured lenders. Our results also support the view that receivership costs do con-sume a significant percentage of the receivership proceeds. When trading costs incurred during the course of the receivership are excluded, mean di-rect receivership costs equal 30% of net receiver-ship proceeds for our final sample of 57 firms with cost data. Continuing trading costs themselves comprise 29% of gross receivership proceeds. Also, the receivership process can be long drawn out, with an average length of 3.0 years for these 57 firms, and is substantially longer than this in a significant minority of cases. However, the bulk of the receiver’s work of repaying secured debt is usually completed far earlier, with 95% of repay-ments being made on average within 1.9 years. In addition, we find some economic rationale for the level of receivers’ fees and for length of receiver-ship, although in common with both Ferris and Lawless (2000) and Bris et al. (2004) the cost find-ings vary depending on which measure of costs is used. With this caveat, we find that receivers’ fees are positively related to the proportion of secured debt repaid, and also have some evidence to sup-port the scale effect thesis that the relative signifi-cance of receivers’ fees declines as firm size grows. Regarding receivership length, receiver-ships last longer the larger the amount of debt
2Moir and Sudarsanam (2007) find that, in 1999, financial
loan covenants for borrowers in general were predominantly non-cash flow based, consistent with lenders placing less re-liance on cash flows for these borrowers.
owed to the secured lenders.
The rest of this paper is organised as follows. The next section sets out the institutional context. Section 3 sets out the previous literature and hy-pothesis development, and Section 4 the data and methodology. Descriptive statistics are set out in Section 5. Section 6 contains our main results, fol-lowed by our conclusions.
2. Institutional framework
This study focuses on administrative receivership.
The Insolvency Act 1986 in the UK introduced
court-administered procedures similar to Chapter 11 in the US. However, holders of floating charges, which are charges over assets that are changing in nature, such as stocks or work in progress, have the power to veto these procedures. Administrative receivership can be instigated only by a creditor whose security is held as a floating charge (Franks et al., 1996). Administrative receivers owe their main duty of care to the floating charge holder that appointed them; they have few obligations to oth-ers. A floating charge gives the holder powers of control but not priority in the disbursement of pro-ceeds; this is provided by holding a fixed charge (Armour and Frisby, 2001; Mokal, 2003).
Importantly, the administrative receiver has complete control over the firm. This power in-cludes the ability to liquidate the business without the permission of other creditors or the court. Fixed-charge holders, who are creditors who hold security over an identifiable corporate asset such as real estate and who have the right to realise their specific security in priority to any other claimants, can constrain the activities of the receiver. As a re-sult of the different powers attached to each
charge, creditors typically ensure that they hold both fixed and floating charges (Sterling and Wright, 1990).
3. Previous literature and hypothesis
development
Firms involved in MBO transactions are tradition-ally argued to have characteristics associated with incentive misalignment and poor monitoring prior to the buy-out, which results in significant agency costs (Jensen, 1986). High leverage in MBO trans-actions and its associated commitment to service the debt form a central part of the panoply of gov-ernance mechanisms aimed at reducing these agency costs, alongside managerial equity hold-ings and active private equity investors. There is a well-known agency cost involved in the provision of debt arising from potential conflicts of interest between equity holders and debt providers (Smith and Warner, 1979). These conflicts give rise to the need for lenders to monitor management, a re-quirement that extends to monitoring the adminis-trative receivers who are in effect the management during any insolvency process (Armour and Frisby, 2001). A number of factors will affect the efficiency of this monitoring process, key among which is the number of secured creditors. The presence of multiple secured creditors will give rise to coordination problems, both before and after the firm enters insolvency. However monitor-ing efficiency can be improved either by there being only one secured creditor or, if there are multiple secured creditors, by concentrating con-trol in the hands of a main creditor. On the other hand a single creditor, if over-secured, could result in poor control over bankruptcy costs, although the
Figure 1
Percentage of MBO/MBIs ending in receivership by deal value range and vintage year
creditor’s desire to preserve its reputation may counter-balance this. Company size is a further variable to be taken into account as, thanks to scale effects, receiverships are likely to be more effi-cient the larger the firm.
The following sub-sections relate these issues to three dimensions of bankruptcy costs – the extent of inefficiency in secured debt recovery rates, the determinants of receivers’ fees, and the length of the receivership process.
3.1. Number of secured creditors and recovery rates
The cost and efficiency of the receivership process may be affected by the number of secured creditors. Monitoring may be influenced by the number of secured creditors that are present in a particular deal (Bolton and Scharfstein, 1996; Dennis and Mullineaux, 2000). The presence of multiple creditors exacerbates information costs and may result in collective under-investment in information-gathering. In conditions of financial distress, difficulties in getting agreement among multiple secured creditors to sell may increase the sale price required to persuade them to sell. However, this may be more than offset by the un-willingness of potential bidders to sink the costs of becoming informed about the firm’s assets. The greater the number of lenders in a loan syndicate, the greater the potential conflicts of interest among claim-holders (Wruck, 1990), the greater the rene-gotiation costs associated with default (Smith, 1993) and the less likely private renegotiation of financial distress is to be successful (Gilson et al., 1990). Lee and Mullineaux (2004) find, using evi-dence from listed corporations, that syndicates are small and more concentrated when there is little information about the borrower, when the credit risk is relatively high and when the loan is secured, so that syndicates tend to be structured to enhance monitoring efforts and to facilitate renegotiation in distress.
Multiple creditors
MBOs offer a particularly interesting context to examine the impact of multiple secured creditors on the efficiency of the bankruptcy process since they are more likely than other private firms to have multiple secured lenders. Jensen (1989) sug-gests that because in MBOs lenders often hold claims across seniority classes, the coordination of multiple creditors may be reduced as compared to non-buy-out cases, although this benefit may be lower where public high yield debt is used (Kaplan and Stein, 1993; Betker, 1997).
Where the presence of multiple secured lenders to an MBO takes the form of a syndicate all pri-mary contacts with the client are generally chan-nelled through the lead (agent) bank so that
syndicate members have less influence on moni-toring (Citron et al., 1997). This may lead to sig-nificantly longer delays in implementing action than in single creditor lending to buy-outs (Citron et al., 1997). Such actions may also be less effec-tive as a result of these greater coordination costs. A multiplicity of secured creditors in buy-outs may, therefore, lead to delayed corrective action prior to receivership and adversely affect the con-duct of the receivership when it occurs compared to single creditor cases. Furthermore if different creditors have different and possibly conflicting priorities and objectives, the variety of pressures on the receivers and the accompanying coordina-tion problems may raise the costs of the bankrupt-cy process and also result in a lower overall rate of payout to the body of secured creditors.
Single creditors
Single secured creditors may avoid the coordina-tion and other costs associated with multiple lenders; thus they may be expected to lead to high-er recovhigh-ery rates and lowhigh-er bankruptcy costs. However, a single secured creditor may exercise poorer control of receivers’ fees provided the cred-itor obtains a reasonable repayment whereas the presence of more than one secured creditor may lead to more effective monitoring of receivership costs and also the eventual amount of debt repaid.
Main secured creditors
It is possible to alleviate some of the coordina-tion problems arising from multiple lenders through creditor concentration where the main creditor has the incentive to invest in monitoring and the power to enforce default and renegotiation (Diamond, 1984). This may lead to cheaper and quicker enforcement and hence increase expected returns to creditors. This main creditor role would typically be undertaken by a bank. However, as the main creditor bears a larger part of the total risk of a firm’s failure, the benefits of concentration may be outweighed by the costs, the larger the firm is. Administrative receivership in the UK can be seen as an efficient means of facilitating the bankruptcy process by a concentrated creditor (Armour and Frisby, 2001).
The role of the main secured creditor is especial-ly important because the various strips of secured debt finance in MBOs may be provided by differ-ent types of lender (Jensen, 1989; Wright et al., 1991). These strips may involve different priorities and charges over assets. The presence of multiple secured lenders may mean that an asset has more than one floating charge over it. Priority among equitable charges where the equities are otherwise equal follows the rule in Dearle v Hall and the first in time prevails (Farrar and Hanningan, 1998). Hence, in the event of bankruptcy, if there is a
shortfall in the proceeds from the sale of the asset, later creditors may not receive as great a repay-ment proportion as earlier ones. The main creditor is likely to be the creditor that holds the first charge over the assets.
We examine whether multiple lenders create in-efficiencies that result in significantly lower se-cured creditor recovery rates and control for other factors that are likely to affect these recovery rates. Where a firm may be operationally viable under new ownership, a going-concern sale is more like-ly and, in such cases, the receiver is expected to be able to make higher payments to secured creditors than where the assets are sold piecemeal. In addi-tion it is expected that repayments will be higher, the lower the proportion of inventories to total as-sets, since inventories tend to be firm-specific and relatively illiquid, and the less weak the MBO’s financial structure. Due to the greater restructuring complexities associated with larger MBOs, we ex-pect firm size to be negatively associated with secured creditor repayments. Finally, the greater liq-uidity of the market for corporate assets during times of economic growth suggests that repayments will be higher during economic upswings (Shleifer and Vishny, 1992; Franks and Torous, 1994).
3.2. Determinants of receivership costs
Previous bankruptcy cost studies have investi-gated the determinants of costs scaled by firms’ as-sets, claims and bankruptcy distributions (Ferris and Lawless, 2000; Bris et al., 2004). A number of studies that have found scale effects have been limited in terms of sample size and sector covered. Warner (1977) found evidence of a scale effect but this study was limited to only 11 firms in the rail-road industry. Guffey and Moore (1991) also found evidence of a scale effect in their study of the trucking industry, while Ang et al. (1982) find a scale effect in a sample of firms based on one ju-dicial district. In contrast, Weiss (1990) in a more comprehensive study of publicly traded corpora-tions found no evidence of a scale effect to bank-ruptcy costs.
Asset-based results are often considered less ro-bust, possibly because asset valuations are less re-liable (Ferris and Lawless, 2000: 9). This study looks at receivers’ fees both in total and scaled by three alternative size measures – (i) by the amount of secured debt due at the start of the receivership; (ii) by the net proceeds of the receivership defined as repayments to the secured creditors plus re-ceivership costs (a measure similar to that used by Franks and Sussman, 2005). Receivership costs comprise disbursements for receivers’ fees plus other direct receivership costs such as legal, agents’ and valuers’ fees. Salaries and other trad-ing expenses incurred by the receiver are ignored on the grounds that they are not strictly
incremen-tal; and (iii) by the gross proceeds of the receiver-ship which includes salaries and other trading costs, as the amounts involved are large and are likely to vary depending on the manner in which the receivership is managed. The first scaled meas-ure is used as an indicator of the size of the task facing the receiver (an ‘input’ measure) and the latter two as measures of the results of the re-ceivership (an ‘output’ measure).
Mode of sale
Fees are expected to be related to the mode by which the receiver is able to dispose of the compa-ny. Asset fire sales may depress the price at which assets are sold (Pulvino, 1998; Stromberg, 2000). LoPucki (1983) suggests lower prices from piece-meal disposals as firms that reorganise rather than liquidate lead to greater repayment of debt. Selling firms as going concerns may generate higher prices. Going-concern sales may take place quick-ly, so associated costs should be lower. However, disposing of a firm that has entered receivership may require the expenditure of effort to repackage the firm to enable it to be sold as a going concern. Further significant costs may then be involved in searching for and agreeing a price with a purchas-er who is convinced that the firm is indeed viable. In contrast, selling assets piecemeal may be less problematical in the presence of active markets for assets.
Firm size
Fees are expected to be higher the larger the MBO. Larger MBOs are likely to be more com-plex, so resulting in higher fees. However, as firm size grows, scaled fees are expected to fall due to efficiencies in the conduct of larger receiverships and possibly the presence of fixed cost elements in the make-up of receivers’ fees. This is the ‘scale effect’ hypothesis for which there is only limited evidence in previous research (Ferris and Lawless, 2000, and previous studies cited in their note 76).
Number of secured creditors
In the previous section we discussed how a multi-plicity of secured creditors could adversely affect the costs of the receivership. However, in a market involving repeated transactions between a limited number of players, reputation is important (Black and Gilson, 1998). Lead members of lending syndicates, as agents for the other members, may be under greater pressure to act efficiently in order to maintain their reputation (Chemmanur and Fulghieri, 1994). Failure to do so may make it diffi-cult to attract syndicate members in subsequent transactions. Hence, receivership fees may not be significantly higher with multiple secured creditors.
Type of receiver
More expert receivers with greater reputations,
such as members of major international account-ing firms,3 may be able to conduct the process
more efficiently and so charge lower fees, both in total and on a scaled basis.
Length of receivership
Receivers’ fees (the main component of re-ceivership costs – see Table 3) are often time-based (Lightman, 1996). In addition other direct receivership costs may be expected to mount up as a receivership continues. In support of this, Bris et al. (2004), Franks and Sussman (2005) and Thorburn (2000) find a link between time spent in bankruptcy and cost of bankruptcy.4 Therefore a
positive relation is expected between fees and length of receivership.
State of the economy
The liquidity of markets for corporate assets will be reduced in times of recession (Shleifer and Vishny, 1992; Franks and Torous, 1994). Both the cash flow and the number of potential industry buyers will be lower, so that more effort will be re-quired on the part of the receiver to achieve an asset realisation price close to their value in best use. As a result we expect receivership costs to be higher in times of recession.
Proportion of secured debt repaid
The lazy banking hypothesis implies that credi-tor banks fail to adequately control bankruptcy costs. This will especially be the case when banks are over-secured as they will then expect to recov-er a high proportion, if not all, of their debt irre-spective of the level of costs incurred. This view is in line with Franks and Sussman’s (2005) conclu-sion that the relatively high direct costs of bank-ruptcy in the UK are consistent with the lazy banking thesis that banks have little incentive to control costs once their own liquidation rights have been secured. We investigate this thesis for our sample of highly leveraged MBO firms with which banks are less likely to be over-secured. For such firms, therefore, we expect the banks to be in-centivised to control receivership costs. This effi-ciency argument implies that costs are not excessive but are based to some degree on the ef-fectiveness of the receivership and that there should therefore be a positive relation between costs and the proportion of secured debt repaid.
3.3. Determinants of length of receivership
We have the following expectations regarding the determinants of receivership length.
Mode of sale
The length of receivership is expected to be re-lated to the mode by which the receiver is able to dispose of the company. Going-concern sales may take place more quickly. However, repackaging a firm so that it can be sold as a going concern and identifying a suitable purchaser is likely to be more time-consuming than selling assets piece-meal where there are active markets for assets.
Number of secured creditors
As with receivers’ fees above, coordination problems with more than one secured creditor may be expected to lead to longer receiverships. On the other hand, if multiple creditors are able to exer-cise more effective control, then they may be asso-ciated with shorter receiverships.
Proportion of secured debt repaid
If longer receiverships are associated with greater inefficiencies and complexities, then they will also be associated with lower rates of secured debt repayments.
Amount of secured debt due at start of receivership
Bris et al. (2004) provide weak evidence that larger bankruptcies take longer to complete. We therefore expect that the greater the amount of debt due at the outset of the receivership, the longer the receivership is expected to last.
State of the economy
It is expected that the liquidity of markets for corporate assets is likely to be reduced in times of recession (Shleifer and Vishny, 1992; Franks and Torous, 1994), thus making it harder for receivers to realise assets at prices they would like to achieve. Due to these difficulties characteristic of recessions, receiverships commencing during peri-ods of economic downturn are expected to take longer to complete.
4. Data and methodology
The study involved the compilation of a novel dataset of MBOs completed in the period 1990 and 1995 that had subsequently entered receivership. This period was selected as it allowed sufficient time for failures to emerge and for the completion of the receivership process in a significant propor-tion of cases. The Centre for Management Buy-out Research (CMBOR) database was used to identify the cohort of buy-outs. The CMBOR database is compiled from a wide range of sources including twice-yearly surveys of private equity and debt providers to buy-outs,5press releases by these
fin-3At the time of our study, this group involved the Big Six
firms but this has now been reduced to the Big Four.
4However, Ferris and Lawless (2000) find only a weak
pos-itive relation in the US between time in reorganisation and bankruptcy costs.
5These surveys generally obtain a 100% response rate from
all the financiers active in the buy-out market as they receive a free copy of a quarterly review of aggregate market trends based on the data they supply which is recognised as the lead-ing source of information in the market.
anciers, the financial press, stock exchange circu-lars issued by companies divesting subsidiaries as MBOs and companies’ annual reports. The data-base has no lower size cut-off and is unique in ef-fectively representing the universe of buy-outs in the UK. Data on failures of buy-outs and buy-ins are collected by CMBOR from its regular surveys of participants in the buy-out market, Companies House returns and Extel, monitoring of the finan-cial press and the London Gazette.
From Companies House we obtained microfich-es for 226 of the 402 MBO receivership casmicrofich-es identified on the CMBOR database. The total of 402 receiverships represents 11.7% of the 3,436 buy-outs identified by CMBOR in this period.6Of
these, 161 were found to be unsuitable for analysis for a number of reasons such as lack of data on ap-pointment of the receiver or absence of receivers’ receipts and payments accounts; receiver appoint-ed very recently; some cases of voluntary liquida-tions; problems with establishing correct company identity; or the receivership was still continuing at the time our analysis was undertaken and it was likely that further amounts would be realised for the secured creditors. We therefore identified 65 cases where the receivership process was complete but of this total, cost of receivership data were not available for eight firms. The detailed direct cost analysis in this paper, therefore, relates to the re-maining 57 cases where the receivership process was complete, with the company having been struck off or, while technically continuing, the re-ceiver had filed the final receipts and payments ac-counts or the receivers informed us directly that the receivership was effectively complete.
Data on the number of secured creditors and the amounts owing to each are obtained from the di-rectors’ Statements of Affairs. All amounts due to secured creditors include accrued interest. The mode of sale of the MBO by the receivers and the identity of the receivers are obtained from the
re-ceivers’ report to the creditors. The amount of se-cured debt repaid by the receivers, the receivers’ fees and the on-going trading expenditures are de-termined from the receivers’ annual receipts and payments accounts. The value of the MBO at the date it is set up is taken from the CMBOR database or from the value of total assets less current liabil-ities from the first published balance sheet subse-quent to the MBO being established.
Accounting data from the MBOs’ published fi-nancial statements are available for only a subset of 42 cases in our population. Where more than one set of accounts is available, the last set prior to the appointment of the receivers is used.
5. Descriptive statistics
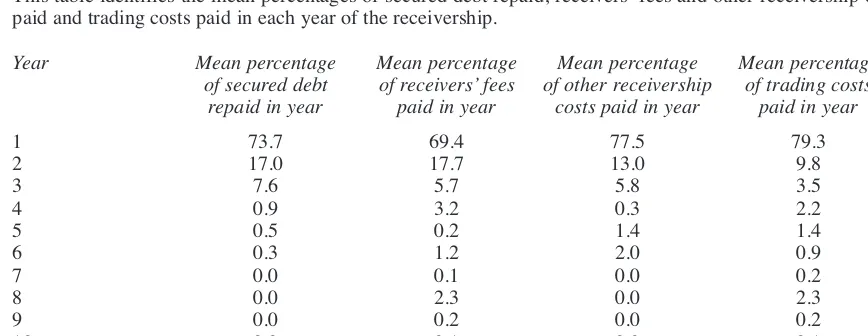
As shown in Table 1, the period until formal termi-nation of the receivership is no longer than three years in the majority (63%) of cases. In some cases, however, this period can be substantially longer and in 10% of our 65 cases it exceeds six years. Table 2 (which covers the 57 cases for which we have full data for our costs tests) shows, however, that very little significant activity occurs beyond year three in terms of secured debt repay-ment, payment of receivers’ fees and other direct receivership costs, or the incurring of trading costs by the receiver. By the end of the third year, on av-erage 98.3% of debt repayments have been made, 92.8% of fees and 96.3% of other receivership costs have been paid and 92.6% of trading costs have been disbursed. Due to the lack of apparent activity in the later formal years of lengthy re-ceiverships, in some tests we use an alternative in-dicator to measure the ‘effective’ length of the receiverships. This is deemed to be the year by which 95% of the secured debt repayments have been made. Table 1 shows that almost one-half of the 65 receiverships are effectively completed ac-cording to this measure during their first year, and 89.2% are completed in this sense by year three.
Direct receivership costs are evaluated both in relation to the amount of secured debt owing at the start of the receivership, which can be viewed as a measure of the size of the job facing the receivers at the outset, and in relation to receivership pro-ceeds, which is used as a measure of output from the receivership process. Receivership proceeds comprise payments to the secured creditors plus receivers’ fees and other direct receivership costs,7
with alternative measures either including (gross proceeds) or excluding (net proceeds) on-going trading expenditures, as explained in Section 3.2 above.8Receivers’ fees plus other direct
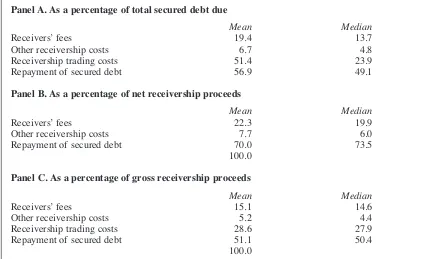
receiver-ship costs are equivalent to just over one-quarter of secured debt owing (Table 3, Panel A) and account on average for 30% of net receivership proceeds (Table 3, Panel B), which is within the range found by Franks and Sussman (2005).9After allowing for
6Some 26 of the buy-outs completed in this period involved
public to private transactions (0.8%), of which six had entered receivership by the end of 2006. See footnote 1 for details of overall receivership rates compared to overall MBO receiver-ships.
7Other receivership costs total £43,600 on average (median
£23,600), with legal fees accounting for 61.5% of these, agents’ and valuers’ fees 29.6% and receivers’ expenses, in-cluding advertising, 8.9%.
8Repayments to preferential creditors are not included due
to lack of reliable data. Franks and Sussman (2005) have these data for only part of their sample, and for these cases pay-ments to the preferential creditors amount on average to only 4.9% (median = 1.1%) of total proceeds. To this extent, there-fore, our measures of receivership costs to total proceeds may be overstated.
9Our finding of direct receivership costs comprising 30%
of net receivership proceeds (i.e. of liquidation value) con-trasts with only 19.1% reported on the same basis by Thorburn (2000) in Sweden where the regime is somewhat different.
receivership and other fees, secured debt repaid amounts to a mean of 70% of net proceeds. Other continuing trading disbursements are particularly high, accounting for a mean of 51.4% and a medi-an of 23.9% of total secured debt, with a memedi-an of 56.9% and a median of 49% of total secured debt being repaid (Table 3, Panel A). Continuing trad-ing disbursements also account for 28.6% of gross receivership proceeds, leaving approximately one-half of both the mean and median gross proceeds for the secured creditors (Table 3, Panel C). Illustrative examples of the nature of receivers’
on-going trading costs are shown in the Appendix. As shown in Table 4, which encompasses the companies with accounting data, the last accounts prior to entering receivership not surprisingly show these firms to have only a marginally posi-tive median return on assets (2%) and a median in-terest cover well below one (0.79). Ninety percent of assets are funded by liabilities, and liquidity is poor with a median acid test ratio value of only 0.68. Median fixed assets and debtors both account for about 30% of total assets and the median value of stocks to total assets is 21%. These assets could
Table 1
Length of receivership
This table identifies the number and percentage of companies where the receivership has been completed by year. We distinguish between actual and effective length of receivership. Effective length of receivership is de-fined as elapsed time by which 95% of secured debt is repaid.
Actual length of Effective length of
receivership receivership
No. of years No. of cases % of cases No. of cases % of cases
1 2 3.1 31 47.7
2 22 33.8 21 32.3
3 17 26.1 6 9.2
4 7 10.8 2 3.1
5 5 7.7 3 4.6
6 5 7.7 2 3.1
7 3 4.6 0 0.0
8 3 4.6 0 0.0
9 0 0.0 0 0.0
10 1 1.5 0 0.0
Total 65 100.0 65 100.0
Table 2
Receivership activity over period of receivership
This table identifies the mean percentages of secured debt repaid, receivers’ fees and other receivership costs paid and trading costs paid in each year of the receivership.
Year Mean percentage Mean percentage Mean percentage Mean percentage
of secured debt of receivers’ fees of other receivership of trading costs
repaid in year paid in year costs paid in year paid in year
1 73.7 69.4 77.5 79.3
2 17.0 17.7 13.0 9.8
3 7.6 5.7 5.8 3.5
4 0.9 3.2 0.3 2.2
5 0.5 0.2 1.4 1.4
6 0.3 1.2 2.0 0.9
7 0.0 0.1 0.0 0.2
8 0.0 2.3 0.0 2.3
9 0.0 0.2 0.0 0.2
10 0.0 0.1 0.0 0.1
N=57
potentially provide security for further borrowings by these firms, but it should be remembered that all the firms already have secured debt and data are not available on the proportion of free assets still available.
Table 5 provides additional descriptive statistics on the sample and indicates the distinctiveness of MBOs.10 Franks and Sussman (2005) show mean
recovery rates for their three banks ranging be-tween 73.8% and 76.7%. We have a much lower mean recovery rate at 57% (Table 5, Panel A). Also in contrast to Franks and Sussman who find that for one of their banks the median recovery rate is 100%, in only 14 (25%) of our cases do the
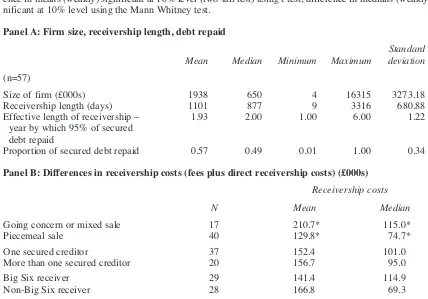
se-cured creditors get a 100% repayment, indicating that over-security does not seem to be widespread. Also 20 (35%) cases have more than one secured creditor, whereas Franks and Sussman’s compa-nies tend to have only the one ‘main’ bank. Over two thirds (70.2 %) of firms were sold piecemeal with the balance being sold either as a going con-cern (10 cases, 17.5%) or part going concon-cern and part piecemeal (7 cases, 12.3%). Scoring a partial going-concern sale as half, the overall rate of going-concern realisations is 24%, substantially lower than the 44% found by Franks and Sussman (2005). Median receivership costs in those firms sold piecemeal were significantly smaller (but only weakly so, at the 10% level) than for other forms of sale (Table 5, Panel B). The companies are evenly divided in terms of whether the receiv-er was part of a major intreceiv-ernational (Big Six) ac-counting firm.11
6. Results
6.1. Cost impact of number of secured creditors 6.1.1. Univariate analysis
We first investigate the identities of the secured creditors for the 57 cases with data availability. As
Table 3
Receivership costs
Panel A analyses the percentage of total secured debt due accounted for by receivers’ fees, other receivership costs, receivership trading costs and repayment of secured debt. Panel B analyses net receivership proceeds be-tween receivers’ fees, other receivership costs and secured debt repayments. Panel C analyses gross proceeds among receivers’ fees, other receivership costs, receivership trading costs and secured debt repayments.
Panel A. As a percentage of total secured debt due
Mean Median
Receivers’ fees 19.4 13.7
Other receivership costs 6.7 4.8
Receivership trading costs 51.4 23.9
Repayment of secured debt 56.9 49.1
Panel B. As a percentage of net receivership proceeds
Mean Median
Receivers’ fees 22.3 19.9
Other receivership costs 7.7 6.0
Repayment of secured debt 70.0 73.5
100.0
Panel C. As a percentage of gross receivership proceeds
Mean Median
Receivers’ fees 15.1 14.6
Other receivership costs 5.2 4.4
Receivership trading costs 28.6 27.9
Repayment of secured debt 51.1 50.4
100.0
N=57
10 The differences reported here between this study and
Franks and Sussman (2005) may also be due to this research including exclusively firms in receivership while only 55% of Franks and Sussman’s bankrupt firms entered receivership, with the remainder entering administration, CVA or winding-up (see their Table IV, p. 83). However Franks and Sussman also report that they have not identified significant differences in recovery rates between insolvency procedures, although they also point out that banks are unlikely to permit proce-dures other than receivership unless they expect them to gen-erate higher recovery rates.
11See explanation in footnote 3.
Table 4
Financial characteristics of the firms in receivership
This table presents data on means, median, minimum, maximum and standard deviation of financial variables used in the analysis. Sample size varies due to missing values of some variables.
N Mean Median Minimum Maximum Standard
deviation
Sales (£000s) 28 8945 4009 291 42201 10488.65
Total assets (£000s) 42 3612 1852 107 30212 5075.99
Operating profit/total assets 31 –0.02 0.02 –0.39 0.19 0.14
Interest cover 30 –2.80 0.79 –70.75 14.10 16.74
Total liabilities/total assets 42 0.92 0.90 0.47 2.19 0.32
Shareholders’ funds/total assets 42 0.08 0.10 –1.19 0.53 0.32
Current ratio 42 1.08 1.01 0.21 3.58 0.53
Acid test ratio 42 0.71 0.68 0.10 1.62 0.33
Fixed assets/total assets 42 0.34 0.29 0.00 0.88 0.23
Debtors/total assets 21 0.40 0.31 0.14 0.95 0.23
Stocks/total assets 42 0.21 0.21 0.00 0.69 0.17
Table 5
Descriptive statistics of variables associated with the receivership
Panel A in this table presents data on means, median, minimum, maximum and standard deviation of descrip-tive statistics associated with receivership. Size of firm is measured in Size of firm = value of MBO at date it was established or, if this not available, balance sheet value of total assets minus current liabilities. Panel B presents analysis of differences in mean and median receivership fees plus direct receivership costs according to mode of sale, number of secured creditors, size of receiver and amount of secured debt repaid. * = differ-ence in means (weakly) significant at 10% level (two-tail test) using t test; differdiffer-ence in medians (weakly) sig-nificant at 10% level using the Mann Whitney test.
Panel A: Firm size, receivership length, debt repaid
Standard
Mean Median Minimum Maximum deviation
(n=57)
Size of firm (£000s) 1938 650 4 16315 3273.18
Receivership length (days) 1101 877 9 3316 680.88
Effective length of receivership – 1.93 2.00 1.00 6.00 1.22
year by which 95% of secured debt repaid
Proportion of secured debt repaid 0.57 0.49 0.01 1.00 0.34
Panel B: Differences in receivership costs (fees plus direct receivership costs) (£000s)
Receivership costs
N Mean Median
Going concern or mixed sale 17 210.7* 115.0*
Piecemeal sale 40 129.8* 74.7*
One secured creditor 37 152.4 101.0
More than one secured creditor 20 156.7 95.0
Big Six receiver 29 141.4 114.9
Non-Big Six receiver 28 166.8 69.3
100% of secured debt repaid 14 174.2 95.4
Less than 100% of secured debt 43 147.3 100.4
repaid
already referred to in Table 5, 37 of these cases have a sole secured creditor. In the remaining 20 cases, the senior secured lender is identified. In 15 of these cases the creditor classified here as the senior secured lender was the first creditor to legally register its security and also the first ap-pointer of the receiver, and as such would be ex-pected to have priority in repayment. In a further three cases the first appointer of the receiver (which in none of the cases was one of the top six MBO lenders during the 1990 to 1995 period)12
had entered into an agreement with one of the most active MBO lending banks to give that bank repay-ment priority up to a specified sum in case of re-ceivership. In these three cases the bank benefiting from the priority agreement is classified here as the senior secured lender.13Finally, in the
remain-ing two cases the senior secured lender is identi-fied as a creditor holding a fixed charge over specific assets and to whom only a very small pro-portion (less than 2% in both cases) of the total outstanding secured debt is due. In both these cases the senior secured lender is one of the active MBO lenders, while the appointer of the receiver is not. In summary, the creditor classified here as the senior secured lender is either the first to
ap-point the receiver or one of the main MBO lending banks which has protected itself in case of re-ceivership either via a priority agreement with other secured creditors or, when the debt due is rel-atively small, by a fixed charge.
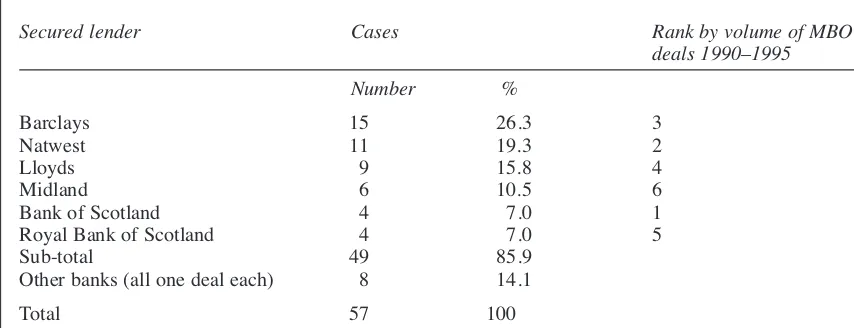
Table 6 shows the identities of the 57 main se-cured lenders, these being either the sole sese-cured creditor or the senior secured lender (as defined above) in multiple secured creditor cases. As can be seen in 49 (86%) of the 57 cases, the senior se-cured lender is one of the top six MBO lenders during the 1990 to 1995 period. There are a further 26 secured lenders (in addition to the main lender) in the 20 multiple creditor cases, among whom only one name appears more than once, and with only one appearance in this group by one of the top six MBO lenders. It is thus clear that the large banks and foremost MBO lenders are predomi-nantly either the sole or the senior secured lender to these MBOs.
As shown in Table 7, the mean repayment rate of 62% to sole secured creditors is, as expected, greater than the overall repayment rate of 48% in cases with more than one such creditor, a differ-ence that is weakly significant at the 10% level (t = 1.587, p = .060 one-tailed test). Although the overall repayment rate is lower in multiple secured creditor cases, the senior secured lender in these cases receives more (mean = 74%) than do single secured creditors (mean = 62%), although this dif-ference is not significant (t = –1.473, p = .147, two-tailed). There is also no significant difference between these groups on the basis of medians. Of particular interest, however, is the finding that in multiple creditor cases there is a highly significant
Table 6
Identities of main secured lender
This table compares the relative importance of different secured lenders among our sample of receivership cases with their rank in terms of all MBO deals completed. Rank of secured lenders by volume of deals done is based on authors’ database of the population of buy-outs in the UK during this period, where 1 = most deals done.
Secured lender Cases Rank by volume of MBO
deals 1990–1995
Number %
Barclays 15 26.3 3
Natwest 11 19.3 2
Lloyds 9 15.8 4
Midland 6 10.5 6
Bank of Scotland 4 7.0 1
Royal Bank of Scotland 4 7.0 5
Sub-total 49 85.9
Other banks (all one deal each) 8 14.1
Total 57 100.0
12This ranking is based on an analysis of 1,550 MBO deals
that took place during this period (CMBOR analysis).
13In one case, for example, the private equity backer which
had also provided debt appointed the receiver. The receivers’ report to the creditors states: ‘There is a priority agreement in force between the two debenture holders which ranks [Creditor A] ahead of [Creditor B, the private equity backer]. [Creditor A] have now been paid in full and there is an esti-mated deficiency to [Creditor B] of £156,711.’
difference between the mean 74% recovered by the senior secured lender and that received by the remaining secured creditors (mean = 32%) (t = 5.941, p = .000, one-tailed). This difference is even more marked and strongly significant when using median figures: 83% median recovery by the sen-ior secured lender compared with 18% median re-covery by the remaining secured creditors
6.1.2. Multivariate analysis
In Tables 8, 10, 11 and 12, we adopt OLS regrsion analysis. In Table 9 we undertake logistic es-timation. We conduct tests for the normality of standardised residuals using the Shapiro-Wilks and Kolmogorov-Smirnov tests.14
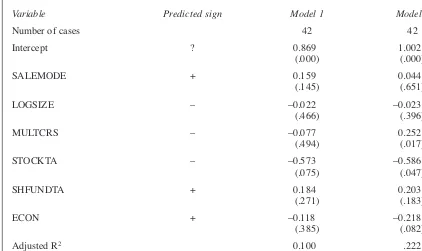
Table 8 examines the relationship between the number of secured creditors and amounts repaid to these creditors, both in total (model 1) and to the senior secured lender alone (model 2). These re-gressions are for the 42 cases for which accounting data are available. Although the overall regression is not significant, model 1 indicates that the num-ber of secured creditors has no impact on the over-all amount of secured debt repaid, and is therefore not shown to be a factor leading to greater
ineffi-ciency in the receivership process. However, going concern sales do marginally (one-tailed test) lead to higher repayments, as does a lower ratio of stocks to total assets.15 In contrast, model 2
con-firms that the percentage repayment to the senior secured lender is significantly larger in cases where there is more than one secured creditor. However, the mode of sale is of no effect although, contrary to expectations, there is some evidence that recoveries by the senior secured creditor are greater when the receiver is appointed in 1993 or earlier, a period of economic downturn. This may be because the senior creditor is more alert during times of recession and initiates receivership earlier so as to have a chance of achieving a greater re-covery. The main overall conclusion from these two models is, therefore, that in our sample of MBO receiverships the number of secured credi-tors does have a significant impact on the way in which the total proceeds are apportioned among the various secured creditors. When there is more than one secured creditor, the senior secured lender appears to achieve a significant priority, due to the stronger nature of their security, and even to some extent receives a higher rate of repayment than do single creditors. There is also weak evi-dence from model 1 that the number of secured creditors does not affect the overall efficiency of the process.
6.1.3 Determinants of number of secured creditors
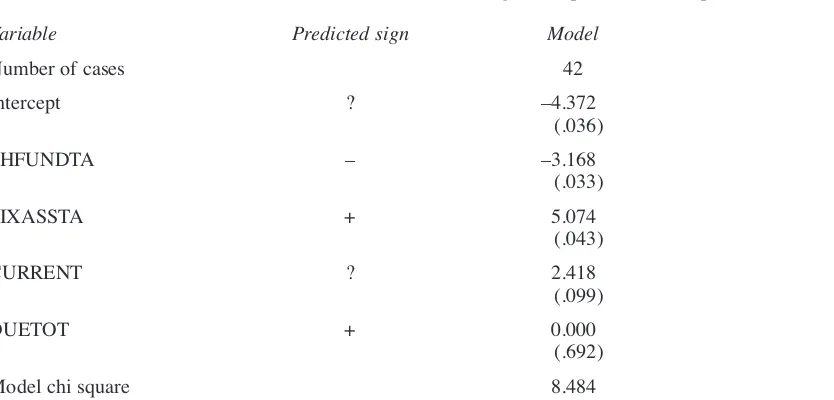
To gain a further understanding of the different repayment patterns for MBO receiverships with more than one as compared with only one secured creditor, a logistic analysis is performed to exam-ine the variables associated with the presence of more than one such creditor. As can be seen from
Table 7
Secured debt repayment rates
This table compares differences in secured debt repayment rates between single secured creditors and multiple secured creditors. Significant differences in means and medians are identified as: a = difference in means be-tween single secured creditor and all secured creditors in total significant at 0.10 level using t-test; b = differ-ence in means between main secured creditor and other secured creditors significant at 0.000 level; c = difference in medians between main secured creditor and other secured creditors significant at 0.001 using Wilcoxon signed ranks tests).
Proportion of secured debt repaid
Mean Median
In cases with a single secured .618a .69
creditor (n = 37)
In cases with more than one secured creditor (n = 20):
In total .479a .38
To main secured creditor .744b .83c
To other secured creditors .317b .18c
14Neither test indicates a problem with non-normally
dis-tributed residuals in the reported regressions, with the excep-tion of Table 10 model 2 and (marginally) Table 11 model 1 for which only the Kolmogorov-Smirnov test indicates no problems.
15 In addition, the mean recovery rate for ‘speedy’ going
concern realisations is compared with that for ‘slow’ going concern realisations to test for possible dissipation in value among ‘slow’ cases. The mean realisation rate for the eight cases completed faster than the median receivership length is 69.7%, compared with 63.7% for the nine cases taking longer than the median length, but this difference is not statistically significant (t = 0.346, p = .734 two-tailed test).
Table 9, the presence of more than one secured creditor is significantly associated with both heav-ier reliance on liabilities for funding (i.e. low ratio of shareholders’ funds to total assets) as well as with higher proportions of fixed assets to total as-sets. It seems, therefore, that MBOs seek secured lending from more than one source when they need to borrow a higher proportion of their total funding and they have substantial amounts of fixed assets against which they can offer appropriate se-curity to lenders.
6.2. Determinants of receivers’ fees and other receivership costs
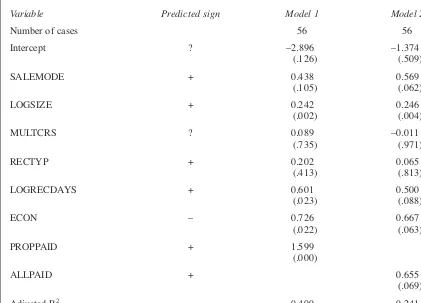
As shown in Table 10, there appears to be some economic rationale for total receivership costs. Costs, as measured by the log of total receivership costs, are significantly higher the greater the pro-portion of secured debt repaid. In cases where 100% of the secured debt is repaid there is weak evidence of an association with higher costs. These results are consistent with the efficiency
ar-gument that high costs do not come at the expense of secured creditor recoveries. In addition, higher receivership costs are significantly associated with larger MBOs and with longer receiverships, as measured by the log of receivership days, although only weakly so in model 2. There is also some weak evidence that the presence of a going con-cern element in asset realisations is associated with higher total cost levels. Contrary to expectations, however, receiverships commencing in the post-1993 economic growth period are significantly as-sociated with higher total cost levels.16
Table 8
Association between number of secured creditors and proportion of secured debt repaid
Dependent variable is proportion of secured debt repaid: In model 1: to all secured creditors. In model 2: to only the senior secured lender. SALEMODE = 1 if going concern or mixed sale; = 0 otherwise. LOGSIZE = natural log of value of MBO at date it was established or, if this not available, of balance sheet value of total assets minus current liabilities. MULTCRS = 1 if more than one secured creditor; = 0 otherwise. STOCKTA = stock/total assets in last balance sheet prior to receivership. SHFUNDTA = shareholders’ funds/total assets in last balance sheet prior to receivership. ECON = 1 if receiver appointed in 1994 or later; = 0 if appointed in 1993 or earlier. Figures in parentheses are p values.
Variable Predicted sign Model 1 Model 2
Number of cases 42 42
Intercept ? 0.869 1.002
(.000) (.000)
SALEMODE + 0.159 0.044
(.145) (.651)
LOGSIZE – –0.022 –0.023
(.466) (.396)
MULTCRS – –0.077 0.252
(.494) (.017)
STOCKTA – –0.573 –0.586
(.075) (.047)
SHFUNDTA + 0.184 0.203
(.271) (.183)
ECON + –0.118 –0.218
(.385) (.082)
Adjusted R2 0.100 .222
F 1.759 2.947
F (sig) 0.137 .020
Note: The highest correlation among the independent variables is –0.187 between MULTCRS and SHFUNDTA.
16As a robustness check the regressions in Table 10 are
re-run substituting the effective length of the receivership (the year by which 95% of the secure debt is repaid) for the actual length. Both regressions remain significant, with the coeffi-cients relating to proportion of secured debt repaid, size of MBO and going-concern asset realisations all retaining their significance. The coefficient on effective receivership length is significant only in model 1 (at the 5% level), indicating that not only actual but also effective receivership length has some association with higher receivership costs.
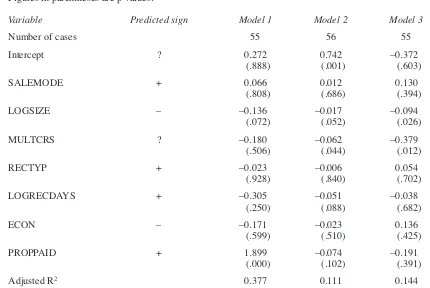
Regarding the scaled cost models presented in Table 11, there is strong evidence, particularly in model 3, for a scale effect, with the proportion of costs falling as firm size grows. In addition, as shown in model 1, receivership costs increase as a proportion of secured debt due, the greater the pro-portion of that debt repaid, providing further sup-port for the efficiency argument that where receivership costs constitute a higher proportion of the debt due this does not occur at the expense of the secured creditors.17Finally in models 2 and 3
the proportion of costs is significantly higher in cases of only one secured creditor as compared
with cases having more than one secured credi-tor.18
6.3. Determinants of length of receivership
Longer receiverships, as measured by the log of the number of days, are as expected associated with both a larger amount of secured debt owing and with receiverships commencing during the pre-1994 recession period (Table 12). Further in-vestigation reveals that this economic cycle result is entirely due to cases with piecemeal asset reali-sations. The ten pre-1994 recession period piece-meal realisation cases lasted over 80% longer than the subsequent 34 growth-period piecemeal re-ceiverships (mean length = 1,803.0 days versus 982.5 days, t = 2.777, p = .017). While the going-concern/mixed realisation receiverships com-mencing during the recession period also lasted longer than the growth period cases, the difference is not statistically significant (for the six pre-1994 cases mean length = 1,203.2 days versus 1,033.5 days for the 15 post-1993 cases, t = 0.620, p = .543). It appears that it is piecemeal asset sales that take significantly longer to achieve in times of re-cession, while the time required for going-concern realisations is unaffected by the economic cycle. This could be because, in a recession, the piece-meal realisation cases have been previously of-fered for sale on a going-concern basis, but this
Table 9
Variables associated with number of secured creditors
This table uses logistic regression to analyse the factors associated with the number of secured creditors. Dependent variable = 1 if more than one secured creditor, = 0 otherwise; SHFUNDTA = shareholders’ funds/total assets in last balance sheet prior to receivership; FIXASSTA = fixed assets/total assets in last balance sheet prior to receivership; CURRENT = current ratio in last balance sheet prior to receivership; DUETOT = total amount of debt due to the secured lenders. Figures in parentheses are p values.
Variable Predicted sign Model
Number of cases 42
Intercept ? –4.372
(.036)
SHFUNDTA – –3.168
(.033)
FIXASSTA + 5.074
(.043)
CURRENT ? 2.418
(.099)
DUETOT + 0.000
(.692)
Model chi square 8.484
Chi square sig. 0.075
Nagelkerke R2 0.254
Note: The highest correlation among the independent variables is –0.503 between FIXASSTA and CURRENT.
17The negative association, although not significant, with
proportion repaid in models 2 and 3 is likely to be a construct of the use of proceeds for scaling, as both costs and debt re-payments are used in the calculation of proceeds.
18A further regression (not reported here) is run to ascertain
whether on-going trading costs are greater in instances associ-ated with going concern asset realisations than where the re-ceiver is operating the business on a minimal basis with a view perhaps to only completing outstanding contracts. However, the sole variable associated with receivership trading costs (scaled by the total amount of secured debt due and then logged)) is the proportion of secured debt repaid. It would seem, therefore, that these trading costs do not detract from the amounts available to repay secured creditors but, to the con-trary, are associated with realising greater value from the re-ceivership so that proportionally higher repayments can be made to these creditors.
has proved difficult, so that by the time the assets are actually sold piecemeal a substantial amount of time has passed. Finally, Table 12 also shows a weak relationship between length of the receiver-ship and the presence of a single secured creditor.
7. Conclusions
In this paper we have used a unique, hand-collect-ed dataset of 65 MBOs in distress, producing a final sample of 57 firms, to analyse the efficiency of the bankruptcy process and in particular, the de-terminants of bankruptcy costs. The first dimen-sion of bankruptcy costs studied is the level of secured creditor recovery rates. In particular, ex-ploiting the fact that MBOs often have more than
one secured lender, we investigate whether the presence of multiple secured creditors has a nega-tive impact on recovery rates. Our findings do not support the argument that multiple lenders create inefficiencies resulting in significantly lower se-cured creditor recovery rates. However, when there are multiple secured lenders there is strong evi-dence that, thanks to its strong priority achieved via a variety of mechanisms, the senior secured lender gains at the expense of other secured credi-tors.
Secondly we examine direct receivership costs. Our results support the view that these costs con-sume a significant percentage of the receivership proceeds, with both mean and median receivership
Table 10
Variables associated with total receivership costs
This table uses OLS regression to examine the variables associated with total receivership costs (defined as ceivers’ fees plus other direct receivership costs). Dependent variable in both models is natural log of total re-ceivership costs. SALEMODE = 1 if going concern or mixed sale; = 0 otherwise. LOGSIZE = natural log of value of MBO at date it was established or, if this not available, of balance sheet value of total assets minus current liabilities. MULTCRS = 1 if more than one secured creditor; = 0 otherwise. RECTYPE = 1 if receiver not a Big Six firm; = 0 otherwise. LOGRECDAYS = natural log of length of receivership in days. ECON = 1 if receiver appointed in 1994 or later; = 0 if appointed in 1993 or earlier. PROPPAID = proportion of secured debt repaid by receivership. ALLPAID = 1 if 100% of secured debt repaid; = 0 otherwise. Figures in parenthe-ses are p values.
Variable Predicted sign Model 1 Model 2
Number of cases 56 56
Intercept ? –2.896 –1.374
(.126) (.509)
SALEMODE + 0.438 0.569
(.105) (.062)
LOGSIZE + 0.242 0.246
(.002) (.004)
MULTCRS ? 0.089 –0.011
(.735) (.971)
RECTYP + 0.202 0.065
(.413) (.813)
LOGRECDAYS + 0.601 0.500
(.023) (.088)
ECON – 0.726 0.667
(.022) (.063)
PROPPAID + 1.599
(.000)
ALLPAID + 0.655
(.069)
Adjusted R2 0.400 0.241
F 6.249 3.493
F (sig) 0.000 0.004
Note: The highest correlation among the independent variables is –0.299 between LOGRECDAYS and ECON.
costs equal to about 20% of total receivership pro-ceeds for our sample of 57 firms with cost data, while continuing trading costs consume a further 29% of total receivership proceeds. We find that direct receivership costs, both absolute and scaled by the amount of debt due, are positively related to the proportion of secured debt repaid, lending sup-port to the efficiency argument that secured credi-tor recoveries do not suffer at the expense of high receivership costs. This finding is consistent with the expectation that our sample of MBO firms, being highly leveraged, are unlikely to be over-se-cured, resulting in the lenders having relatively strong incentives to control bankruptcy costs. In addition, consistent with the scale hypothesis, we find that the relative level of receivers’ fees de-clines as firm size grows.
The final dimension of receivership costs inves-tigated is receivership length. We find that the av-erage length is 3.0 years and is substantially longer in a significant minority of cases. However, 95% of secured creditor repayments are made on aver-age within the substantially shorter period of 1.9 years, thus mitigating potential indirect costs brought about by excessively long receiverships. Finally, we find that receiverships last longer, the larger the amount of debt owed to the secured lenders, and when the receivership commences during economic recession, apparently due to the length of time needed to make piecemeal realisa-tions when the economy is weak.
Our findings complement and extend the de-bate concerning the nature of the bankruptcy regime in court-based versus contract-driven
sys-Table 11
Variables associated with scaled receivership costs
This table uses OLS regression to examine the variables associated with scaled receivership costs. Dependent variable in model 1 is the natural log of receivership costs scaled by total secured debt due; in model 2 receiver-ship costs scaled by gross receiverreceiver-ship proceeds (defined as repayments to secured creditors plus receiverreceiver-ship costs plus ongoing trading costs during the receivership); in model 3 the natural log of receivership costs scaled by net receivership proceeds (defined as repayments to secured creditors plus receivership costs). SALEMODE = 1 if going concern or mixed sale; = 0 otherwise. LOGSIZE = natural log of value of MBO at date it was es-tablished or, if this not available, of balance sheet value of total assets minus current liabilities. MULTCRS = 1 if more than one secured creditor; = 0 otherwise. RECTYPE = 1 if receiver not a Big Six firm; = 0 otherwise. LOGRECDAYS = the natural log of length of receivership in days. ECON = 1 if receiver appointed in 1994 or later; = 0 if appointed in 1993 or earlier. PROPPAID = proportion of secured debt repaid by receivership. Figures in parentheses are p values.
Variable Predicted sign Model 1 Model 2 Model 3
Number of cases 55 56 55
Intercept ? 0.272 0.742 –0.372
(.888) (.001) (.603)
SALEMODE + 0.066 0.012 0.130
(.808) (.686) (.394)
LOGSIZE – –0.136 –0.017 –0.094
(.072) (.052) (.026)
MULTCRS ? –0.180 –0.062 –0.379
(.506) (.044) (.012)
RECTYP + –0.023 –0.006 0.054
(.928) (.840) (.702)
LOGRECDAYS + –0.305 –0.051 –0.038
(.250) (.088) (.682)
ECON – –0.171 –0.023 0.136
(.599) (.510) (.425)
PROPPAID + 1.899 –0.074 –0.191
(.000) (.102) (.391)
Adjusted R2 0.377 0.111 0.144
F 5.659 1.981 2.299
F (sig) 0.000 0.077 0.042
tems (see, for example, Franks et al., 1996, and Davydenko and Franks, 2005). Jensen (1989) has argued for the efficacy of the latter over the for-mer, citing leveraged and MBOs as examples of such transactions. He argues that high leverage promotes closer monitoring of management and hence is likely to result in a speedier and more ef-ficient response when problems occur. US evi-dence relating to the court-based Chapter 11 process, suggests that the direct costs of bank-ruptcy are lower where the firm is a highly lever-aged transaction (Betker, 1997). There is evidence that banks lending to MBOs typically establish specialist departments to monitor these transactions which are recognised as requiring different skills in structuring and monitoring compared to other forms of corporate lending (Citron et al., 1997). However, high levels of leverage also increase financial risk and banks are less likely to be as over-secured as in private lending generally. This study has investigated those MBOs which, despite the presence of spe-cialised lender monitoring, nevertheless entered formal insolvency procedures. These cases, therefore, will have been the ones considered most difficult to reorganise. This is consistent
with our findings that, in comparison with Franks and Sussman’s (2005) more general population of small firms, these MBOs experienced fewer going-concern realisations in receivership, made a lower average repayment to secured creditors and made fewer 100% repayments to these cred-itors. These results also contrast with our expec-tations about buy-outs following Jensen (1989).
Our evidence relating to the influence of multi-ple creditors is particularly interesting. The finding that when there are multiple secured lenders, the senior secured lender gains at the expense of other secured creditors extends previous research that secured lenders gain at the expense of unsecured lenders. The finding that the presence of multiple secured creditors is associated with lower scaled receivership costs lends support to the view that multiple creditors either have a stronger incentive or more ability to exercise control over receivers’ fees than does a single creditor. We cannot exclude the possibility that since banks lending to MBOs tend to engage in repeat syndication with other MBO lenders, the desire to maintain reputation is an important influence on the behaviour of the par-ties concerned.
Our study suggests areas for further research.
Table 12
Variables associated with length of receivership
This table uses OLS regression to analyse the variables associated with length of receivership. Dependent vari-able is defined as the natural log of total length of receivership in days. SALEMODE = 1 if going concern or mixed sale; = 0 otherwise. MULTCRS = 1 if more than one secured creditor; = 0 otherwise. PROPPAID = pro-portion of secured debt repaid by receivership. LOGDUE is the natural log of total secured debt repayable. ECON = 1 if receiver appointed in 1994 or later; = 0 if appointed in 1993 or earlier. Figures in parentheses are p values.
Variable Predicted sign
Number of cases 64
Intercept ? 6.011
(.000)
SALEMODE ? –0.133
(.281)
MULTCRS ? –0.229
(.070)
PROPPAID – 0.117
(.520)
LOGDUE + 0.202
(.000)
ECON – –0.442
(.001)
Adjusted R2 0.308
F 6.596
F (sig) 0.000
Note: The highest correlation among the independent variables is –0.364 between PROPPAID and LOGDUE.