E-ISSN: 2347-5129 P-ISSN: 2394-0506
(ICV-Poland) Impact Value: 5.62 (GIF) Impact Factor: 0.549 IJFAS 2017; 5(2): 533-537 © 2017 IJFAS
www.fisheriesjournal.com Received: 10-01-2017 Accepted: 11-02-2017
Md. Shariful Islam
Scientific Officer, Bangladesh Fisheries Research Institute, Brackishwater Station, Paikgacha Upazila, Khulna District, Bangladesh
Nilufa Begum
Senior Scientific Officer, Bangladesh Fisheries Research Institute, Brackishwater Station, Paikgacha Upazilla, Khulna District, Bangladesh
Syed Lutfor Rahman
Chief Scientific Officer, Bangladesh Fisheries Research Institute, Brackishwater Station, Paikgacha Upazilla, Khulna District, Bangladesh
Correspondence Md. Shariful Islam
Scientific Officer, Bangladesh Fisheries Research Institute, Brackishwater Station, Paikgacha Upazila, Khulna District, Bangladesh
Culture potentials of green back mullet,
Chelon
subviridis
(Parse) under different stocking densities in
south-western region of Bangladesh
Md. Shariful Islam, Nilufa Begum and Syed Lutfor Rahman
Abstract
The study was conducted to attempt to evaluate production potentials of green back mullet at on-station of Bangladesh Fisheries Research Institute (BFRI) Brackishwater Station Paikgacha, Khulna management in southern Bangladesh under different stocking densities. As a result, the mullets have high rates of growth, together with that they tolerate wide ranges of environmental parameters, makes them highly attractive for culture purposes. Fingerlings of Green Back Mullet (C. subviridis) were stocked at
the rate of 60000, 90000 and 120000/ha under treatment-1 (T1), treatment-2 (T2) and treatment-3 (T3) on 01 march 2015. The physico-chemical parameters of water viz. transparency, temperature, dissolved
oxygen; pH, salinity, alkalinity and ammonia-nitrogen etc. recorded during the study period were found within optimum range. On the basis of mean final weight attained under T1, T2 and T3 were 24.43±1, 23.4±1.70 and 18.87±0.70g, respectively. The highest growth was obtained in T1 and lowest in T3. The mean final weight showed significant difference (P<0.05) in T1 followed by T2 and T3, when ANOVA
was performed. The production as well as economic return obtained was very encouraging and culture would add an extra in such way that farmer especially in southern Bangladesh may get a chance to consume them readily than them to the market. So the present study was very important to know the proper stocking densities of the green back mullet to get the optimum production.
Keywords: Green back mullet, brackish water, stocking densities, culture, water quality, management, fish production, Bangladesh
1. Introduction
Green Back Mullet, Chelon subviridis have high rates of growth, together with that they
tolerate wide ranges of environmental parameters, makes them highly attractive for culture
purposes. Green back mullet, Chelon subviridis (Val. 1836) earlier known as Liza subviridis.
Thatis a brackish water mugilid fish which is distributed in tropical Indo-pacific region. It is a
euryhaline and eurythermal fish. This fish is locally known as parse/bata and commonly available in shallow coastal waters, estuaries and mangrove swamps of Bangladesh. The high quality of flesh, high economic value and wide temperature and salinity tolerance capacity
make this species popular for aquaculture in the intertidal ponds [1].
There are about 1.5 million ha brackish water ghers (large hydrological units protected by
embankment with provisions of controlled drainage and irrigation infrastructures connecting
with coastal rivers) in the southwest region of Bangladesh [2]. Brackish water aquaculture in
Bangladesh is mostly directed to traditional farming of brackish water shrimp, Penaeus
monodon with or without fin fishes. The culture practice of this fish in the coastal
impoundments (locally called ghers) of Bangladesh is getting much popularity. At present, the
farmers depend upon wild seed for stocking to their ghers.
Chelon subviridis has high demand in the national and international market. A lump sum
amount of this fish is naturally produced as a wild catch in the ghers .It is now imperative to
develop a suitable culture technology of this species to increase productivity of the ghers. But
no potential attempt has yet been taken in this regard. Long back, a few attempts were undertaken by Bangladesh Fisheries Research Institute and studies were conducted on the
production performance of this fish with shrimp [3-5] using mullet seed from wild source. Later
important fish. Realizing the importance of this fish, it has been priority to improve breeding and seed production and to
develop culture technology of green back mullet, C.
subviridis. Therefore, the present study, attempted to evaluate production potentials of green back mullet at on-station of
Bangladesh Fisheries Research Institute (BFRI)
Brackishwater Station Paikgacha, Khulna management in southern Bangladesh under different stocking densities.
2. Materials and Methods
2.1 Description of the study area and duration
The study was conducted in the pond complex of Bangladesh Fisheries Research Institute, Brackish water Station, Paikgacha Upazilla (22º35.3'N 89º20.2'E), Khulna district, Bangladesh. Pond management of green back mullet was conducted for a period of 5 months (March-July) with three trials (each with 150 days of culture) in 2015 in nine water. Water of the ponds will be treated with rotenone and dipterex, both @ 1.5 ppm to kill all unwanted animals. After removing all dead animals, ponds will be treated with dolomite @ 20 ppm. After five days of liming, water of the ponds will be fertilized with 25 ppm urea and 30 ppm TSP to enhance growth of plankton and waited for a week to allow the water becoming suitable for stocking.
2.3 Stocking of fish
After two weeks of fertilization, fingerlings of Green Back
Mullet (C. subviridis) were stocked at the rate of 60000,
90000 and 120000/ha under treatment-1 (T1), treatment-2 (T2) and treatment-3 (T3) on 01 march 2015. Before stocking the initial mean weights of the fingerlings were measured using sensitive balance (OHAUS Model CS-2000).
2.4 Feed supply
Fry of mullet will be fed with commercial quality feed (35%
protein) @ 15% of estimated fish biomass for the 1st 15 days.
The rate of feeding will be gradually reduced with the growth of fish and feed will be supplied @ 3% of fish biomass in the last month of culture. Growth of fishes will be checked fortnightly and feed will be adjusted. During the culture trial, in every month all the ponds were limed at the rate of 125 kg/ha to maintain pH and water qualities.
2.5 Growth measurement
The growths of fishes of all ponds were monitored fortnightly by using random sampling method. At least 50 fishes were sampled with the help of a cast net to measure the growth to assess the health status and for feed adjustment.
2.6 Water quality parameters
The pond environment parameters such as surface water temperature, water depth, transparency, dissolved oxygen and pH was measured weekly using a Celsius thermometer, a graduated pole, a secchi-disk a portable dissolved oxygen meter (HI 9142, Hanna Instruments, Portugal), Salinity by
2.8 Harvesting of fish
After five months of rearing, the fish were harvested by dewatering the ponds. During harvest, they were counted and individually weighted to assess survival, growth and
production. Specific growth rate was estimated as:
SGR (% bw/d) = [In (final weight)-In (initial weight]/culture period (days) x 100.
2.9 Data analysis
Comparison of treatment mean was carried out using one-way analysis of variance (ANOVA), followed by testing of
pair-wise differences using Duncan’s Multiple Range Test [7].
Significance was assigned at the 5% level (P>0.05). All
statistical analysis was done by using the SPSS (Statistical Package for Social Science) version-17.5.
3. Results and Discussion
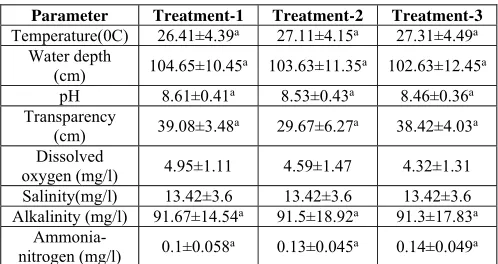
The physico-chemical parameters of water viz. transparency,
temperature, dissolved oxygen; pH, salinity, alkalinity and ammonia-nitrogen etc. recorded during the study period were found within optimum range. The mean values of water quality parameters in three treatments are presented in Table 1. The observed transparency ranged from 38 to 42 cm with mean values was 39.08±3.48, 29.67±6.27 and 38.42±4.03 in T1, T2 and T3, respectively (Table 1). The transparency of
water showed significant difference (P<0.05) among the
treatments, which might be due to variations in abundance of
plankton. According to Boyd [8] (1982) transparency values of
about 15-40 cm are appropriate for fish culture, which are strongly supported in this result. The mean depths recorded during the study period were 102.63 to 104.65 cm (Table 1). The mean water temperatures were 26.41±4.39, 27.11±4.15 and 27.31±4.49 ºC in T1, T2 and T3, respectively. However,
no significant (P>0.05) differences were recognized in their
water depth and temperature among the treatments which were within the suitable range for growth of fish in tropical ponds [9, 10].
Table 1: Mean value ± SD of water quality parameters of experimental ponds under three treatments.
Parameter Treatment-1 Treatment-2 Treatment-3 Temperature(0C) 26.41±4.39a 27.11±4.15a 27.31±4.49a
Water depth
oxygen (mg/l) 4.95±1.11 4.59±1.47 4.32±1.31 Salinity(mg/l) 13.42±3.6 13.42±3.6 13.42±3.6 Alkalinity (mg/l) 91.67±14.54a 91.5±18.92a 91.3±17.83a
Ammonia-nitrogen (mg/l) 0.1±0.058a 0.13±0.045a 0.14±0.049a *Figures in the same column with different superscripts are significantly different (P>0.05).
The mean values of pH were 8.61±0.41 in T1, 8.53±0.43 in T2 and 8.46±0.36 in T3, and there were no significant differences among the treatments (Table 1). The pH values of pond water under different treatments were found to be
than those obtained in T2 (4.59±1.47 mg/l) and T3 (4.32±1.31 mg/l) (Table 1). Comparatively lower level of dissolved oxygen as observed in the experimental ponds appeared to be related to sampling time where the dissolved oxygen was monitored at about 9.00-10.00 am. At this time, dissolved
oxygen remains lower in concentration. Rahman et al. [9] have
reported that dissolved oxygen content of a productive pond should be 5.00 mg/l or more. The values in present experiment were around 5.0.
Mean total alkalinity levels in T1, T2, T3, were 91.67±14.54, 91.5±18.92 and 91.3±17.83 mg/l, respectively. Total
alkalinity was significantly (P<0.05) highest in T1 followed
by T2 and lowest in T3 (Table 1). The variations in total alkalinity in all the treatments were within the productive
range for aquaculture ponds [12, 13]. Ammonia-nitrogen
contents in T1 (0.1±0.058), T2 (0.13±0.045), T3 (0.14±0.049 mg/l) showed increasing trends and T1 showed lowest level
and differed insignificantly (P<0.05) from T2, T3 (Table 1).
The amount of ammonia-nitrogen obtain in this study is
comparatively lower than the result reported by Dewan et al.
[14] and Kohinoor et al. [15]. However, the present level of
ammonia-nitrogen content in the experimental ponds is not lethal to the fishes [12].
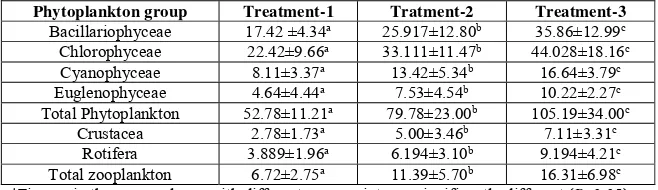
Table 2: Mean abundance of plankton (x103 cells/l) in pond waters under three treatments.
Phytoplankton group Treatment-1 Tratment-2 Treatment-3 Bacillariophyceae 17.42 ±4.34a 25.917±12.80b 35.86±12.99c
Chlorophyceae 22.42±9.66a 33.111±11.47b 44.028±18.16c
Cyanophyceae 8.11±3.37a 13.42±5.34b 16.64±3.79c
Euglenophyceae 4.64±4.44a 7.53±4.54b 10.22±2.27c
Total Phytoplankton 52.78±11.21a 79.78±23.00b 105.19±34.00c
Crustacea 2.78±1.73a 5.00±3.46b 7.11±3.31c
Rotifera 3.889±1.96a 6.194±3.10b 9.194±4.21c
Total zooplankton 6.72±2.75a 11.39±5.70b 16.31±6.98c
*Figures in the same column with different superscripts are significantly different (P>0.05).
The mean abundance of different groups of plankton is shown in Table 2. Phytoplankton population in this study mainly comprised four major groups- Chlorophyceae, Cyanophyceae, Bacillariophyceae, Euglenophyceae, and zooplankton had two groups- Crustacea and Rotifera. Among phytoplankton groups, Chlorophyceae was the most dominant group and Euglenophyceae was the least abundant group as observed during the study period. Among zooplankton, Rotifera was the most dominant in terms of both numbers and genera compared to Crustacean. Mean values of total phytoplankton
were 52.78±11.2; 79.78±23.00 and 105.19±34.00 X 10³ cells/l
in T1, T2, T3, respectively and showed significant (P<0.05)
difference among the treatments. The mean values of total zooplankton were 6.72±2.75, 11.39±5.70 and 16.31±6.98 X
103 cells/l, respectively and showed significant (P<0.05)
difference among the treatments. The plankton population in the study showed to be more or less similar with the findings
of Wahab et al. 12]. The highly abundant plankton population
in T3 than in T2 and T1 might be due to presence of excess uneaten feeds and the left over feed enhanced the production of plankton in the ponds.
Table 3: Growth performances of Green Back Mullet (C. subviridis) under three different stocking densities.
Treatment No
(stocking densities) Initial weight(g) Final weight (g)
SGR
(%per day) Survival (%)
Production
(kg/ha) FCR Treatment-1 (60,000/ha) 1.4±0.1a 24.43±1a 1.91±0.07a 90a 1319.51±58.27a 1.8± 0.23a
Treatment-2 (90,000/ha) 1.45±0.05a 23.4±1.7a 1.85±0.01a 86.03a 1735.28±83.12b 1.9±0.12a
Treatment-3 (120,000/ha) 1.47±0.04a 18.87±0.7b 1.7±0.02a 81.83b 1656.1±5.57c 2.2±.26b
*Figures in the same column with different superscripts are significantly different (P>0.05).
The growth rates of C. subviridis under different stocking
densities are shown in Table 3. On the basis of mean final weight attained under T1, T2 and T3 were 24.43±1, 23.4±1.70 and 18.87±0.70g, respectively. The highest growth was obtained in T1 and lowest in T3. The mean final weight
showed significant difference (P<0.05) in T1 followed by T2
and T3, when ANOVA was performed. The fortnightly
sampling weight of C. subviridis under different stocking
densities is shown in Figure 1 which indicates that the growth rate was always higher in T1 than T2 and T3. Higher growth rate was attained at lower stocking densities and vice versa
which has the similarity with the findings of some authors [16,
17].
Fig 1: The fortnightly sampling weight of C. subviridis under
The SGR (%) values were more or less same in all the treatments and which showed in significant difference among
the treatments. The survival rate of C. subviridis was found to
vary with the stocking densities. The highest survival (90%) was obtained in T1, where the density was 60,000/ha. and the lowest (81.83%) was obtained in T3, the density was 1, 20,000/ha (Table 3). The differences among the treatments
were found to be significant (P<0.05). The stocking densities
of mullets discussed by many workers are not helpful for comparison as they have been discussing based on polyculture systems wherein mullet formed one of the components. In the present study, on monoculture system, the stocking density
was followed from Yashouv previous work [18]. Where he had
experimented with in the case of M. cephalus under
monoculture systems in Israel was 50000/ha for Liza
vaigiensis and 20000 to 40000/ha for V. seheli in contrast to
the stocking density of 1850/ha. Chen [19] followed a stocking
density of 4000 to 10000/ha in the monoculture of M. cephalus. In the experiments in the brackishwater fish farm at Kakdwip, stocking densities of 12500, 20000 and 40000/ha
for M. parsia and 6000/ha for M. tade were employed in
monoculture system [20, 21]. Comparing these different
stocking densities, ours was on a much higher side, which may be the reason for the slower growth we have recorded in the present study.
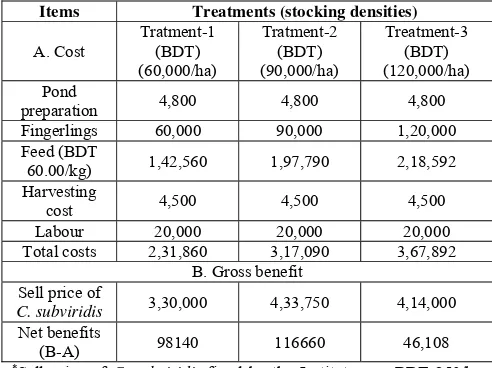
Table 4: Costs and benefits analyses of Green Back Mullet (C. subviridis) production in 1-ha earthen ponds for culture period of
150 days.
Items Treatments (stocking densities)
A. Cost Tratment-1 (BDT)
Fingerlings 60,000 90,000 1,20,000 Feed (BDT
60.00/kg) 1,42,560 1,97,790 2,18,592 Harvesting
cost 4,500 4,500 4,500
Labour 20,000 20,000 20,000
Total costs 2,31,860 3,17,090 3,67,892 B. Gross benefit
Sell price of
C. subviridis 3,30,000 4,33,750 4,14,000
Net benefits lower than and T3. A simple cost-benefit analysis is shown in Table 4. The cost of production was higher in T3 (BDT 3, 67,892/ha) and lower in T1 (2, 31,860/ha). The net profit generated from 150 days culture period was calculated as BDT 98140; 1, 16,660 and 46,108/ha for T1, T2 and T3, respectively. The highest net profit of BDT 1, 16,660 /ha was
obtained from T2 where C. subviridis stocked in 90,000/ha.
The calculated production of C. subviridis T1, T2 and T3
were 1319.51, 1735.28 and 1656.1 kg/ha and which showed in significant difference among the treatments. Productions of
recorded for M. parsia in monoculture system in the
brackishwater fish farm of CIFRI P [22]. Using of high quality
feeds may be the cause of much production in present study than previous study.
The growth, survival and production rates were lower in 1981-82 experiments was apparently due to the entry of Tilapia, perhaps in their very early stages, despite the filtering
of the water pumped into the ponds. Siddik & Khan [23] have
analyzed the cost and benefit of Monosex Tilapia (Oreochromis niloticus) monoculture system and got the net benefit of BDT 69.277.32/ha/6 months where fish were fed
formulated feed. Kohinoor et al. [24] got the net benefit BDT
32,919 to 42,291/ha/6 months in monoculture of Mystus
cavasius. In another study, Kohinoor et al. (1993) have found
that monoculture of rajpunti (Puntius gonionutus) gave a net
benefit BDT 68,135 to 75,028/ha/6 months. In the present study, the net benefit was higher than the above findings. The production as well as economic return obtained was very encouraging and culture would add an extra in such way that farmer especially in southern Bangladesh may get a chance to consume them readily than them to the market.
4. Conclusion
Green Back Mullet (C. subviridis) is an attractive and popular
species to the people of Bangladesh due to its delicious and nutritious food value. But due to different natural and man-made hazards the availability of green back mullet is in endangered condition. But so far there is no established culture technique of green back mullet in Bangladesh especially in the southern region of Bangladesh. There are many factors that affect the production of green back mullet. Stocking density is one of the most important factors for the production of green back mullet. So the present study was very important to know the proper stocking densities of the green back mullet to get the optimum production.
5. References
1. Nlewadim AA, Deekae SN. Collection of juvenile mullet
species from brackish water tidal farm in Nigeria. NAGA, ICLARM Quarterly. 1997; 20:19-20.
2. Anon. Compendium of fish fair (in Bengali). Department
of Fisheries, Ministry of Fisheries and Livestock, 2005.
3. Ali MS, Shofiquzzoha AFM, Ahmed SU. Observation on
the production performance of Penaeus monodon with
Liza parsia under different cropping system. Bangladesh J. Fish. Res. 2000; 4(2):141-145.
4. Shofiquzzoha AFM, Islam ML, Ahmed SU. Optimization
of stocking rates of shrimp (Penaeus monodon) with
brackish water finfish in a polyculture system. Online J.
Biol. Sci. 2001; 1(8):694-697.
5. Shofiquzzoha AFM, Islam ML, Ahmed SU. Effect of
farm made feeds on polyculture of shrimp (Penaeus
monodon) and three brackish water finfish species. Bangladesh J. Fish. Res. 2003; 7(1):77-82.
6. Clesceri LS, Greenbarg AE, Trussell RR. Standard
Methods for the Examination of Water and Wastewater. American Public Health Association, American Water Works Association and Water Pollution Control Federation. 18th Edn., 1015 Washington DC, USA. 1992, 10-203.
Elsevier Science Publisher, The Netherlands. 1982, 318.
9. Rahman MS, Chowdhur MY, Haque AKMA, Haq MS.
Limnological studies of four ponds. Bangladesh J. of Fish. 1982; 2(5):25-35.
10. Roy NC, Kohinoor AHM, Wahab MA, Thisted SH.
Evaluation of performance of carp-SIS Polyculture
technology in the rural farmer’s pond. Asian Fish. Sci.
2002; 15:41-50.
11. Swingle HS. Standardization of chemical analysis for
waters and pond mud. FAO. Fish. Res. 1969; 4:397-421.
12. Wahab MA, Ahmed ZF, Islam MA, Rahmatulla SM.
Effect of introduction of common carp, Cyprinus carpio
(L), of the pond ecology and growth of fish in polyculture. Aqua. Res. 1995; 26:619-628.
13. Kohinoor AHM, Islam ML, Wahab MA, Thilsted SH.
Effect of mola (Amblypharyngodon mola Ham.) on the
growth and production of carps in polyculture. Bangladesh J. of Fish. Res. 1998; 2:119-126.
14. Dewan S, Wahab MA, Beveridge MCM, Rahman MH,
Sarker BK. Food selection, electivity and dietary overlap among planktivorous Chinese and Indian major carp fry and fingerlings grown in extensively managed, rainfed ponds in Bangladesh. Aqua. & Fish. Man. 1991; 22:277-294.
15. Kohinoor AHM, Wahab MA, Islam ML, Thilsted SH.
Culture potentials of mola (Amblypharyngodon mola),
chela (Chela cachius) and punti (Puntius sophore) under
monoculture system. Bangladesh J. of Fish. Res. 2001; 5:123-134.
16. Islam MA, Chowdhury MY, Karim R. A comparative
study of some chemical factors and the growth of major carps in ponds. Bangladesh J. of Aqu. 1978; 1:66-73.
17. Kohinoor AHM, Islam AKMS, Jahan DA, Zaher M,
Hussain MG. Monoculture of climbing perch, Thai koi, Anabas testudineus (Bloch) under different stocking densities at on-farm. Bangladesh J. of Fish. Res. 2007; 11:173-180.
18. Yashouv A. Efficiency of mullet growth in fish ponds.
Bamidgeh. 1972; 24(1):12-25.
19. Chen TP. Aquaculture practices in Taiwan, Page Bros
(Norwich) Ltd. 1976.
20. FAO. Aquaculture Bulletin. 1974; 6(2-3):7.
21. FAO. Aquaculture Bulletin.1975; 7(3-4):4.
22. James PSBR, Gandhi V, Mohanra G, Raju A,
Rengaswamy VS. Monoculture of Grey Mullets in Coastal Saltwater Ponds at Mandapam 1995, 182.
23. Siddik MAB, Khan MMR. Over-wintering performance
of mixedsex and monosex tilapia (Oreochromis niloticus
L.) in Bangladesh. Bangladesh J. of Fish. Res. 2007; 11:153-162.
24. Kohinoor AHM, Momtaz B, Hussain, MG. Culture
potentials of gulsha (Mystus cavasius) in monoculture