Risk factors of low peak bone mass in Indonesian women
Faktor risiko massa tulang puncak rendah pada perempuan IndonesiaRay Sugianto1, Johana Titus1, Minarma Siagian2
ABSTRACT
Background: Osteoporosis occurred in 64% of Indonesian women aged 60-64 years. Risk of osteoporosis can be reduced by achieving optimal peak bone mass in ages 25-32 years. However, 33.4% women had low peak bone mass (LPBM). Objective: We aimed to develop a tool to identify women at risk of developing LPBM in order to ameliorate this situation. Some risk/protective factors were explored in a case-control study. Method: We recruited 25 cases, those with LPBM (T-score <1) according to peripheral bone densitometry and 25 controls from Cengkareng District, West Jakarta. They were assessed using questionnaires to explore their historical intake of calcium, tea/coffee, and weight-bearing activity. We also measured BMI and body composition. Parameters among case and control groups were analyzed using independent T-test or Mann-Whitney, and odds ratio in relation to peak bone mass was also computed. Results: Between cases and controls, there were no differences observed in BMI, body composition, weight-bearing activity, and historical tea/coffee consumption. Calcium intake from sources other than milk and its derivatives were also found not to differ. Historical calcium index (HCI), measuring weekly calcium intake since childhood, was found lower in cases (median=160 vs 965; p=0.001). HCI cut-off analysis found that the values of 300 and 1000 yielded good specifi city (80%) and sensitivity (92%) for LPBM. OR analysis identifi ed those with HCI <1000 (OR=0.61; 95% CI: 2.05−54.95)
as at moderate risk of developing LPBM, and HCI ≤ 300 as at higher risk. Conclusion: We concluded that, as low HCI was the risk factor for developing LPBM, calculation of HCI should be done to earlier identify women at risk, thus prompting earlier nutrition and life-style intervention to prevent the occurrence of LPBM and future osteoporosis.
KEY WORDS: women, peak bone mass, calcium intake, body composition, osteoporosis, prevention
ABSTRAK
Latar belakang: Osteoporosis ditemukan pada 64% perempuan Indonesia berusia 60-64 tahun. Risiko osteoporosis dapat diturunkan dengan mencapai massa tulang puncak yang optimal pada usia 25-32 tahun. Namun, 33,4% perempuan memiliki massa tulang puncak rendah (MTPR). Tujuan: Menyusun model identifi kasi perempuan yang berisiko mengalami MTPR untuk menurunkan kejadian osteoporosis. Faktor-faktor risiko dan protektif dari kejadian MTPR ditelusuri dalam studi kasus kontrol. Metode: Dilakukan pengambilan 25 subjek sebagai kasus dengan MTPR (T-score <-1) berdasarkan densitometri tulang perifer dan 25 kontrol di Cengkareng, Jakarta Barat. Subjek diwawancara menggunakan kuesioner untuk menelusuri riwayat asupan kalsium, konsumsi teh/kopi, dan aktivitas weight-bearing. Indeks massa tubuh (IMT) dan komposisi tubuh juga turut diperiksa. Karakteristik antara kasus dan kontrol dianalisis dengan independent t-test atau Mann-Whitney dan dilakukan perhitungan odds ratio terhadap massa tulang puncak. Hasil: Antara kasus dan kontrol tidak ditemukan perbedaan IMT, komposisi tubuh, aktivitas weight-bearing, dan riwayat konsumsi teh/kopi. Demikian juga tidak ditemukan adanya perbedaan asupan kalsium dari sumber selain susu dan produk turunannya. Indeks riwayat kalsium (IRK) yang menggambarkan asupan kalsium mingguan sejak anak-anak, ditemukan lebih rendah pada kelompok kasus (median=160 vs 965; p=0,001). Analisis nilai batas IRK menemukan nilai 300 dan 1.000 menghasilkan nilai spesifi sitas (80%) dan sensitivitas (92%) untuk kejadian MTPR. Mereka yang memiliki IRK<1.000 (OR=10,61; 95% CI:2,05-54,95) berisiko mengalami MTPR dan IRK ≤ 300 berisiko lebih tinggi. Simpulan: Nilai IRK rendah merupakan faktor risiko untuk kejadian MTPR, perhitungan IRK tersebut sebaiknya dilakukan untuk mengidentifi kasi perempuan yang berisiko sehingga sejak dini dapat dilakukan perbaikan nutrisi dan pola hidup untuk mencegah kejadian MTPR dan osteoporosis masa mendatang.
KATA KUNCI: perempuan, massa tulang puncak, asupan kalsium, komposisi tubuh, osteoporosis, pencegahan
1.Correspondence: Department of Nutrition, Faculty of Medicine, Universitas
Indonesia, Salemba Raya No.6, Jakarta 10430, Indonesia, e-mail: raysugi@ gmail.com
2. Department of Physiology, Faculty of Medicine, Universitas Indonesia, Salemba
Raya No.6, Jakarta 10430, Indonesia INTRODUCTION
Osteoporosis and osteopenia are the conditions of decreased bone density. People with osteoporosis have lower bone mass than individuals with the osteopenia.
Both have been shown to increase the risk of fractures in various age groups. A cross sectional study in 13 provinces of Indonesia found the prevalence of osteopenia and osteoporosis in Indonesia in 2005 in the age group 60-64 years was 13% and 57% in men and 21% and 64% in women (1).
Women were more vulnerable in developing osteoporosis or osteopenia because their peak bone mass is lower, had lower levels of physical activity, as well as a higher likelihood of restricting certain foods than men. One's peak bone mass is achieved by age 25-32. The bone mass is called a "peak" because it is the highest bone mass achieved in a person's lifetime. After that period, the bone mass will decrease physiologically (2). As a result, if someone had not reached optimal peak bone mass, then that person does not have the opportunity to further improve their bone mass after that period.
Research in Indonesia in 2005 found 40.6% of women aged 25-29 years had a low peak bone mass, an increase from 33.4% in 2002 (3). This fi gure not only shows that the risk of fracture of the problems we faced today, but also the problems that will arise in the next 20 years when the women entered menopause period. Insuffi cient calcium intake, their short duration, as well as the relationship between body composition, sports activities, and the consumption of tea or coffee with peak bone mass has not been widely studied. Therefore, this study was done to determine the risk factors of peak bone mass, particularly in Indonesian women.
MATERIAL AND METHOD
After obtaining ethical clearance from ethic committee of Faculty of Medicine Universitas Indonesia/ Cipto Mangunkusumo Hospital, a case-control study was done in the Cengkareng District of West Jakarta in May 2014. The sample size of this study was calculated in the range of 50-60 subjects, using Fleiss formula for unmatched case control studies with alpha of 0.05, power of 80%, and assumption 40% of control with risk factor present (4). The subjects were informed of this study by distribution of printed materials and by informing visitors of local administrative offi ce and government-run health care center.
The inclusion criterions used were: women willing to participate and signed informed consent; at the time of study the subjects’ age were 25-32 years old (period when peak bone mass were attained). The exclusion criterions were habit of smoking; use of antihypertensive, proton-pump inhibitor, and anti-seizure medications; history of gastrointestinal surgery; vegetarian/vegan dietary practice; and less than 45 minutes of sun exposure per week or the use of abaya/niqab (to exclude low vitamin D status) (5). Those satisfying the criterions were enrolled consecutively in this study, with a total of 74 subjects completed all the required study protocols. To satisfy the case control ratio of 1:1 (25 case and 25 control), a simple randomization were performed to ensure the number of subjects between groups matched.
The women were divided into case and control groups based on bone densitometry measurements at peripheral sites using ultrasound attenuation of calcaneus bones. The case group had a low peak bone mass (T-score <-1) and the control had a normal peak bone mass. The device used was Sahara Ultrasound Bone Densitometry
made by Hologic Corporation−Bedford, Massachusetts,
USA, with good sensitivity and specifi city (6) and also the same device as what was used in previous study conducted in 13 provinces (3). While the gold standard of bone mineral measurement is the use of dual X-ray absorptiometry, this quantitative ultrasound method refl ect the bone quality, could predict future fracture risk and ionizing radiation free (7). The subjects right foot calcaneus region were cleaned using water and paper wipes before applied with ultrasound gel as per the instrument manual. The procedure of subjects’ heel positioning and machine operation were conducted by technician trained in operating the machine. Each subjects were measured twice and the results are averaged.
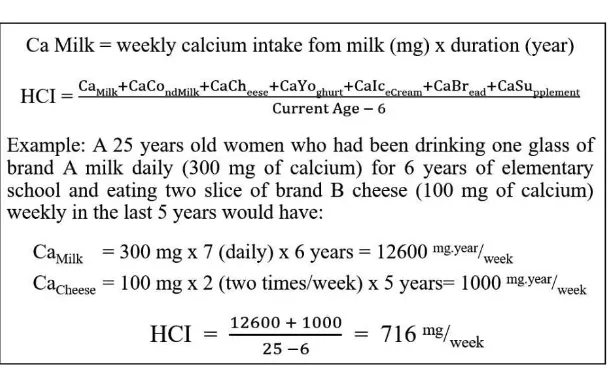
parameters were used to calculate historical calcium index (HCI) after standardizing them as calcium intake in mg per week from milk and its derivatives per year by dividing total calcium from those data by subjects’ age minus six. The six year deduction was used because the data from recall by subjects was thought to be unreliable if they were also asked of their habit when they were younger than six years old (Figure 1). We also taken into account the different brands consumed during the life course of subjects, since those brands accounts for difference of calcium contents. Historical tea and coffee consumptions were also assessed by similar means, albeit using slightly different approach (by using how many serving per month) (8).
A semi quantitative food frequency questionnaire (SQ-FFQ) to explore previous month dietary calcium intake were also used in broader food groups, to assess whether other than main source of calcium consumption was different between cases and controls. These subjects’ data were collected by physician trained in collecting dietary data, in order to minimize bias, the physician was blinded to the bone status of subjects.
Measurement of subjects’ height and weight were done using calibrated stadiometer and Omron HBF-514 scale. The height and weight data were used to calculate subjects’ body mass index (BMI) by dividing weight (in kilogram) with square of height (in meter). The subjects’ body composition were measured using Omron HBF-514 four extremities/eight electrode body impedance analyzer (9). The measurements were done twice by a well-trained
physician, and the results were then averaged. The data were acquired to explore the effects of body weight and body composition of fat and muscle on peak bone mass (10). Weight-bearing physical activity levels were assessed using questionnaires to determine current duration of daily activities with walking components and weight-bearing sports of subjects (11). Parameters among case and control groups were analyzed, variables with normal distribution using T-test of two independent groups, whereas variables with non-normal distribution were tested with Mann-Whitney test, odds ratio for the presence of risk factor in relation to peak bone mass status was also computed. A multi- or single-variable modeling to predict low peak bone mass occurrences was attempted with their cut-off analysis and its sensitivity specifi city values (12).
RESULTS
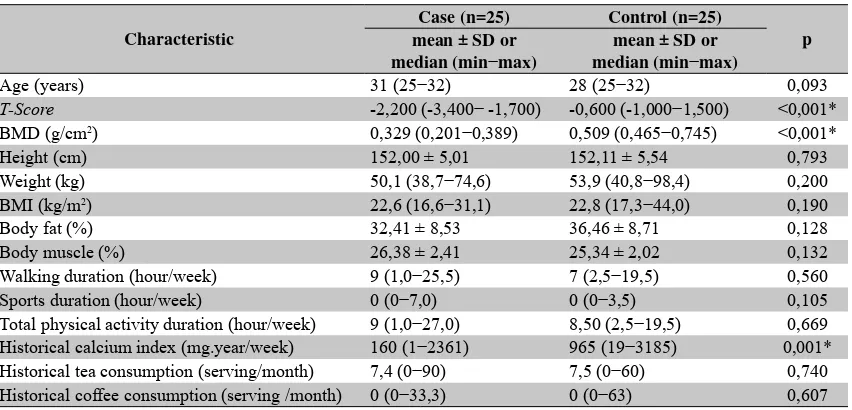
A total of 50 subjects completed all examination and interview. The characteristics of subjects belonging to case and control groups’ results can be seen in Table 1. The age and height of subjects were similar in both groups, while the bone mineral density (BMD) was different as expected, as it was the criteria of case and control classifi cation.
There are no observed differences in the mean of most of the study variables between cases and controls which were statistically signifi cant. An exception was found in the HCI, which was lower in cases compared to controls (median cases vs. controls: 160 vs. 965; p=0.001).
Table 1. Characteristics of cases and controls
Characteristic
Case (n=25) Control (n=25)
p mean ± SD or
median (min−max)
mean ± SD or median (min−max)
Age (years) 31 (25−32) 28 (25−32) 0,093
T-Score -2,200 (-3,400− -1,700) -0,600 (-1,000−1,500) <0,001* BMD (g/cm2) 0,329 (0,201−0,389) 0,509 (0,465−0,745) <0,001*
Height (cm) 152,00 ± 5,01 152,11 ± 5,54 0,793
Weight (kg) 50,1 (38,7−74,6) 53,9 (40,8−98,4) 0,200 BMI (kg/m2) 22,6 (16,6−31,1) 22,8 (17,3−44,0) 0,190
Body fat (%) 32,41 ± 8,53 36,46 ± 8,71 0,128
Body muscle (%) 26,38 ± 2,41 25,34 ± 2,02 0,132
Walking duration (hour/week) 9 (1,0−25,5) 7 (2,5−19,5) 0,560 Sports duration (hour/week) 0 (0−7,0) 0 (0−3,5) 0,105 Total physical activity duration (hour/week) 9 (1,0−27,0) 8,50 (2,5−19,5) 0,669 Historical calcium index (mg.year/week) 160 (1−2361) 965 (19−3185) 0,001* Historical tea consumption (serving/month) 7,4 (0−90) 7,5 (0−60) 0,740 Historical coffee consumption (serving /month) 0 (0−33,3) 0 (0−63) 0,607
* p <0.05; BMD: bone mineral density, BMI: body mass index
Figure 2. HCI components of cases and controls
All subjects were able to remember the historical habit of milk and its derivatives consumption since the age of six years. We also found no signifi cant difference in calcium intake data of other than main source of calcium consumption nonmilk and its derivatives products from FFQ between groups.
Among food groups assessed by HCI, cow's milk is a major contributor of calcium consumed daily (49.3% in
cases and 47.0% in controls) so that among subjects who did not consume milk, lower HCI is more likely to be found. Other contributors of HCI can be seen in Figure 2.
DISCUSSION
In the study, there were no differences in body composition and physical activity level between case and control. Mean BMI in the group of cases and controls were not different (cases vs. controls = 22.6 vs 22.8 kg/ m2; p=0.190). This is different from the meta-analysis
which showed that higher BMI was a protective factor against osteoporosis and hip fracture incidence, so the effect of BMI on bone mass of later age remains to be considered (13).
We also did not fi nd differences between cases and controls in measurements of body fat composition (32.41% vs. 36.46%; p=0.128) and body muscle composition (26.38% vs. 25.34%; p=0.132). However, both BMI and body composition results are not necessarily describe the condition of subjects in their childhood. Therefore, whether BMI and body composition are risk factors of low peak bone mass cannot be fully concluded.
This study also found there was no statistically signifi cant difference in the level of physical activity between cases and controls, whether using measurement of duration of walking per week, weight bearing exercise activities besides walking per week, and total physical activity per week (9 vs 8,5 hours/week; p=0.669). It shows that physical activity is not a factor associated with the level of peak bone mass of women. However, we should consider that physical activity data obtained in this study were the activity data at the time of when the research was conducted, which was not necessarily similar to the activity when the subjects are younger. This is in contrast to studies that conducted in North Sulawesi, Yogyakarta and West Java which found proportion of patients with osteoporosis who exercise regularly was lower than the
group with normal bone mass (18.3% vs. 25.8%; p<0.01), the results was observed using wider age range of 25-70 years, perhaps suggesting that positive effect of exercise on bone mass occurred after in a long-term period after peak bone mass period (3).
We also found no statistically signifi cant differences between cases and controls in the historical consumption of tea and coffee. This finding was consistent with studies showing that moderate consumption of tea and coffee (about 2-3 servings/day) only slightly increases the excretion of calcium in urine. These results are also in accordance with a systematic review which showed a decrease in bone density was observed only at excessive caffeine consumption (more than 744 mg/day, equivalent to 7-9 cups of coffee) (14). The negligible effect of coffee consumption on bone mass was also reported among
Korean women, which shows no signifi cant difference
of bone density among women who consumed one, two and three cups of coffee daily (adjusted OR=0.94 (95% CI: 0.70-1.26); 0.93 (0.67-1.28); and 1.02 (0.69-1.50), respectively (p for trend=0.927) (15). We conclude that reasonable consumption of tea or coffee (tea <3 servings/ day, coffee <2 servings/day, or a combination of both for <4 servings/day) since childhood, did not pose as a signifi cant risks of developing low peak bone mass.
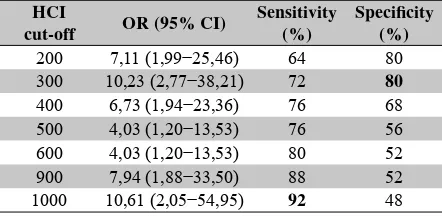
As HCI was the only variable found to be different in cases and controls, the HCI had been further analyzed to determine the effects of low historical calcium intake as a risk factor for developing low peak bone mass in women. Calculation of odds ratios at various cut-off values as well as sensitivity and specifi city resulted in HCI cut-off of 300 and 1000 as useful level to gauge someone’s risk. A person with HCI <1000 are considered at increased risk of low peak bone mass (OR=10.61; 95% CI: 2.05-54.95) compared to others with better HCI. Those cut-off values had a high sensitivity (92%) which can correctly detect almost all cases which were found to have low peak bone mass. However, the cut-off value of 1000 has poor specifi city (48%). Meanwhile, the cut-off value of 300 had an OR of 10.23 (95% CI: 2.77-38.21) with good specifi city (80%) or have the ability to detect the majority (80%) of women with normal peak bone mass. This fi nding was in line with several research that support the focus of recommending intake of main source
of calcium, namely milk and its derivatives to attain optimal peak bone mass in women. The large proportion of milk consumption of HCI in this study refl ect the importance of milk in fulfi lling dietary requirements of calcium. The effect of milk avoidance could be observed even in childhood period. New Zealand children who avoid milk were having shorter (p<0.01), had smaller skeletons (p<0.01) and had a lower total-body mineral content (p<0.01) compared to their milk consuming peers (16). A similar fi nding was found in Indiana, where childhood and adolescent intake of milk was correlated with total body, radius and spine bone mineral density of young women (17).
CONCLUSION AND RECOMMENDATION
Calcium intake during childhood and adolescence period, which infl uence the peak bone mass in women, can be easily and quickly calculated by using HCI. Historical calcium index values can be used to determine whether a woman has a risk of low peak bone mass or not. We could said that those with HCI value <300 to have a high risk of low peak bone mass, HCI of 300-999 as having moderate risk, and those with HCI >1000 could be considered to have little risk. The HCI value of <1000 clearly indicates that the person had more risk, prompting a need of comprehensive lifestyle and nutritional modifi cation as an effort to prevent low peak bone mass occurrence, and ideally the bone mass of those high risk individuals should be evaluated regularly.
As we now know that the main determinant or risk factors of low peak bone mass was known to be related to calcium consumption in childhood and early adulthood period, especially in the form of milk and its derivatives consumption, and that HCI can be used to determine those at risk, we recommend the HCI calculation as a tool to identify women at high risk or increased risk of having low peak bone mass. HCI can also be used to simplify the acquisition of data regarding historical calcium intake of an individual. Those with HCI over 1000 also should be encouraged to maintain their calcium intake level. Nevertheless, the real-world usefulness of HCI calculation must be further investigated by using them in a population-based cohort setting or as a screening tool of
young women, especially to obtain the positive predictive value and negative predictive value of low HCI value and low peak bone mass.
ACKNOWLEDGEMENT
The authors would like to thank Dr Sri Sukmaniah and Dr Neng Tine Kartinah for their contributions for study design refi nements and data analysis suggestions.
REFERENCES
1. Jahari AB, Prihatini S. Risiko osteoporosis di Indonesia. Gizi Indon 2007;30(1):1–11.
2. Heaney RP, Abrams S, Dawson-Hughes B, Looker A, Marcus R, Matkovic V, Weaver C. Peak bone mass. Osteoporos Int 2000;11(12):985–1009.
3. Prihatini S, Mahirawati VK, Jahari AB, Sudirman H. Faktor determinan risiko osteoporosis di tiga provinsi di Indonesia. Media Penelitian dan Pengembangan Kesehatan 2010;20(2 Jun).
4. Fleiss JL, Levin B, Paik MC, Fleiss J. Statistical methods for rates & proportions. 3rd edition. Hoboken, N.J: Wiley-Interscience; 2003.
5. Nichols EK, Khatib IMD, Aburto NJ, Sullivan KM, Scanlon KS, Wirth JP, Serdula MK. Vitamin D status and determinants of deficiency among non-pregnant Jordanian women of reproductive age. Eur J Clin Nutr 2012;66(6):751–6.
6. Pais R, Campean R, Simon S-P, Bolosiu CR, Muntean L, Bolosiu HD. Accuracy of quantitative ultrasound parameters in the diagnosis of osteoporosis. Cent Eur J Med 2010;5(4):478–85.
7. Chin K-Y, Ima-Nirwana S. Calcaneal quantitative ultrasound as a determinant of bone health status: what properties of bone does it refl ect? Int J Med Sci 2013;10(12):1778–83.
8. Barger-Lux MJ, Heaney RP, Stegman MR. Effects of moderate caffeine intake on the calcium economy of premenopausal women. Am J Clin Nutr 1990;52(4):722–5.
9. Bosy-Westphal A, Later W, Hitze B, Sato T, Kossel E, Gluer C-C, Heller M, Muller MJ. Accuracy of bioelectrical impedance consumer devices for measurement of body composition in comparison to whole body magnetic resonance imaging and dual X-ray absorptiometry. Obes Facts 2008;1(6):319–24.
10. Lang TF. The bone-muscle relationship in men and women. J Osteoporos 2011;2011:702735.
versus weight-bearing activity on bone mineral status of eumenorrheic athletes. J Bone Miner Res 1995;10(4):586–93.
12. Lalkhen AG, McCluskey A. Clinical tests: sensitivity and specifi city. Contin Educ Anaesth Crit Care Pain 2008;8(6):221–3.
13. De Laet C, Kanis JA, Odén A, Johanson H, Johnell O, Delmas P, Eisman JA, Kroger H, Fujiwara S, Garnero P, McCloskey EV, Mellstrom D, Melton LJ 3rd, Meunier PJ, Pols HA, Reeve J, Silman A, Tenenhouse A. Body mass index as a predictor of fracture risk: a meta-analysis. Osteoporos Int 2005;16(11):1330–8.
14. Heaney RP. Effects of caffeine on bone and the calcium economy. Food Chem Toxicol Int J 2002;40(9):1263–70. 15. Choi E-J, Kim K-H, Koh Y-J, Lee J-S, Lee D-R, Park SM. Coffee
consumption and bone mineral density in Korean premenopausal women. Korean J Fam Med 2014;35(1):11–8.
16. Black RE, Williams SM, Jones IE, Goulding A. Children who avoid drinking cow milk have low dietary calcium intakes and poor bone health. Am J Clin Nutr 2002;76(3):675–80. 17. Teegarden D, Lyle RM, Proulx WR, Johnston CC, Weaver