Gadjah Mada International Journal of Business
Vol. 16, No. 1 (January-April 2014): 39-53
* Corresponding author’s e-mail: [email protected]
Stock Market Integration:
Are Risk Premiums of International Assets Equal?
*Kusdhianto Setiawan
Faculty of Economics and Business, Universitas Gadjah Mada, Indonesia
Abstract: This paper studies previous research on capital market integration and applies a simple interna-tional capital asset pricing model by considering the incompleteness in market integration and heteroscedasticity of the market returns. When we disregarded those two factors, we found that stock markets were integrated and the law of one price on risk premiums prevails. However, when the factors were considered, the markets were just partially integrated.
Abstrak: Paper ini meninjau kembali berbagai penelitian sebelumnya dibidang integrasi pasar modal dan menerapkan International Capital Asset Pricing Model sederhana dengan mempertimbangkan faktor ketidaksempurnaan integrasi pasar dan faktor heteroskedastisitas dari pengembalian pasar. Ketika kedua faktor tersebut diabaikan, studi ini menemukan bahwa hukum satu harga (atas risiko pasar suatu aset atau premi risiko) berlaku dan berbagai pasar modal yang dijadikan sampel terintegrasi. Namun, ketika kedua faktor tersebut dipertimbangkan, berbagai pasar modal tersebut hanya terintegrasi secara parsial.
* This article is a part of the author's dissertation at Hiroshima University of Economics.
JEL Codes: G11, G12, G15
Introduction
The introduction of the euro in Euro-pean countries is often cited as an example of the countries’ ultimate goal of being merged into a single market. Before the in-troduction of the single currency, the Euro-pean Union (EU) countries harmonized their trade policies and made freer the trade of goods, services, and human capital (labor market integration) among the members. Meanwhile, the ASEAN countries seem to follow the steps taken by the EU in liberaliz-ing their markets. However, the use of a sliberaliz-ingle currency in the ASEAN group seems not to be expected in the near future. Many studies linked the steps necessary to integrate the markets to the theory of the optimum cur-rency area (OCA). The theory of the OCA, first proposed by Mundell (1963) is what in-spires such market integration efforts. There is a general consensus that economic liberal-ization in emerging economies should begin with trade liberalization and be followed by the deregulation of domestic financial mar-kets before lifting restrictions on capital ac-count transactions (Park and Wyplosz 2010: 41).
The East Asian countries, especially the ASEAN countries, have largely followed the sequencing strategy; they started lowering tariffs and non-tariff barriers long before tak-ing steps to liberalize and open their finan-cial markets. Thus, the markets might be re-gionally integrated, but in a worldwide con-text, they are not completely integrated.
If financial liberalization is to be effec-tive, the financial market in a country must, at the very least, be partially integrated with the world’s financial markets. In this case, both the domestic market and world market risks are prominent factors in pricing assets traded in the market. In the case of the emerging
financial markets, especially those in Asia, where the intensity of the market liberaliza-tion processes is the highest, the market might only be regionally integrated because after lib-eralization, significant indirect barriers remain in place, so that the efforts fail to attract for-eign (offshore) investments. However, as the process of integration is continuously taking place around the world, the state of integra-tion might change in the future. Regarding the issues, the measure of market integration must be, in some circumstances, time-vary-ing in-so-far as emergtime-vary-ing markets may evolve from a segmented state to an integrated state through time and vice versa (Arouri et al. 2010).
meanwhile the examination on two-factor models can be traced back to the works of Ferson and Harvey (1994) and Harvey (1995) where an aggregate index of currency returns is introduced to the single-factor ICAPM. The exchange rate factor is, however, found to have marginal explanatory power over the 1976-1992 period in describing the dynam-ics of emerging market returns.
For investors, the more integrated the markets are, the fewer the benefits of form-ing an internationally diversified portfolio. This is because when markets are becoming more integrated; asset prices are highly co-varied, such that reducing diversifiable risk would be less feasible. In addition, it is not only the asset price or returns that are co-varied, but also the volatility. Thus, the costs associated with the higher degree of market integration are at their least in the form of lower opportunity to diversify assets and the higher chances of accepting imported vola-tility and shocks from the other markets. In previous empirical studies, we can find some supporting evidence of contagion or volatil-ity spill-over. For example, King and Wadhwani (1990) test for an increase in stock market correlations between the United States, the United Kingdom, and Japan and find that cross-market correlations increased significantly after the US market crash in 1987. Lee and Kim (1993) extend this analy-sis to 12 major markets and find further evi-dence of contagion: average weekly cross-market correlations increased from 0.23 be-fore the 1987 US crash to 0.39 afterwards. Calvo and Reinhart (1996) used this approach to test for contagion in stock prices and Brady bonds after the 1994 Mexican peso crisis. They find that cross-market correlations in-creased for many emerging markets during the crisis. To summarize, each of these tests based on cross-market correlation coefficients
reach the same general conclusion: there was a statistically significant increase in cross-market correlation coefficients during the rel-evant crisis and, therefore, contagion oc-curred.
However, in the later period, the co-movement in conditional cross-variances was re-examined by Forbes and Rigobon (2002). They found that there was a high level of market co-movement in all the periods of the analyzed sample, not only during the crisis. The result indicates that the degree of inte-gration should be stable and high. In such a situation, the benefit of forming an interna-tionally diversified portfolio would vanish quickly, as a market shock in one country is transmitted instantaneously to the other mar-kets.
In examining the completeness of the integration, the empirical researches above were mainly based on a multi-factor model that comprises several systematic risk factors: the worldwide market risk, the exchange rate risk, the changes in commodity prices, the inflation rate, and the world business cycle. The results from previous studies show that inclusion of the additional factors does not help to improve the model’s explanatory power, compared to the single- and two-fac-tor models.
fron-tier, and/or at a tangent of the capital mar-ket line. The author seeks to overcome the latter by constructing a world market portfo-lio from the composing assets and perform-ing a Merton procedure for derivperform-ing the effi-cient frontier and the capital market line (Setiawan 2012). By doing so, a world port-folio that is mean-variance efficient and at the tangency of the capital market line is as-sured. The results indicate that markets are completely integrated when we applied the model that assumes completely integrated markets and disregards the hetorscadasticity and interdependence of the markets returns. Since the above constructed world market portfolio is not a common practice in the real world, this paper investigates the use of the
MSCI World Index as a proxy of the world market portfolio, for examining the degree of integration and the law of one price on the world market risk premium.
Data
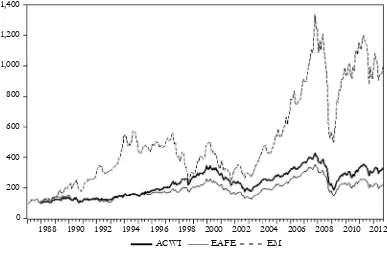
Using more recent data, the facts pre-sented by Arouri et al. (2010) are confirmed. From Figure 1, it is apparent that the emerg-ing markets outperformed the developed markets. The correlation of returns between the world index (ACWI) and emerging mar-ket index (EM) is 0.956; it is significantly higher than that between the ACWI and the developed market index (EAFE), 0.776. Meanwhile, Table 1 shows that the emerging
Figure 1. MSCI Indexes 1987:1-2012:9
1,400
1,200
1,000
800
600
400
200
0
1988 1990 1992 1994 1996 1998 2000 2002 2004 2006 2008 2010 2012
ACWI EAFE EM
markets have higher average monthly returns and standard deviations than those of the developed markets.
The international assets in this study consist of 12 stock market indexes from dif-ferent countries: US—S&P500 (US), Ger-man—DAX (GE), Hong Kong—Hang Seng (HK), Japan—Nikkei225 (JP), Singapore— Strait Times (SI), United Kingdom FTSE100 (UK), Argentina—MERVAL (AR), Brazil— BOVESPA (BR), China—SSEC (CH), Indo-nesia—IHSG (ID), Malaysia—KLSE (MA),
and Mexico—IPC (ME). The market indexes are adjusted to a US dollar value by multi-plying them with the local currency per US dollar value exchange rate. The MSCI ACWI index was obtained from MSCI’s website (http://www.msci.com), the other market indexes were obtained from Yahoo Finance (http://finance.yahoo.com), and the ex-change rates were obtained from OANDA (http://www.oanda.com).
The test of CAPM for international as-sets pricing in the US uses monthly observa-tions from 1997m7 until 2012m7. The risk-free asset is represented by US 3-month T-bills, while the world market portfolio is proxied by the MSCI ACWI index.
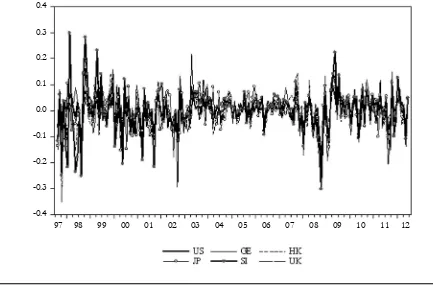
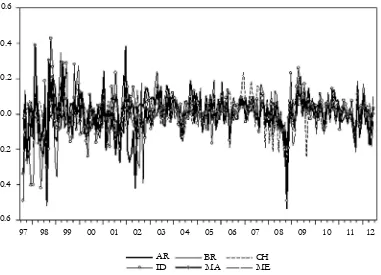
A plot of the excess returns of devel-oped markets and emerging markets is shown in Figures 2 and 3, respectively. In both fig-ures, we can observe that the volatility of the excess returns was higher during crises; Table 1. Monthly Returns Statistics of
MSCI Indexes 1987:1-2012:9
ACWI EAFE EM
Mean 0.004 0.002 0.008
Std. Dev. 0.046 0.052 0.071
Source: www.msci.com, computed by author
Figure 2. Excess Returns of Developed Markets in the U.S. Market
-0.4 -0.3 -0.2 -0.1 0.0 0.1 0.2 0.3 0.4
such volatility clustering indicates that a GARCH error structure might exist. The fig-ures also show that the excess returns of the stock markets were co-varied.
Asset Pricing Models
This paper utilized the capital asset pric-ing model (CAPM) with time-varypric-ing beta. In addition, the homogeneity of the world market risk premium across the markets will be investigated to indicate whether the law of one price in risk pricing holds. The latter also indicates the degree of integration of the stock markets being analyzed.
CAPM is one of the most popular as-set pricing methods in use. The model was independently developed by Jack Treynor (1961, 1962), William Sharpe (1964), John Lintner (1965) and Jan Mossin (1966). One
important contribution to the easy under-standing of CAPM was the work of Robert C. Merton (1972), in his work in providing an analytical solution to the following port-folio choice problem: Given the expected turns and the matrix of co-variances of re-turns for n individual assets, find the set of portfolio weights that minimizes the variance of the portfolio for each feasible portfolio expected return. The latter is known as a method to obtain the efficient frontier.
Issues in Testing CAPM
As a theory, CAPM justifies the prac-tice of investing in a broad market portfolio of stocks and bonds. This insight has led to the growth of “indexed” mutual funds and exchange-traded funds (ETFs) that hold mar-ket-weighted portfolios of stocks and bonds (Pennacchi 2008: 61). The use of market-Figure 3. Excess Returns of Emerging Markets in the U.S. Market
0.6
0.4
0.2
0.0
-0.2
-0.4
-0.6
97 98 99 00 01 02 03 04 05 06 07 08 09 10 11 12
ID
AR BR
weighted portfolios of stocks as a proxy of the market portfolio has been extensively found in many previous empirical works that examined CAPM. However, as earlier men-tioned in the derivation of CAPM, the mar-ket porfolio is not only a mean-variance (risky-only) efficient portfolio, but also a tan-gency portfolio of the capital market line. The findings in previous empirical works that re-ject CAPM may be attributed to the use of “false” market portfolios, such as a market capitalization weighted index (i.e. S&P500 index in the US stock market). Such an index may be a mean-variance efficient portfolio, but we cannot be assured that the index is also the tangency portfolio. The same issue also prevails in applying and testing CAPM for international asset pricing; previous em-pirical works usually relied on a “world in-dex” such as the MSCI world index as the proxy of the world market portfolio.
The CAPM defined:
where is a vector of national stock mar-kets returns ( ), is a scalar of risk free rate in a country where other stock market indexes are traded, is the n x 1 vector
whose ith element is . The CAPM in (1) states that there is a linear rela-tionship between excess expected return of an asset and the market risk i.
It requires an estimation of i. An un-biased estimate of it can be obtained by run-ning an Ordinary Least Square (OLS) regres-sion of asset i’s excess return on the market portfolio’s excess return. The orthogonal, mean-zero residual of the OLS is sometimes
referred to as an idiosyncratic, unsystematic, or diversifiable risk. This is the particular asset’s risk that is eliminated or diversified away when the asset is held in the market portfolio. Since the individual who invests optimally can eliminate this portion of the asset’s risk, there is no “price” or “risk pre-mium” attached to it in the sense that the asset’s equilibrium expected return is not al-tered by it.
When we want to apply CAPM for in-ternational asset pricing, the orthogonality of the residuals must hold if the markets where the international assets come from are com-pletely integrated. Assuming that the markets are completely integrated, CAPM can be tested and/or applied in a cross-section re-gression framework or equation-by-equation OLS in a dynamic time series setting. As the main theme in this paper on dynamic inter-national asset pricing, CAPM with time-vary-ing beta can be tested in the followtime-vary-ing model:
t in which the positive definiteness of the ma-trix is assured. Having the conditional vari-ance/co-variance matrix in hand, we can
es-timate , where and
are conditional co-variance between the return of asset i and the market return M, at time t, and conditional market return (M) variance at time t respectively. Model (2) hence could be estimated by equation-by-equation GARCH model. One of the univariate GARCH models that may be used for estimating the parameters in (2) is the EGARCH model.
The variance specification for model (2) is assumed to follow EGARCH(1,1) as fol-lows:
The parameters in (2) and (3) are stored in vector and are estimated by a maximum likelihood estimation (MLE) method. Assum-ing that errors in (2) are normally distributed, the contribution to the log-likelihood for ob-servation t is:
Testing model (2) as an estimation on equation-by-equation univariate GARCH
model implies that for . In
other words, we are assuming that the idio-syncratic risk, as represented by is uncorre-lated with that of the other markets, and if CAPM is true, then we should only be
con-cerned with the systematic or market risk rep-resented by the beta.
However, as mentioned earlier in pre-vious sections, many empirical works on test-ing and measurtest-ing the degree of financial market integration often found that financial markets around the world were not com-pletely integrated (partially or mildly inte-grated). As a consequence, the idiosyncratic risk (in this context, it may also be called the country-specific risk) in each market is often found to be correlated with that of the other markets. Thus, tests of CAPM based on OLS that ignore the co-variance of the residuals may become inefficient in estimating the pa-rameters in the test model. This is what will be addressed in this paper. To overcome the issues, the author also examined the CAPM for international asset pricing using Seemingly Unrelated Regression (SUR) and SUR with GARCH.
Findings
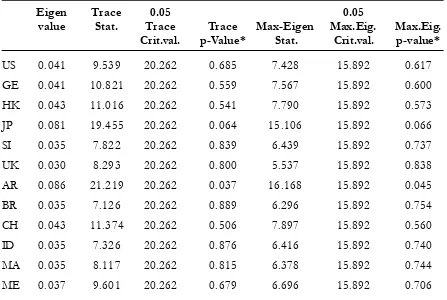
As pointed out by Chelley-Steely et al. (1998), the markets are said to be integrated if we fail to find a co-integrating equation among the markets (if a co-integrating equa-tion exists, one may do arbitrage by utilizing published information in the past). Table 2 shows Johansen’s Co-integration test for pairs of stock markets returns and the world mar-ket returns (MSCI ACWI). The Argentine stock market seems to have a long-term rela-tionship with the world stock market; histori-cal prices of the world index might be used for estimating the returns of the Argentinian market. Among the developed stock markets, the Japanese stock market is the market with the lowest degree of integration to the world market, as we can see from the trace statistic and maximum eigenvalue statistic that is just ...(3)
the second highest after the Argentinian stock market (one co-integrating equation is found to be below the 7 percent percent significance level). These findings are evidence that the stock markets were not completely integrated, even for the developed stock markets such as the Tokyo Stock Exchange.
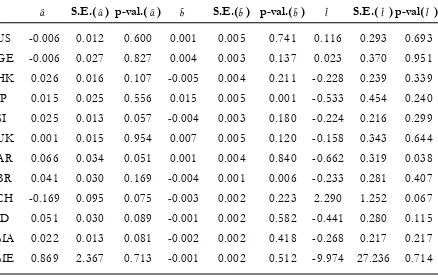
Testing CAPM using an equation-by-equation estimation of model (2) implies that we ignore two important properties of the data: (i) the existence of GARCH errors struc-ture, and (ii) stock markets were not com-pletely integrated such that the idiosyncratic risk (also known as the diversifiable risk) can-not be completely removed by forming an internationally diversified portfolio. The
re-sult of the CAPM test under this setting can be seen in Table 3.
As we can see in Table 3, using the 10 percent significance level, CAPM is rejected for estimating the excess stock market returns of Singapore, Argentina, China, Indonesia, and Malaysia. The premia for market risk (beta) are also different across the assets. It indicates that the market risk is priced differ-ently for assets from foreign markets. More-over, the idiosyncratic risk seems to be priced in some markets (Argentina and China), while the common world factor (beta) is not priced significantly. From this test, one may conclude that CAPM does not work for pricing the in-ternational assets. However, note that we ig-Table 2. Cointegration Test between the Domestic Market and World Market
Eigen Trace 0.05 0.05
value Stat. Trace Trace Max-Eigen Max.Eig. Max.Eig.
Crit.val. p-Value* Stat. Crit.val. p-value*
US 0.041 9.539 20.262 0.685 7.428 15.892 0.617
GE 0.041 10.821 20.262 0.559 7.567 15.892 0.600
HK 0.043 11.016 20.262 0.541 7.790 15.892 0.573
JP 0.081 19.455 20.262 0.064 15.106 15.892 0.066
SI 0.035 7.822 20.262 0.839 6.439 15.892 0.737
UK 0.030 8.293 20.262 0.800 5.537 15.892 0.838
AR 0.086 21.219 20.262 0.037 16.168 15.892 0.045
BR 0.035 7.126 20.262 0.889 6.296 15.892 0.754
CH 0.043 11.374 20.262 0.506 7.897 15.892 0.560
ID 0.035 7.326 20.262 0.876 6.416 15.892 0.740
MA 0.035 8.117 20.262 0.815 6.378 15.892 0.744
ME 0.037 9.601 20.262 0.679 6.696 15.892 0.706
Table 3. Conditional Beta CAPM Test for International Assets—EGARCH
S.E.( ) p-val.( ) S.E.( ) p-val.( ) S.E.( )p-val( )
US -0.006 0.012 0.600 0.001 0.005 0.741 0.116 0.293 0.693
GE -0.006 0.027 0.827 0.004 0.003 0.137 0.023 0.370 0.951
HK 0.026 0.016 0.107 -0.005 0.004 0.211 -0.228 0.239 0.339
JP 0.015 0.025 0.556 0.015 0.005 0.001 -0.533 0.454 0.240
SI 0.025 0.013 0.057 -0.004 0.003 0.180 -0.224 0.216 0.299
UK 0.001 0.015 0.954 0.007 0.005 0.120 -0.158 0.343 0.644
AR 0.066 0.034 0.051 0.001 0.004 0.840 -0.662 0.319 0.038
BR 0.041 0.030 0.169 -0.004 0.001 0.006 -0.233 0.281 0.407
CH -0.169 0.095 0.075 -0.003 0.002 0.223 2.290 1.252 0.067
ID 0.051 0.030 0.089 -0.001 0.002 0.582 -0.441 0.280 0.115
MA 0.022 0.013 0.081 -0.002 0.002 0.418 -0.268 0.217 0.217
ME 0.869 2.367 0.713 -0.001 0.002 0.512 -9.974 27.236 0.714
The results are based on the equation-by-equation EGARCH model, where the mean equation is speci-fied by , by assuming that E(i,t,j,t)= 0 for i j.
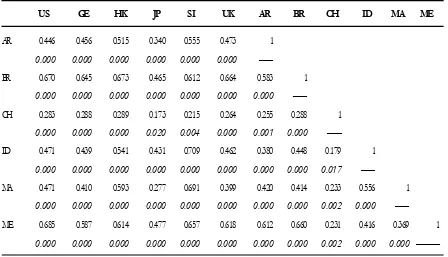
Table 4. Cross-Correlation of CAPM Residuals
US GE HK JP SI UK AR BR CH ID MA ME
US 1
——
GE 0.823 1
0.000 ——
HK 0.662 0.627 1
0.000 0.000 ——
JP 0.626 0.545 0.529 1
0.000 0.000 0.000 ——
SI 0.672 0.586 0.815 0.525 1
0.000 0.000 0.000 0.000 ——
UK 0.834 0.825 0.693 0.600 0.649 1
Table 4 (Continued)
US GE HK JP SI UK AR BR CH ID MA ME
AR 0.446 0.456 0.515 0.340 0.555 0.473 1
0.000 0.000 0.000 0.000 0.000 0.000 ——
BR 0.670 0.645 0.673 0.465 0.612 0.664 0.583 1
0.000 0.000 0.000 0.000 0.000 0.000 0.000 ——
CH 0.283 0.288 0.289 0.173 0.215 0.264 0.255 0.288 1
0.000 0.000 0.000 0.020 0.004 0.000 0.001 0.000 ——
ID 0.471 0.439 0.541 0.431 0.709 0.462 0.380 0.448 0.179 1
0.000 0.000 0.000 0.000 0.000 0.000 0.000 0.000 0.017 ——
MA 0.471 0.410 0.593 0.277 0.691 0.399 0.420 0.414 0.233 0.556 1
0.000 0.000 0.000 0.000 0.000 0.000 0.000 0.000 0.002 0.000 ——
ME 0.685 0.587 0.614 0.477 0.657 0.618 0.612 0.660 0.231 0.416 0.369 1
0.000 0.000 0.000 0.000 0.000 0.000 0.000 0.000 0.002 0.000 0.000 ——
The numbers in italic are p-values
nore two important properties in our data that were previously mentioned. Thus, the rejec-tion of CAPM in this test may be caused by the specification error in estimating the model.
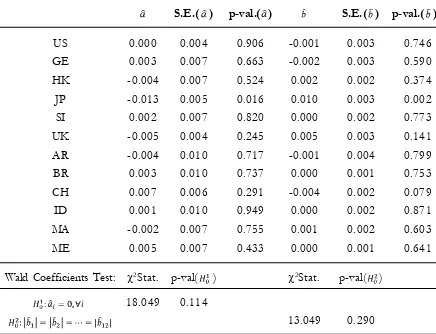
Testing CAPM using equation-by-equa-tion estimaequation-by-equa-tion for each asset ignores the fact that the idiosyncratic risks that represent the market-specific characteristics are still cor-related with those of the other market. The risk is not completely removed by the diver-sification. Table 4 shows that cross-correla-tion of CAPM residuals is found in almost all markets. Knowing this property, tests of CAPM under seemingly unrelated regression (SUR) should be more appropriate to tackle the issue. Table 5 shows the results under the SUR framework [the idiosyncratic risk was excluded from model (2)].
Under the SUR framework, CAPM fits well for international asset pricing. Although
Table 5. Conditional Beta CAPM Test for International Assets—SUR
S.E.( ) p-val.( ) S.E.( ) p-val.( )
US 0.000 0.004 0.906 -0.001 0.003 0.746
GE 0.003 0.007 0.663 -0.002 0.003 0.590
HK -0.004 0.007 0.524 0.002 0.002 0.374
JP -0.013 0.005 0.016 0.010 0.003 0.002
SI 0.002 0.007 0.820 0.000 0.002 0.773
UK -0.005 0.004 0.245 0.005 0.003 0.141
AR -0.004 0.010 0.717 -0.001 0.004 0.799
BR 0.003 0.010 0.737 0.000 0.001 0.753
CH 0.007 0.006 0.291 -0.004 0.002 0.079
ID 0.001 0.010 0.949 0.000 0.002 0.871
MA -0.002 0.007 0.755 0.001 0.002 0.603
ME 0.005 0.007 0.433 0.000 0.001 0.641
Wald Coefficients Test: 2Stat. p-val( ) 2Stat. p-val( ) 18.049 0.114
13.049 0.290
earlier. However, in SUR estimation, the er-rors are assumed to correlate in cross section, but are homoscedastic or have a constant variance/co-variance matrix. As we can see in Figure 2 and Figure 3, volatility clustering in the excess returns is very likely to be present. Applying a diagonal BEKK for test-ing the CAPM (model (2) specifies the mean equation of each asset in the SUR system equation), we may tackle the presence of the errors structure.
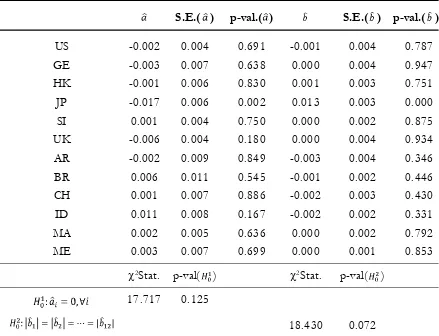
Table 6 shows the CAPM test results under the SUR-GARCH model. The esti-mated parameters were obtained from the diagonal BEKK model estimated by maxi-mum likelihood estimation (MLE). A test of
the joint hypothesis that all intercepts are 0 cannot be rejected. However, the significance level for rejecting the homogeneity of mar-ket risk premia is increasing. Under the 10 percent significance level, we reject that the market risk premia are identical across the assets. The latter indicates that the market risk is priced differently for assets from dif-ferent markets.
Applying SUR-GARCH enables us to test dynamic beta CAPM under both com-pletely integrated (the idiosyncratic risk is uncorrelated with that of other markets) or partially integrated markets (the idiosyncratic risk may be correlated with that of other markets). This is the advantage of using the SUR-GARCH framework in testing CAPM. However, as the number of assets we want to analyze is increasing, the number of pa-rameters to be estimated is exploding, such that the MLE is becoming unfeasible.
In the empirical example of the test above, we used the monthly data from 15-year observations (180 observations). In that situation the MLE is still feasible and we can
see the results as shown in Table 6. When high frequency (i.e., weekly or daily) data are used in the analysis, the MLE fails to esti-mate the parameters. This is the disadvan-tage of using the MLE.
Summary and Conclusions
We found that CAPM is fully applicable and the risk premiums for the assets are equal when an OLS estimation was carried out. However, when heteroscedasticity and in-completeness of the market integration were considered, CAPM could not be justified as a good model for pricing the international assets. Given the results above, there is some Table 6.Conditional Beta CAPM Test for International Assets
By SUR-GARCH (MLE)
S.E.( ) p-val.( ) S.E.( ) p-val.( )
US -0.002 0.004 0.691 -0.001 0.004 0.787
GE -0.003 0.007 0.638 0.000 0.004 0.947
HK -0.001 0.006 0.830 0.001 0.003 0.751
JP -0.017 0.006 0.002 0.013 0.003 0.000
SI 0.001 0.004 0.750 0.000 0.002 0.875
UK -0.006 0.004 0.180 0.000 0.004 0.934
AR -0.002 0.009 0.849 -0.003 0.004 0.346
BR 0.006 0.011 0.545 -0.001 0.002 0.446
CH 0.001 0.007 0.886 -0.002 0.003 0.430
ID 0.011 0.008 0.167 -0.002 0.002 0.331
MA 0.002 0.005 0.636 0.000 0.002 0.792
ME 0.003 0.007 0.699 0.000 0.001 0.853
2Stat. p-val( ) 2Stat. p-val( )
17.717 0.125
inconsistency with regard to drawing conclu-sions about the applicability of CAPM in in-ternational assets pricing. This inconsistency may be due to the estimation method being used for the test, as described earlier. The other possible reason is because of the world market portfolio. The MSCI ACWI index is a value-weighted index, meaning that the pro-portion of assets from different markets in the index is always non-negative. The index is traded as an ETF in some markets around the world, including in the US. Note that the MSCI ACWI index or its derivative index (ETF) directly tracks the price of the com-posing assets in the other markets, regardless
of the dynamics of the demand of the index, let us say, in the US. Thus, the weights of the assets in that portfolio (index) were not ob-tained from an optimization problem as as-sumed by CAPM. Although the composing assets in that index may include all possible representative assets from almost all stock markets around the world, we cannot be as-sured that such an index is not only mean-variance efficient, but also the tangency port-folio of the capital market line. With regard to this issue, the rejection of CAPM in a test using such an index as a proxy of the world market portfolio may also be due to the inap-propriate world market proxy.
References
Adler, M., and B. Dumas. 1983. International portfolio choice and corporation finance: A synthesis.
Journal of Finance 38 (3): 925-984.
Arouri, M. E. H, F. Jawadi, and D. K. Nguyen. 2010. The Dynamics of Emerging Stock Markets, Empirical Assessments and Implications. Berlin Heidelberg: Physica-Verlag (Springer).
Calvo, S., and C. M. Reinhart. 1996. Capital flows to Latin America: Is there evidence of contagion effects? In Guillermo A. C., M. Goldstein, and E. Hochreiter (Ed.), Private Capital Flows to Emerging
Markets After the Mexican Crisis. Washington, DC: Institute for International Economics.
Buch, C. M. 2004. Globalization of Financial Markets, Causes of Incomplete Integration and Consequences for Eco-nomic Policy. Germany: Springer.
Chelley-Steely, P. L., J. M. Steeley, and E. J. Pentecost. 1998. Exchange controls and European stock market integration. Applied Economics 30 (2): 263-267.
Fama, E. F., and K. R. French. 2004. The capital asset pricing model: Theory and evidence. Journal of Economic Perspectives 18: 25–46.
Ferson, W. E., and C. R. Harvey. 1994. Sources of risk and expected returns in global equity markets.
Journal of Banking and Finance 18 (4): 775-803.
Forbes, K. J., and R. Rigobon. 2002. No contagion, only interdependence: Measuring stock market comovements. Journal of Finance57 (5): 2223-2261.
Harvey, C. R. 1995. Predictable risk and returns in emerging markets. Review of Financial Studies 8 (3): 773-816.
King, M. A., and S. Wadhwani. 1990. Transmission of volatility between stock markets. Review of Financial Studies 3: 5-33.
Lintner, J. 1965. The valuation of risk assets and the selection of risky investments in stock portfolios and capital budgets. Review of Economics and Statistics 47 (1): 13-37.
Merton, R. C. 1972. An analytical derivation of the efficient portfolio frontier. Journal of Financial and Quantitative Analysis 7: 1851-1872.
Mossin, J. 1966. Equilibrium in a capital asset market. Econometrica 34 (4): 768–783.
Mundell, R. A. 1963. Capital mobility and stabilization policy under fixed and flexible exchange rates. The Canadian Journal of Economics and Political Science/ Revue canadienne d’Economique et de Science politique 29 (4): 475–485.
Park, Y. C., and C. Wyplosz. 2010. Monetary and Financial Integration in East Asia: The Relevance of European
Experience. USA: Oxford University Press.
Pennacchi, G. 2008. Theory of Asset Pricing. Boston, US: Pearson Education Inc.
Sharpe, W. F. 1964. Capital asset prices: A theory of market equilibrium under conditions of risk. Journal of Finance 19 (3): 425-442.
Setiawan, K. 2012. Reexamination of Dynamic Beta International CAPM: A SUR with GARCH ap-proach. Review of Economic and Business Studies 10 (5-2).
Treynor, J. L. 1961. Market value, time, and risk. Unpublished Manuscript.
Treynor, J. L. 1962. Toward a theory of market value of risky assets. Unpublished Manuscript (A final version was published in 1999 in Robert A. Korajczyk (Ed.), Asset Pricing and Portfolio Performance: