451
The Effect of Changes in Tick Price and Lot Size on Bid-Ask Spread,
Depth, Trading Volume, and Trading Time
In Indonesia Stock Exchange
Kevin Budi Santoso, Immanuel Garry Billy Mogie
International Business Management Program, Petra Christian UniversityJl. Siwalankerto 121-131, Surabaya
E-mail: kevinkevinbudi@gmail.com, billymogie@rocketmail.com
ABSTRACT
Government has changed the regulation regarding tick price and lot size on 6 January 2014 to boost stock liquidity. This research aims to analyze the effect of the changes toward bid-ask spread, depth, trading volume, and trading time as the variables of stock liquidity. This research used purposive judgment sampling method with several criteria to gather 212 stocks as the sample within 30 days window period. The data was analyzed using Paired Sample T Test for normally distributed data, or Wilcoxon Test for not normally distributed data. The results showed that there is a significant decrease on bid-ask spread, depth, and trading time, whereas the trading volume is insignificantly increased.
Keywords: Bid-Ask Spread, Depth, Trading Volume, Trading Time, Stock Liquidity
ABSTRAK
Pemerintah merubah peraturan mengenai fraksi harga dan satuan perdagangan pada 6 Januari 2014 untuk meningkatkan likuiditas saham. Penelitian ini bertujuan untuk menganalisa pengaruh perubahan tersebut terhadap bid-ask spread, depth, trading volume, dan trading time sebagai variabel dari likuiditas saham. Penelitian ini menggunakan metode purposive judgment sampling method dengan beberapa kriteria untuk mendapatkan 212 sampel saham dalam 30 hari jangka penelitian. Data dianalisa menggunakan Paired Sample T Test untuk data yang terdistribusi normal dan Wilcoxon Test untuk data yang tidak terdistribusi normal. Hasil penelitian menunjukan bahwa terdapat adanya penurunan yang signifikan terhadap bid-ask spread, depth, dan trading time, sementara trading volume mengalami kenaikan yang tidak signifikan.
Kata Kunci: Bid-Ask Spread, Depth, Trading Volume, Trading Time, Likuiditas Saham.
INTRODUCTION
In 1912, the first stock exchange in Indonesia was constructed in Batavia and was named Batavia Stock Exchange. As time goes by, stock market in Indonesia experienced many developments in its structure by introducing Surabaya Stock Exchange in 1989. Moreover, on 30th October 2007, both Jakarta Stock Exchange and Surabaya Stock Exchange were merged and became Indonesia Stock Exchange (Bursa Efek Indonesia, 2010). The goal of this merger was to improve the efficiency of Indonesian market, since all the companies only need to be listed in one bourse. Thus, the government can focus in providing one best integrated infrastructure.
This Indonesia Stock Exchange is owned by the government named PT. Bursa Efek Indonesia under the management of Ministry of Finance. On 6 January 2014, government imposed new regulation regarding
tick price and lot size as written in “Surat Keputusan
Direksi PT. Bursa Efek Indonesia
Kep-00071/BEI/11-2013”. According to Darmadji and Fakhruddin
452 tick price is too high, there would be a wide gap between the minimum price the market wants to sell and the maximum price the market wants to buy. This indicates the higher the tick price, the harder the transaction would occur. Nevertheless, if the tick price is too low, there would be a decrease in the market depth since the minimum price market wants to sell is more likely to match with the maximum price market wants buy, which caused the transaction to occur very often. Thus, the price of the stocks will easily change.
Lot size is the minimum volume of shares traded in the stock exchange or the volume within one lot. excluding fee and taxes. Thus, lower lot size leads to higher purchasing power of public investors and eventually to higher liquidity.
Table 1 shows the difference in tick price and lot size between new regulation after 6 January 2014 and old regulation before 6 January 2014.
Table 1 Changes in Tick Price and Lot Size
Source: PT. Bursa Efek Indonesia, 2014 As seen on table 1, new regulation required the traders to at least purchase 100 shares while the old regulation required 500 shares. The changes on tick price were quite significant. Within the category of Rp 200 - < Rp 500, the new regulation stated that the tick price went down to Rp 1 from Rp 5. On the other hand, within the category of Rp 500 - < Rp 5000, the new regulation stated that the tick price is Rp 5. As
for the category of ≥ Rp 5000, the new regulation
stated that the tick price is Rp 25.
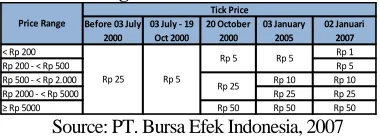
Even before the release of this new regulation in 2014, the government has tried to change the tick price in several occasions, as seen in table 2.
Table 2 Changes in Tick Price from 2000 - 2007
Source: PT. Bursa Efek Indonesia, 2007 According to Ito Warsono, president director of PT. Bursa Efek Indonesia, the reason why the government decided to impose the changes in tick
price and lot size was to increase stock liquidity which will eventually boost local investment. With lower lot size, Samsul Hidayat, director monitoring compliance of BEI members, revealed that the government expects the stock price to be more affordable for the investors. As for the tick price, the changes expected to diminish the spread between bid and ask (Perubahan Lot Size dan Tick Price BEI: Seluruh AB Sudah Siap, 2014).
Additionally, analyst of Creative Trading System, Argha J Karo Karo, believed that retail investors are having difficulties in purchasing and managing diverse portfolio due to its expensive price for a single lot (BEI Menyatakan Siap Terapkan Fraksi Baru, 2014). Thus, after the implementation of this new regulation, the government expects an Bid-ask spread is calculated by the difference between the bid price and the ask price. The smaller the that is traded by the investors in the stock market. The more the volume traded, the higher the liquidity is.
Meanwhile, based on Rico von Wyss, liquidity can be measured by four things; trading time, tightness, depth, and resiliency (Wyss, 2004). Trading time is the time interval between one transaction to another. The lower the trading time, the more liquid a stock is. Tightness is ability to trade stocks within almost the same price. Tightness measures in the same way the spread does. The smaller the tightness, the higher the liquidity is. Depth is the total number of demand and supply of stocks in bid and ask price respectively. The higher the depth, the higher the liquidity is. Resiliency is the ability to trade at a certain amount of stocks with little influence on the quoted price. The more the resiliency, the more liquid a stock is.
There are several studies that have been conducted around the world, regarding the changes in tick price on bid-ask spread, depth, and trading volume. Lau and McInish (1995) found out that after Stock Exchange of Singapore decreased the tick price from 50 cent to 10 cent for above SGD 5 stock price in 1994, bid-ask spread and depth were decreased, while trading volume remained the same. Furthermore, other similar researches were done by Bacidore (1997), Porter and Weaver (1997), Ahn,
Lot Size 500 Lot Size 100
Price Range Tick Price Price Range Tick Price
453 Cao, and Choe (1998), and MacKinnon and Nemiroff (1999). The researches were centered on the decrease in tick price from C$0.125 to C$0.05 for above C$5 stock price in Toronto Stock Exchange in 1996. Overall, they found out that bid-ask spread and depth were significantly decreased, while trading volume stayed the same.
American Stock Exchange has also decreased the tick price from $1/8 to $1/16 for all the stocks in 1997. A year later, Ronen and Weaver (1998) found out that bid-ask spread and depth were significantly decreased while trading volume was insignificantly increased due to the changes. Besides Nasdaq, NYSE (New York Stock Exchange) also decreased the tick price from $1/8 to $1/16 in 1997. Bollen and Whaley (1999) found that bid-ask spread and depth were significantly decreased, while trading volume was increased.
Based on the background above, authors are interested in analyzing deeper about the effects of changes in tick price and lot size on bid-ask spread, depth, and trading volume in Indonesia Stock Exchange, specifically about the new regulation that was effective per 6 January 2014. Moreover, authors also use another measurement which is trading time as further development of the research. In this study, authors chose trading time to know whether the transaction occurs frequently or still the same. By combining with the trading volume, authors could analyze whether there is a difference in the amount of volume traded or the likeliness the transaction to happen.
LITERATURE REVIEW
This study analyzed the effect of changes in tick price and lot size on bid-ask spread, depth, trading volume, and trading time in Indonesia Stock Exchange. There are mainly seven concepts and definitions that are considered by the authors as the fundamental in this research: Indonesia Stock Exchange, lot size, tick price, bid-ask spread, depth, trading volume, and trading time. Each of the concepts and definitions would be provided by sufficient explanations and formulas that are relevant to this particular research.
Indonesia Stock Exchange
Indonesia Stock Exchange is the government organization that manages stock trading activity in Indonesia. It was a merger between Surabaya Stock Exchange and Jakarta Stock Exchange that established on 30 October 2007. Indonesia Stock Exchange facilitates equities, fixed incomes, and derivative instruments trading (Bursa Efek Indonesia, 2010).
One of the important roles played by Indonesia Stock Exchange is information sharing to the capital market participants and public community. These
roles act under the basis of its vision and missions which is to become an acknowledge and credible world-class exchange and to create a competitive edge to attract investors and listed companies through the empowerment of stock exchange members and participants, the creation of added value, cost efficiency and the implementation of good governance (Bursa Efek Indonesia, 2010).
Stock Liquidity
Liquidity is the ability to buy and sell stocks without having significant changes in their prices (Allen & Sudiman, 2009). Moreover, Flemming (2003) stated that the liquidity of a stock is depending on how high the transaction cost is. If the transaction cost is low it means the stock is liquid, while if transaction cost is high then the stock is not liquid. Furthermore, Bennemark & Chen (2007) define liquidity as the ability to execute a transaction directly at that time at the bid and ask price. Thus, a stock is liquid when there is always a buyer whenever a stock is about to be sold with low volatility in the price.
Stock liquidity is important because it reflects how liquid a bourse is. There are many measurements of liquidity according to experts. Based on Flemming (2003), stock liquidity can be measured through the bid-ask spread, depth, and trading volume. Meanwhile, Wyss (2004) measured liquidity through trading time, tightness, depth, and resiliency. In this research, authors decided to use four measurements of liquidity, which are bid-ask spread, depth, trading volume, and trading time, regarding the change of tick price and lot size on 6 January 2014.
Bid-Ask Spread
Bid-ask spread is the difference between ask and bid price and it gives an approximation of the cost incurred when trading as in Wyss (2004). Beside fees and taxes, traders also have to pay the spread as the transaction cost. Instead of buying at the bid price, traders sometimes choose to buy at the ask price to execute immediate transaction (Zhang & Hodges, 2012). Same goes when traders want to sell, instead of selling at the ask price, traders decide to sell at the bid price to be able to execute immediate transaction. There are three types of spread based on Wyss (2004): The absolute spread is the difference between the lowest ask price and the highest bid price. Pt
A
denotes the lowest ask price traders want to sell while Pt
B
denotes the highest bid price traders want to buy. Thus, this measure is always positive since Pt
A
is higher than Pt
B
. Absolute price or quoted price doesn’t only reflect the difference of the bid and ask price, but also the quoted spread of transactions in the order book.
454 Relative spread is one of the measurements that is most commonly used because it is easy to calculate and comparable to other stocks. Relative spread with mid price calculates the difference between the lowest ask and the highest bid divided by where
. On the other hand, relative spread with last trade considers moving market, because (base price) could be either the ask price or the bid price. However, should not be decided too long before as it could be irrelevant to the current market situation.
(with mid price)
(with last trade)
Effective Spread calculated by the difference between the last traded price and mid price, which cannot be negative. Most of the time, effective spread showed half of the absolute spread if the last trade is within the quote and therefore to be comparable with other spread measures, effective spread may be multiplied by two.
Depth
Flemming (2003) said that depth (quote size) is an estimation of the quantity of securities tradable at the bid and offer price. Just like bid-ask spread, depth is also commonly used as one of the measurements of liquidity. Depth is the total number of demand and supply of stocks in bid and ask price respectively as in Wyss (2004).
Dollar Depth is the average of the quoted bid and ask depths in currency terms as in Wyss (2004). denotes the ask price at time t while denotes the bid price at time t. This measure takes into account not only the number of shares traded but also the price of that particular stock.
Trading Volume
Trading volume is the number of trades executed within a specified interval without regard to trade size as in Flemming (2003). High trading volume indicates higher liquidity. is the number of trades happened in that specified interval of time, while is the number of shares traded in particular i.
∑
Trading Time
Trading time measures the time interval between one transaction to another. The more transaction happen in a certain period of time makes the trading time lower which leads to a higher liquidity (Wyss, 2004). This measure is also known as waiting time in which it can be measured in second, minute, or even hour.
∑
is the waiting time in time t, denotes the time of the trade, while denotes the time of the trade before. N is the frequency of transaction between the time and . Trading time together with trading volume is able to show which stocks have few large trades and which stocks have many small trades
Relationship between Concepts
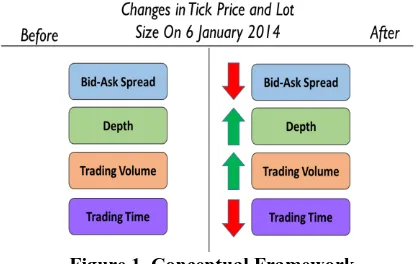
Authors relate the changes in tick price and lot size directly to each measurements of liquidity which are bid-ask spread, depth, trading volume, and trading time, as shown in figure 2.1.
Figure 1. Conceptual Framework
455 and queue in the order book (May, 2012). The theory is also proven by Satiari (2009) who stated that the reduction in tick price and lot size leads to a higher depth. Furthermore, Bollen and Whalley (1999) research supports that a decrease in tick price and lot size would increase the purchasing power of regular traders in order to participate in stock trading and eventually increases the trading volume of a stock. Lastly, the decrease in tick price and lot size would decrease the interval time between one transaction to another as the stocks would be traded more frequent, and ultimately would decrease the trading time as found in Chandra (2015). Thus, the changes are estimated to decrease both bid-ask spread and trading time, while on the other hand increase depth and trading volume.
Due to the changes of tick price and lot size that
were written in the “Surat Keputusan Direksi PT.
Bursa Efek Indonesia Kep-00071/BEI/11-2013”, authors conclude that there are, in total, four hypotheses provided in this study. Below listed hypotheses that are about to be proven using appropriate methods.
H1: There is a significant difference between
bid-ask spread before and after the changes of tick price and lot size in Indonesia Stock Exchange.
H2: There is a significant difference between depth before and after the changes of tick price and lot size in Indonesia Stock Exchange.
H3: There is a significant difference between trading volume before and after the changes of tick price and lot size in Indonesia Stock Exchange.
H4: There is a significant difference between trading time before and after the changes of tick price and lot size in Indonesia Stock Exchange.
RESEARCH METHOD
According to Cooper and Schindler (2014) there are four types of research method based on its purpose: Reporting Studies, Descriptive Studies, Explanatory Studies, and Predictive Studies. Reporting Studies is the most basic method since it only gathers collection of data and presents it for a better understanding of a certain area or for comparison. Most of the data is available and easy to find as long as the researcher has the knowledge or the skills regarding the data sources. This study requires less conclusion and implication compared to the other studies (Cooper & Schindler, 2014).
Another type of research method is Descriptive Studies. The objectives of this study first is to describe the phenomena related to subject population by finding out the who, what, where, when, and how of the topic. Second, it is used to estimate the
proportion of the population. Lastly, it is used to discover the association between variables yet it does not clarify why the variables are associated (Cooper & Schindler, 2014).
The third type of research method is Explanatory Studies. The essence of Explanatory Studies is to learn the connection among variables. Explanatory study goes deeper than Descriptive Study. Explanatory Studies attempts to explain why the variables are associated one to another through hypotheses and theories (Cooper & Schindler, 2014).
The last type of research method is Predictive Studies. Predictive Studies aims to provide reasonable explanation of why certain things occurred or happened. By knowing the reason behind that, researchers are able to predict when and in what situation the similar events are likely to reoccur. With Predictive Studies, researchers understand and control what variables affect the event the most (Cooper & Schindler, 2014).
Considering all types of research methods, authors choose to use Explanatory Studies as the most suitable approach to conduct this research because this research used theories of experts and hypotheses to analyze the effect of changes in tick price and lot size happened on 6 January 2014 are affecting variables such as bid-ask spread, depth, trading volume, and trading time.
This study analyzed the effect of changes in tick price and lot size on bid-ask spread, depth, trading volume, and trading time in Indonesia Stock Exchange. The changes of tick price and lot size in this study only act as the event, while the variables used are bid-ask spread, depth, trading volume, and trading time
Bid-ask spread is the difference or the gap between the lowest price seller want to trade and the highest price buyer want to trade of a particular stock at the closing period of each day. In this study authors emphasis on relative spread, specifically relative spread with mid-price, since it is the most commonly used by previous studies such as Ekaputra (2006), Nugroho (2007), and Satiari (2009). Relative spread with mid-price is able to compare spread of different stocks because it uses middle price as the denominator of the gap between bid price and ask price as in Wyss (2004), while Christie and Huang (1994) stated that relative spread is more appropriate measurement in measuring liquidity compare to absolute-dollar spread.
456
(with mid-price)
Relative spread with mid-price ( calculates the difference between the lowest ask and the highest bid divided by , where .
Thus, in order to calculate relative spread authors need to gather the data of the lowest price to sell and the highest price to buy for all samples at the closing period every day during the window period which is 15 working days before the event and 15 working days after the event. These data are gathered directly from Indonesia Stock Exchange website. However, authors only use bid price and ask price at the closing period due to limitation of the source.
Depth is the total amount of lot waiting in the order book for both bid price and ask price of a particular stock at the closing period of each day. In this study authors focus on the basic formula of depth since this study only analyzes how deep the market is, in term of the quantity which makes it the most appropriate formula to be used. Lau & McInish (1995), in analyzing Stock Exchange of Singapore, also used formula of basic depth in their research.
Authors did not use log depth because it measures how much the increase of the depth from day to day which makes it irrelevant, since authors only need to analyze the total depth before and after the event. Furthermore, dollar depth is also irrelevant in this study since the different price range of stocks makes it harder to be compared.
denotes the quantity depth on ask price in time t, while signifies the quantity depth on bid price in time t. Consequently, in order to calculate
depth authors need to accumulate the number of lot waiting at bid price and number of lot waiting at ask price each day at the closing period during the window period. These data are gathered directly from Indonesia Stock Exchange website. However, authors only use depth at the closing period due to limitation of the source.
Trading volume in this study considers not about the nominal of the transaction but the number of stock involved within trading hours per day. There are a lot of previous studies used the same formula of trading volume in their research, such as Lau and McInish (1995), Ahn, Cao, and Choe (1997), Bacidore (1997), and Bessembinder (1997).
∑
is the number of trades happened in that specified interval of time, while is the number of
shares traded in particular i. Accordingly, in order to calculate trading volume, authors need to collect the data of the aggregated number of stock traded within five and a half trading hours per day, during the window period which is 15 working days before the event and 15 working days after the event. These data are gathered directly from Indonesia Stock Exchange website.
Trading time in this study deliberates the average waiting time between each transaction. The formula of trading time used in this study is:
∑
is the waiting time in time t, indicates the time of the trade, while denotes the time of the trade before. N is the frequency of transaction between the time and . Therefore, in order to calculate trading time, authors need to accumulate the data of the total number of transaction happen each day during the window period. These data are gathered directly from Indonesia Stock Exchange website by downloading the daily frequency for each stock.
Cooper and Schindler (2014) stated that type of data can be divided into two which are qualitative data and quantitative data. Qualitative data is data that is used to describe phenomena in happened in the world. On the other hand, quantitative data is data that measures and answers questions related to how much, how often, how many, when, and who. The difference between qualitative data and quantitative data can be seen from the data type and preparation as seen on table 3.
Table 3 Qualitative Vs. Quantitative Data Qualitative Quantitative
Data Type and Preparation
Verbal or pictorial descriptions
Verbal descriptions Reduced to
verbal codes (sometimes with computer assistance)
Reduced to numerical codes for computerized analysis
457 countable and clear data which explain the impact of one event to its variables.
After knowing the types of data used in this research, authors would like to describe the appropriate measurement scales best used in this study. Cooper and Schindler (2014) stated that there are four assumptions in determining measurement scales which are classification, order, distance, and natural origin. Classification is numbers used to classify or cluster without any order such as type of gender. Order is numbers that have different value to other numbers either greater than, less than or equal to such as doneness of meat. Distance, like order, is numbers that have different value to other numbers but the difference of each pair of number must be equal to another such as temperature in degrees. Natural origin is numbers with absolute zero or meaningful zero point as weight and height (Cooper & Schindler, 2014).
Based on those assumptions, measurement scales can be divided into four different levels which are nominal, ordinal, interval, and ratio. First, nominal scales have classification without order, distance and natural origin. Nominal scale acts as label of groups without quantitative value which makes it the least powerful among the other measurement scales (Cooper & Schindler, 2014).
Second, ordinal scales have classification with order but without distance and natural origin. Numbers in ordinal scales have different quantitative value either greater than or less than between one to another yet it does not show how much the difference is (Cooper & Schindler, 2014).
Third, interval scales have classification with order and distance but without natural origin. Similar to ordinal scales, interval scales provide different value to each number yet the difference must be equal between one pair of numbers to another (Cooper & Schindler, 2014).
Last, ratio scales which is the most powerful scales among the other measurement scales, have all classification, order, distance, and natural origin. Moreover, ratio scales is also an absolute zero or meaningful zero measurement, where zero in this measurement means nothing at all. In ratio, one number can be multiplied or divided with other number. For example, a man or woman with age 20 years old is twice older than a man or woman with the age of 10 (Cooper & Schindler, 2014).
In this research authors use ratio scale since all the data to be processed are numeric and has a meaningful zero condition where zero means nothing or does not have any value. In this research if there is a zero in bid-ask spread, depth, trading volume, and trading time during the window period, it means there is no difference between bid and ask spread, no queue in the order book, no transaction happen at all in a single day, or no activity in Indonesia Stock Exchange respectively.
Based on Cooper and Schindler (2014), source of data are grouped into three levels of categories. First, primary sources are data gathered by the authors themselves directly from the original source without any interpretation. Primary data has not yet been interpreted by other parties which make it the most convincing. Second, secondary sources are the interpretation of primary data which indicates data gathered by other people for other purpose. Secondary sources most likely are collected from internet, books, magazine, official journals, official articles, and etc. However, annual report is seen as primary source since it represent official situation of a company. Third, tertiary source is like secondary source, yet it is most represented by bibliographies, indexes, and etc (Cooper & Schindler, 2014).
Some of the advantages of primary source are the data is specific to that particular study author
wants to analyze, no doubt of the data’s quality,
possibility to add data during researching. However, primary source also has disadvantages such as the author have to put extra time and effort to collect the data all by himself, make sure the data is not biased and fake or even useless, and the process in gathering the data might be costly. Moreover, secondary source also has its own advantages and disadvantages. The advantages of secondary source are less difficulty in collecting the data, less expensive compared to primary data, and the quality of the data is not direct responsibility of the author. On the other hand, the disadvantages of the secondary source are the author could not get the specific data required for the study, unable to determine the quality of the data, less possibility to put additional data (Secondary Data, 2013).
All sources of data have different value. Based on the source level, primary source has more value than secondary source, while secondary source has more value than tertiary source (Cooper & Schindler, 2014). In this study, authors use secondary data which are gathered from IDX official website, and other relevant websites.
Authors collected the data through documentation and literature review. Documentation is taking a note of all relevant information regarding
the authors’ topic. The information is related with bid
-ask spread, depth, trading volume, and trading time. Literature review is exploring existing journals, articles, books, and other media related to the study.
458 sample as some of the elements within the population that represent the entire population. Lastly, sample frame is the list of all population elements that are going to be analyzed by the researchers (Cooper & Schindler, 2014).
The reasons why authors decided to choose sample are lower cost, greater accuracy of results, greater speed of data collection, and availability of population elements. Based on its approach, sampling designs are categorized into two types, probability sampling and nonprobability sampling. In nonprobability sampling, each individual or object does not have equal chance to be included as participants, while probability sampling provides random selection which makes each individual or object has equal chance to be selected (Cooper & Schindler, 2014).
Nonprobability sampling itself can be divided into three, which are convenience, purposive, and snowball. Convenience sampling is the cheapest and easiest to conduct since researchers only focus on subjects that are easily reached. However, this type of sampling gives bias results due to the least variety of subjects. Furthermore, purposive sampling can be also divided into two, which are judgment sampling and quota sampling. Judgment sampling is done by selecting sample members that have experienced in that particular area of study, while quota sampling is done by considering the distribution ratio to the samples selection. Lastly, snowball sampling is done by taking samples through referral networks. With this technique, respondents give referral to other possible respondents with similar characteristics (Cooper & Schindler, 2014).
Probability sampling can be divided into two, simple random sampling and complex random sampling. Simple random sampling is the purest probability sampling where each individual or object has equal chance to be selected. However, since simple random sampling is difficult to be conducted due to unavailability of data and costly in both time and money, complex random sampling was introduced. Complex random sampling has more efficiency and more accurate precision due to its smaller size. There are four approaches of complex random sampling. First, systematic sampling, is taking the sample of every xth element in the population. The xth element can be calculated by dividing the population size with the sample size. Second, stratified sampling, where the population is separated into different strata and simple random sampling is applied within each stratum. With ideal stratification, each stratum is internally homogenous and externally heterogeneous. There are two ways to allocate the total sample of stratum, proportionate sampling and disproportionate sampling. Proportionate stratified sampling is conducted by drawing sample size of the stratum that is
proportionate to the stratum’s share of total
population. In contrast, disproportionate stratified sampling is conducted by drawing sample size of the
stratum that is not based on the stratum’s share of
total population. Third, cluster sampling also divides population into several groups. However, unlike stratified sampling, cluster sampling has many subgroups yet few elements in it. Furthermore, in cluster sampling, each subgroup is internally heterogeneous and externally homogeneous. Last but not least, double sampling or sequential sampling is a process of sampling samples from stratified or cluster designs to be used for further studies (Cooper & Schindler, 2014).
Considering all approaches in sampling methods, authors chose to use purposive judgment sampling since the data is not randomly selected but it is chosen through certain criterion. The window period is determined to be 15 working days before and after the event took place, excluding holiday, joint holiday, and the event itself. The reason why authors choose 15 working days is to avoid bias results in short term and other irrelevant factors in long term. If the window period is too narrow, this study might not be able to reflect the effect of the changes, while if the window period is too wide, corporation actions would exclude more of the samples that could be used by the authors. Previous studies by Satiari (2009), which analyzed the effect of changes in tick price which occurred in 2007, used ten days, from 2 January 2007 to 15 January 2007, as its window period. Within 493 stocks listed in Indonesia Stock Exchange during the window period which is from 10 December 2013 until 28 January 2014, there are some to be excluded by the authors to meet the criteria. Criteria for the exclusion are as follows:
Stocks must be listed in Indonesia Stock Exchange during the window period. Stocks that are not listed since the beginning of the window period, or removed before the end of the window period will be omitted since it cannot be used in the comparison.
Stocks must be categorized as actively traded stocks. It must be traded every day during the window period. Actively traded stocks are listed and traded every single day as Booth, Lin, Martikainen, and Tse (2002) also stated that the most active stocks should have many buyers and sellers whom ready to trade every day. Therefore, stocks which have no transaction in a single day will be excluded from the sample.
459 company triggered either mandatory or non-mandatory by the issuer which affect the position of its stocks. Cash dividend distribution, stocks dividend distribution, right issue, stock split, merger, and acquisition are the examples of corporate actions (Heakal, 2013).
Lastly, after determining the population and sampling method, authors would like to decide the proper number of sample size for this study. Sample size is the number of elements that represent the population appropriately as in Maholtra and Birks (2006). Moreover, Pallant (2005) stated that for paired sample t-test the adequate sample size is higher than 30. In computing the exact amount of sample size, authors used the formula developed by Pallant (2005).
where denotes the sample size and denotes the number of the independent variables. This study has four variables which are bid-ask spread, depth, trading volume, and trading time. Thus, the sample size required is above 82.
This study used secondary source as to gather the main data that is taken from Indonesia Stock Exchange official website. Therefore, there is no validity and reliability test needed to justify the data. Instead, authors would like to use five factors in evaluating website based on Cooper and Schindler (2014). The five factors are purpose, scope, authority, audience, and format. First, the purpose of the website is to inform all parties related to stock market, specifically investors and traders, about current and historical performance about every stock listed in the bourse. Second, the scope of the website is very wide since it can be accessed by the entire Indonesian people. The main data gathered is about the detail of 493 stocks listed in the bourse which consist of the last bid and ask price, number of lot queue on order book, trading volume, trading frequency, last price, beginning price, previous price, and some other data regarding the stock. The website also provides the information about the vision and mission of IDX, historical background of IDX, all indexes in the bourse, and etc. The information is available both in Indonesian and English language and updated every single day (Bursa Efek Indonesia, 2010).
Third, the authority of this website belongs to the government specifically under the Ministry of Finance. Ministry of Finance is the one who also manage Indonesian Stock Exchange activity as a whole. On the other hand, the data gathered in this website were from historical data of every stock. Thus, the credential of the authors is undoubtedly trustworthy. Fourth, the audience of the website is essentially for all Indonesian people specifically those who are interested in finance and stock market, and
also foreign investors. Fifth, the format of the website is very helpful because the information has been structured appropriately. It also affords complete information needed regarding stock market and provides search engine to make ease the user in finding what they wants. However, authors found difficulty in downloading the data. The download engine is unable to cover more than one day at a time. Thus, the authors need to do repetitive download to collect the data for all 30 days.
In conclusion, website that is used by the authors, Indonesia Stock Exchange official website, is unquestionable. From all five factors in evaluating website, according to Cooper and Schindler (2014), IDX official website fulfills all criterions.
In this study, authors would like to analyze the effect of changes in tick price and lot size on bid-ask spread, depth, trading volume, and trading time in Indonesia Stock Exchange. These changes took place on 6 January 2014, so authors would like to measure the condition of each variable before and after the event using Paired Sample T-test or Wilcoxon test. Thus, there are several test needs to be done such as normality test before conducting Paired Sample T-test or Wilcoxon test.
The most appropriate assumption test for this study is normality test. Based on Ghozali (2013), screening in normality test is the first step for all multivariate analysis. The aim of normality test is to check whether the data normally distributed which means the difference between the prediction value and the actual score or error that will be symmetrically distributed around the means equals to zero (Ghozali I. , 2013).
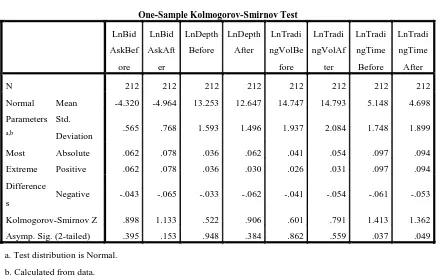
One of the tools that can measure normality is One Sample Kolmogorov-Smirnov test. One Sample Kolmogorov-Smirnov test showed the Asymp. Sig. (2-tailed) for both before and after the event. As long as the p-value is higher than 0.05, then the data is normally distributed.
460 significant difference between data before and after the event (Sufren & Nathanael, 2014).
Another alternative if the data is not normally distributed is Wilcoxon test. Similar to Paired Sample T-test, Wilcoxon test is also a test that compares the means of two associated groups to distinguish whether there are any significant differences among the means. This test provides three different tables compare to Paired Sample T-test. The first table is Descriptive Statistic which shows the mean, standard deviation, minimum and maximum score of pre-test and post-test. The second table is Ranks which show the number of data that has negative, positive, or ties post-test mean. The third table is Test Statistics which shows Asymp. Sig. (2-tailed) to determine whether there is a significant impact or not (Sufren & Nathanael, 2014).
RESULTS AND DISCUSSION
Authors collected the data from secondary sources which are the official website of Indonesia Stock Exchange and Kustodian Sentral Efek Indonesia. All the details needed for the calculation of the stocks such as daily stock listed, closing bid and ask price, closing bid and ask volume, trading volume, and trading frequency were gathered from the official website of Indonesia Stock Exchange, while the details regarding corporate actions occurred between the window period were gathered through Kustodian Sentral Efek Indonesia. Both websites are official, managed by trustable parties, and generally used by Indonesian people. PT. Bursa Efek Indonesia, under the management of Ministry of Finance, governs the Indonesia Stock Exchange website, whereas PT. Kustodian Sentral Efek Indonesia governs the KSEI website. Besides, authors have also justified the sources using five factors in evaluating website based on Cooper and Schindler (2014). Therefore, the secondary data used in this study is valid and reliable.
Since the objectives of this study is to analyze the impact of a particular event toward the variables before and after, authors decided that the most appropriate assumption test to analyze the distribution of the data is One Sample Kolmogorov Smirnov Test, while the statistical test to analyze the significant difference is Paired Sample T Test for normally distributed data, and Wilcoxon Test for non normally distributed data (Sufren & Nathanael, 2014).
The population of 493 stocks must be filtered to get the appropriate samples to answer the research objectives of this study. There are three criteria for authors to choose the samples. The first criterion is that all stocks should be listed during the whole window period which is 10 December 2013 until 28 January 2014. Thus, when authors measure the mean of the stocks it could be comparable one to another. In order to select the stocks that pass the first criterion,
authors compare all stocks listed in Indonesia Stock Exchange at the beginning of window period with all the stocks listed at the end of window period. Authors discovered that there are in total nine stocks need to be deleted from the population since it is not listed through the whole window period. Those stocks are ASMI, BINA, CANI, KARK, LEAD, PNBS, SIDO, SSMS, and TALF. Out of these nine stocks only KARK was delisted from the bourse, while the rest were newly registered in Indonesia Stock Exchange. From the first criterion, the population has shrunk to 484 stocks.
The second criterion is to choose stocks that are actively traded. By actively traded, it means the stocks are traded every single day during the window period. Thus, authors need to separate stocks which are actively traded and which are not. In order to do so, authors filtered and eliminated stocks which have zero trading volume during the window period. Later, authors discerned that there are 263 stocks should be deleted because it did not pass the second criterion as the actively traded stocks. From the second criterion, the population has shrunk to 221 stocks.
The third criterion is to avoid stocks that are affected by corporate actions during the window period. Corporate action is any event conducted by the company that has direct impact to the stock performance such as stock split, right issue, distribution of dividend, and merger and acquisition. Authors, collected the necessary data from KSEI (Kustodian Sentral Efek Indonesia ), and then eliminated the stocks that have any corporate action in between 10 December 2013 until 28 January 2014. In total, there are only nine stocks affected by the corporate actions. BBKP, PBRX, BNLI, NIPS are stocks that have the right issue, while ADRO, BWPT, MSKY, MNCN, and BAJA are stocks that distributed the cash dividend. From the third criterion, the population has shrunk to 212 stocks.
In the end, these 212 stocks are used by the authors as the sample of this study. Authors gathered the data of closing bid price, closing ask price, closing bid volume, closing ask volume, trading volume, and trading frequency for the whole 15 days before the event and 15 days after the event. Those data were then calculated using the most appropriate formulas that have been explained before to get the bid-ask spread, depth, trading volume, and trading time of each stock. Afterward, authors calculated the mean of each stock before and after the event in order to be analyzed using statistical test.
461 transform the data to avoid any misleading result and to make the data fit the assumptions better. There are many common ways to transform the data such as log transformation or square-root transformation. Authors decided to choose natural log transformation to normalize the data because it is the most appropriate for this study which analyzes the changes in the position of each stock. Without log scale transformation, the increasing stock price from Rp 100 to Rp 110 and from Rp 100,000 to Rp 110,000 will give Rp 10 and Rp 10,000 changes respectively, which cause the data to be not normal, but with log scale transformation, the increasing stock price from Rp 100 to Rp 110 and from Rp 100,000 to Rp Sample Kolmogorov-Smirnov Test for all variables used in this study.
Table 4 One Sample Kolmogorov-Smirnov Test All Variables
Based on the result of the table, authors could conclude that the log data of bid-ask spread, depth, and trading volume are normally distributed since the most extreme difference absolute is lower than the non-normally distributed because the most extreme difference absolute is higher than the 0.093 (Dn,a) and
the significance value is lower than 0.05 (α). Thus, the log data of trading time was tested statistically using Wilcoxon Test.
After conducting assumption tests and statistical tests, authors would like to confirm the hypotheses with the results and relate it to several previous studies which have been explained before. There are in total four hypotheses to be confirmed in this study.
Based on the table 4.2 below, authors proved the first hypothesis (H1) of the research that there is a
significant difference between bid-ask spread before and after the changes of tick price and lot size in Indonesia Stock Exchange because t-statistics is higher than 1.96 and the p-value is lower than 0.05, which indicates that there is a significant decrease in the bid-ask spread which improves the stock liquidity.
Chung and Chuwonganant (2004) mentioned that new regulations that reduce the tick price required traders to compete which resulted in smaller bid-ask spread. In other words, when tick price decrease, the willingness for traders to either buy or sell stocks
Table 5 Result of Paired Sample Statistics Bid-Ask Spread significantly decreased (Ronen & Weaver, 1998).
Moreover, a research by Satiari (2009) also confirms the results of the hypothesis. Satiari (2009)
conducted a research with the title of “Analisa
Perbedaan Sistem Fraksi Harga Saham terhadap Variable Bid-ask spread, Depth, dan Volume
Perdagangan”. This study analyzed the case happened
on 2 January 2007, when the government decided to reduce the tick price from Rp 5 to Rp 1 for the stock trading at below Rp 200. Satiari (2009) found out that the changes in tick price in 2007 caused a decrease in bid-ask spread (Satiari, 2009).
Based on the table 6 below, authors proved the second hypothesis (H2) of the research that there is a
significant difference between depth before and after Paired Samples Test
T Df Sig. (2-tailed)
Pair 1 LnBidAskBefore –
LnBidAskAfter 17.188 211 .000
462 the changes of tick price and lot size in Indonesia Stock Exchange because t-statistics is higher than 1.96 and the p-value is lower than 0.05, which indicates that there is a significant decrease in the depth.
The reason why depth decreased is because with the lower tick price the more likely the transaction occurs since the traders would tolerate the small gap between bid and ask price. Trades would be more willing to sell at bid price and buy at ask price to execute immediate transaction, rather than queue in the order book. Hence, depth could decrease as the spread are small (Huang, 2000). Furthermore, Niemeyer and Sandas (1994) found out that the changes of tick size in the Stockholm Stock Exchange (SSE) are positively correlated to the market depth. Thus, when the tick size is decrease, depth would also decrease, which supports the results of this study.
Table 6 Result of Paired Sample Statistics Depth
A research by Satiari (2009) showed that the depth is increased significantly due to the changes in tick price and lot size, which contradicted with the results from this study. However, another research by Bollen and Whaley (1999) found out that depth were significantly decreased which supports the results of this study. There are also other similar researches done by Bacidore (1997), Porter and Weaver (1997), Ahn, Cao, and Choe (1998), and MacKinnon and Nemiroff (1999). All those researches were about the decrease in tick price from C$0.125 to C$0.05 for above C$5 stock price in Toronto Stock Exchange in 1996. Overall, results found out that the depth were significantly decreased.
Not only that, Ronen and Weaver (1998) with
the title of “The Effect of Tick Size on Volatility,
Trader Behavior, and Market Quality”, analyzed the case happened on 7 May 1997, when AMEX (American Stock Exchange) reduced the tick price from $1/8 to $1/16 for all stocks. The result from Ronen and Weaver (1998) found out that depth were significantly decreased (Ronen & Weaver, 1998).
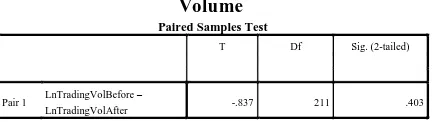
Based on the table 7 below, authors could not prove the third hypothesis (H3) of the research that
there is a significant difference between trading volume before and after the changes of tick price and lot size in Indonesia Stock Exchange because t-statistics is in between -1.96 and 1.96 and the p-value is higher than 0.05, which indicates that there is no significant difference in the trading volume before and after the event.
There are several reasons that caused trading volume to be insignificant. Ryan and Taffler (2004) suggested that trading volume activity and stock price
are significantly generated by internal firm performance such as firm formal accounting releases because traders, investors, and other financial market participants are driven by fundamental information and not by fads or other prior news releases (Ryan & Taffler, 2004).
The effect of changes in tick price and lot size toward trading volume should take longer time be examined. Trading volume changes due to the changes in trading costs, however traders would not directly respond to the changes. Thus, longer window period is needed in order to analyze the effect toward trading volume. (Harris, 1997). Moreover, Huson, Kim, and Mehrotra (1997) stated that there were no study has ever proof trading volume was significantly changed.
Table 7 Result of Paired Sample Statistics Trading Volume
The result of this trading volume confirms the previous research conducted by Lau and McInish (1995) who found out that after Stock Exchange of Singapore decreased the tick price from 50 cent to 10 cent for above SGD 5 stock price in 1994, trading volume remained the same. Ronen and Weaver (1998) also found out that trading volume was insignificantly increased due to the changes in tick price of American Stock Exchange from $1/8 to $1/16 for all the stocks in 1997. In addition, Bacidore (1997), Porter and Weaver (1997), Ahn, Cao, and Choe (1998), and MacKinnon and Nemiroff (1999) researched about the decrease in tick price from C$0.125 to C$0.05 for above C$5 stock price in Toronto Stock Exchange in 1996 and found out that trading volume stayed the same.
In Indonesia, Nugroho (2006) conducted a
research with the title of “Pengaruh Perbedaan
Hubungan Fraksi Harga Saham Baru Terhadap Variabel Bid-ask spread, Depth, dan Volume
Perdagangan”. It analyzed the case happened on 3
January 2005, when the government reduced the tick price from Rp 25 to Rp 10 for the stocks trading at between Rp 500 and Rp 2,000. Then, Nugroho (2006) found that trading volume was not significantly influenced.
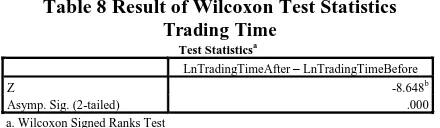
Based on the table 8 below, authors proved the fourth hypothesis (H4) of the research that there is a
significant difference between trading time before and after the changes of tick price and lot size in Indonesia Stock Exchange because z-value is lower than -1.96 and the p-value is lower than 0.05, which indicates that there is a significant decrease in the trading time.
The decrease in trading time happened because when tick size was reduced, trading frequency would Paired Samples Test
T Df Sig. (2-tailed)
Pair 1 LnDepthBefore –
LnDepthAfter 10.469 211 .000
Paired Samples Test
T Df Sig. (2-tailed)
Pair 1 LnTradingVolBefore –
463 increase and eventually improved the market liquidity. When trading frequency was boosted, it would diminish the trading time as trading time equals to working hours divided by trading frequency (Chordia, 2012).
Table 8 Result of Wilcoxon Test Statistics Trading Time
The result of this trading time confirms the previous research conducted recently by Chandra (2015) who conducted a research with the title of
“Pengaruh Perubahan Fraksi Harga dan Satuan
Perdagangan terhadap Likuiditas Bursa Efek
Indonesia”. Similar to this study, it analyzed the case
happened on 6 January 2014, when the government imposed the new regulation regarding the tick price and lot size. Chandra (2015), then, found out that the changes in tick price and lot size significantly decreased the waiting time.
CONCLUSION
This study analyzed the effect of changes in tick price and lot size on bid-ask spread, depth, trading volume, and trading time as the variables of liquidity in Indonesia Stock Exchange. The new regulation which reduced the tick price and lot size as written in
“Surat Keputusan Direksi PT. Bursa Efek Indonesia
Kep-00071/BEI/11-2013” took place on 6 January 2014.
This study has four research objectives that will
be connected with the research’s results from the
previous chapter. The objectives are to analyze whether there is a significant mean difference between each variable before and after the changes in tick price and lot size. Authors found out that bid-ask spread, depth, and trading time have significant mean difference before and after the event, while trading volume has no significant mean difference before and after the event. Based on the analysis, mean bid-ask spread was significantly decreased by 47.7% after the changes. Same goes with depth which was also significantly decreased by 45.4%. On the other hand, mean trading volume was insignificantly increased. Lastly, mean trading time was significantly increased by 36.8% after the changes. Therefore, authors have achieved all the objectives to analyze the effect of the new regulation by the government.
Authors realized that there are three limitations in developing this research, which are:
As previously mentioned in chapter three, the window period of this study is limited to 30 working days only which consist of 15 working days before and 15 working days after the changes took place.
There is no definite period of how long should the authors analyze the effect of the changes. Therefore, authors tried to refer from previous researches which also analyzed the similar event. Most of the previous researches used 10 up to 30 working days as the window period to avoid any other factors that might affect the variables such as corporate actions from the companies. The longer the window period is, the smaller the samples are, since more companies would be affected by corporate action. Thus, more samples will be eliminated because it is not fulfilling the criteria three.
The topic about the effect of changes in tick price and lot size has been rarely conducted by domestic researchers even though the government of Indonesia has implemented this kind of regulation for several times. Thus, authors found out that it was relatively difficult to find relevant references and supporting journals for the authors to confirm or compare the results.
It was complicated for the authors to explain about the effect of changes in tick price and lot size toward the variables of stock liquidity due to the limited availability of the theories. Even in the previous studies there are barely enough references that refer back to the theories. Thus, to support the research, authors are most likely to use previous
studies’ results in explaining the relations between the
changes in tick price and lot size and bid-ask spread, depth, trading volume, and trading time.
Authors realized that there are four suggestions that could be considered in developing further researches, which are:
As stated above, the window period of this study is narrow since authors refer to the previous studies. Further research could analyze the effect of the changes using wider window period for instance 60 days, 90 days, or 150 days to check and compare the results between each window period. This could help the government in determining how long the new regulation start to affect the variables, and how long until other factors start to affect the variables.
This study combined all the stocks in Indonesia Stock Exchange regardless of its industry. Authors suggest further researches to differentiate the results based on each industry, to enable the government to evaluate which industries are affected by this new regulation the most.
As mentioned above, authors used the most common four variables of stock liquidity. Thus, for further research, authors advise to increase the variables with the likes of turnover, volatility, turnover ratio, and illiquidity ratio in order to complete the measurements of the stock liquidity. Test Statisticsa
LnTradingTimeAfter – LnTradingTimeBefore
Z -8.648b
Asymp. Sig. (2-tailed) .000
464
REFERENCES
Allen, D. E., & Sudiman, J. (2009). Does Tick Size Change Improve Liquidity Provision? Evidence from the Indonesia Stock Exchange. FEMARC Working Paper Series , 1.
BEI Menyatakan Siap Terapkan Fraksi Baru. (2014, January 6). Retrieved March 3, 2015, from Koran Jakarta: http://www.koran-
jakarta.com/?2590-bei%20menyatakan%20siap%20terapkan%2 0fraksi%20baru
Bursa Efek Indonesia. (2010). History. Retrieved February 21, 2015, from IDX:
http://www.idx.co.id/en-us/home/aboutus/history.aspx
Bursa Efek Indonesia. (2010). Buku Panduan Indeks 2010. Retrieved March 21, 2015, from IDX:http://www.idx.co.id/Portals/0/Informat ion/ForInvestor/StockMarketIndicies/FileDo wnload/Buku%20Panduan%20Indeks%2020 10.pdf
Bursa Efek Indonesia. (2010). Indeks Pasar. Retrieved
March 21, 2015, from IDX:
www.idx.co.id/id-id/beranda/informasipasar/indekspasar.aspx Bursa Efek Indonesia. (2010). Visi dan Misi.
Retrieved March 3, 2015, from IDX:
www.idx.co.id/id-id/beranda/tentangbei/visidanmisi.aspx Chandra, W. (2015). Pengaruh Perubahan Fraksi
Harga dan Satuan Perdagangan terhadap Likuiditas Bursa Efek Indonesia. Skripsi , 1-45.
Chordia, T. (2012). Tick Size Regulation. UK Government's Foresight , 14.
Cooper, D. R., & Schindler, P. S. (2014). Business Research Methods. New York: McGraw-Hill.
Flemming, M. J. (2003). Measuring Treasury Market Liquidity. Federal Reserve Bank of New York , 85.
Ghozali, H. I. (2013). Aplikasi Analisis Multivariate Dengan Program IBM SPSS 21. Semarang: Badan Penerbit Undip.
Harris, L. (1997). Decimalization: A Review of the Arguments and Evidence. 12-21.
Heakal, R. (2013). What Are Corporate Actions? Retrieved April 22, 2015, from Investopedia: http://www.investopedia.com/articles/03/081 303.asp
Huang, R. D. (2000). Tick Size, Bid-Ask Spreads and Market Structure. 1.
Lau, S. T., & McInish, T. H. (1995). Reducing Tick Size on Stock Exchange of Singapore. Pacific Basin Finance Journal 3 , 485-496. May, E. (2012, December). Lot Satuan Dalam Jual
Beli Saham. Retrieved March 14, 2015, from ilmu-investasi:
http://www.ilmu- investasi.com/2012/12/lot-satuan-dalam-jual-beli-saham.html
McDonald, J. H. (2014). Handbook of Biological Statistics (3rd ed.). Baltimore, Maryland: Sparky House Publishing.
Nugroho, B. A. (2006). Pengaruh Perbedaan Hubungan Fraksi Harga Saham Baru Terhadap Variabel Bid-Ask Spread, Depth, dan Volume Perdagangan. Usulan Penelitian untuk Thesis , 2-66.
Perubahan Lot Size dan Tick Price BEI: Seluruh AB Sudah Siap. (2014, January 6). Retrieved March 3, 2015, from Jurnal Asia: http://www.jurnalasia.com/
2014/01/06/perubahan-lot-size-dan-trick-price-bei-seluruh-ab-sudah-siap/
Porter, D. C., & Weaver, D. G. (1997). Tick Size and Market Quality. Financial Management , 5-26.
Ronen, T., & Weaver, D. G. (1998). The Effect of Tick Size on Volatility, Trader Behavior, and Market Quality. 2-22.
Ryan, P., & Taffler, R. D. (2004). Are Economically Significant Stock Returns and Trading Volumes Driven by Firm-specific News Release? Journal of Business Finance & Accounting , 60-64.
Satiari, F. (2009). Analisa Perbedaan Sistem Fraksi Harga Saham terhadap Variable Bid-Ask Spread, Depth, dan Volume Perdagangan. Tesis , 1-76.
Secondary Data. (2013). Retrieved March 25, 2015, from Management Study Guide: http://www.managementstudyguide.com/sec ondary_data.htm
Sufren, & Nathanael, Y. (2014). Belajar Otodidak SPSS Pasti Bisa. Jakarta: PT. Elex Media Komputindo.
Trochim, W. M. (2006, October 20). Data Type. Retrieved March 25, 2015, from Social
Research Method:
http://www.socialresearchmethods.net/kb/dat atype .php
Wyss, R. V. (2004). Measuring and Predicting Liquidity in the Stock Market.5