Comparison of Yacon (
Smallanthus sonchifolius
) Tuber
with Commercialized Fructo-oligosaccharides (FOS)
in Terms of Physiology, Fermentation Products and
Intestinal Microbial Communities in Rats
Ni Wayan Arya UTAMI1, Teruo SONE1, Michiko TANAKA1, Cindy H NAKATSU2, Akihiko SAITO3 and Kozo ASANO1*
1 Laboratory of Applied Microbiology, Division of Applied Bioscience, Graduate School of Agriculture, Hokkaido University,
Kita 9 Nishi 9, Kita-ku, Sapporo 060-8589, Japan
2 Department of Agronomy, Purdue University, West Lafayette, Indiana 47907-2054, USA
3 Hokkaido Bio-Industry Corporation, 7–14–3–43 Hiragishi, Toyohira-ku, Sapporo 062-0937, Japan
Received May 24, 2013; Accepted July 1, 2013
The yacon (Smallanthus sonchifolius) tuber was examined with regard to its prebiotic effects compared with commercialized fructo-oligosaccharides (FOS). A feed containing 10% yacon tuber, which is equivalent to 5% commercialized FOS in terms of the amount of fructo-oligosaccharides (GF2, GF3 and GF4), was administrated to rats for 28 days. The yacon diet changed the intestinal microbial communities beginning in the irst week, resulting in a twofold greater concentration of cecal short-chain fatty acids (SCFAs). The SCFA composition differed, but the cecal pH in rats fed yacon tuber was equal to that in rats fed FOS. Serum triglycerides were lower in rats fed yacon compared with rats fed FOS and the control diet. Cecal size was greater with the yacon tuber diet compared with the control diet. The abundant fermentation in the intestines created a selective environment for the intestinal microbiota, which included Lactobacillus acidophilus, Biidobacterium pseudolongum, Biidobacterium animalis and
Barnesiella spp. according to identiication with culture-independent analysis, 16S rRNA gene PCR-DGGE combined with cloning and sequencing. Barnesiella spp. and B. pseudolongum were only found in the rats fed the yacon diet, while L. acidophilus and B. animalis were found in abundance in rats fed both the yacon and FOS diets. The genus
Barnesiella has not previously been reported to be associated with yacon or FOS fermentation. We concluded that the physiological and microbiological effects of the yacon tuber were different from those of FOS. Differences in cecal size, blood triglycerides and microbial community proiles including their metabolites (SCFAs) between the yacon tuber and FOS were shown to be more greatly affected by the yacon tuber rather than FOS.
Key words: intestinal microbes, Smallanthus sonchifolius, yacon, DGGE, fructo-oligosaccharides
INTRODUCTION
The beneicial health effects of prebiotics have led to increasing studies of microbial ecology in human and animal guts in order to better understand the links between food, gut microbiota and overall health [1]. Two approaches are being used to include prebiotics in the diet. One is to add prebiotic compounds to commonly consumed foods [2]. The other is to include functional foods, food naturally containing high concentrations of
prebiotics, in the diet [3–5]. Fructose polymers are a group of prebiotics that can be divided into long-chain oligofructose, commonly found in chicory [6] and artichoke [7, 8], and short-chain oligofructose, which is found in the yacon tuber [9]. Inclusion of these foods in diets has been reported to promote the growth of beneicial gut microbes, such as Biidobacteria and Lactobacilli, and to increase short-chain fatty acid (SCFA) production in the cecum. Use of the yacon tuber as a functional food is gaining interest because it contains antioxidants [10– 14], and a high fraction of its dry biomass is composed of prebiotic compounds, fructo-oligosaccharides (FOS, inulin-type oligofructans) [15–17].
The yacon (Smallanthus sonchifolius) is a plant originally from the Andean region of South America and has been cultivated in Japan, New Zealand, Europe *Corresponding author. Mailing address: Kozo Asano, Laboratory
and Brazil. Its large tuberous roots are often treated as a “fruit” because of their juicy and sweet taste [18, 19]. In Andean native medicine, the yacon tuber is consumed fresh or cooked or in infusions made from dried leaves by people suffering from diabetes, digestive disorders and/ or renal disorders [18]. There have been a few studies on the potential use of the yacon tuber as a prebiotic using in vitro [20] and in vivo rat [21] and guinea pig [9] model systems. Human and animal studies have shown beneicial effects of eating yacon tubers including accelerated colonic transit time in healthy individuals [22], increased defecation frequency and satiety sensation in obese and slightly dyslipidemic pre-menopausal women [23], hypolipidemic [24], immunomodulatory [21] and improvement of iron bioavailability [25–27]. These effects may be either directly or indirectly related to the prebiotic stimulation of the growth of beneicial bacteria and production of fermentation products [21, 27, 28]. However, studies of yacon tuber effects on intestinal microbiota have relied mainly on culture dependent-methods that targeted only a few bacterial groups in the cecum [9]. Up to now, there has been no study using a culture-independent method to determine the in vivo effect of yacon tuber on intestinal microbiota compared with commercialized FOS.
Due to the potential beneits of using the yacon tuber as a functional food, there is a need to obtain greater understanding of the relationship between fructo-oligosaccharides and other components in the yacon tuber with gastrointestinal health. The objective of this study was to investigate the effects of yacon tuber in the rat diet on host physiology, fermentation products and gut microbial communities. Factors that were measures that are indicative of improved rat health from prebiotics included cecal weight, short-chain fatty acids (SCFAs), pH in cecal digesta and serum total cholesterol, triglycerides and lipoproteins. The changes in the gut microbial communities were characterized using 16S rRNA gene PCR-DGGE ingerprint proiles and nucleotide sequencing of some of the bands.
MATERIALS AND METHODS
Fruit materials and chemicals
Yacon powder was prepared in Hokkaido Bio-Industry, Sapporo, Japan. The powder was stored at room temperature in a resealable box containing silica gel. The yacon tuber powder used in this study contained 650 mg of polymerized fructans (as fructo-oligosaccharides) per gram of lour as the main storage sugar. It also contained soluble dietary iber (239 mg/g lour). It contained very
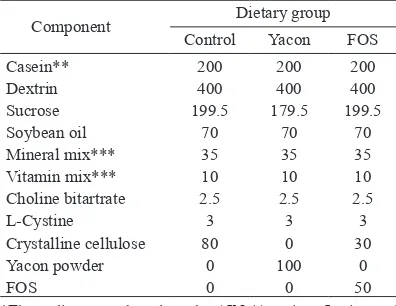
little resistant starch (3 mg/g lour) as well as total phenolic acid (0.5 mg GAE equivalent/g lour). Puriied fructo-oligosaccharide (FOS) composed of 1-kestose (GF2), nystose (GF3) and 1-β- fructofuranosyl nystose (GF4) was obtained from Wako Pure Chemical Industries, Osaka, Japan. Resistant starch and nonresistant starch levels were determined using a Resistant Starch Assay Kit following the procedure described by the manufacturer (K-RSTAR; Megazyme International Ireland Ltd, Bray, Wicklow, Ireland). FOS content was determined using high-pH-anion-exchange-chromatography (HPAEC-PAD) according to Hogarth [29] with the exception that only 1% (w/v) yacon tuber powder was used and the mesh-bottomed cages and maintained at 22 ± 2°C with a relative humidity of 40−60% and a 12 hr light–dark cycle. After a ive-day acclimation period, rats were divided into one of three dietary groups (n=6/group) based on body weight to ensure there were no signiicant differences in average body weights between groups at the beginning of the experiment. Diet composition was based on the AIN-93G semi-puriied rodent diet (Table 1) [30] with the iber and starch sources varied between the three different diet treatments. The yacon diet contained 10% yacon tuber powder, which was equivalent to 5% fructo-oligosaccharides, the FOS diet contained 5% reagent fructo-oligosaccharides, and the control diet contained 8% cellulose. Diet treatments were 20–25 g food per day and water provided ad libitum for 28 days. Rat body weight and food intake were recorded daily. All experiments were in accordance with the guidelines of the Hokkaido University ethics committee for the care and use of the laboratory animals.
Sample collection
Serum lipid assay
Blood samples were collected from the jugular vein and put into centrifuge tubes without an anticoagulant. After 2 hr at room temperature, serum was collected by centrifugation at 1,500 × g for 30 min. The serum was stored at −80°C until assayed. Serum total cholesterol (TC), triglyceride (TG) and high-density lipoprotein (HDL) cholesterol concentrations were analyzed enzymatically using lipid proile reagent kits (Wako Pure Chemical Industries, Osaka, Japan). The very-low-density lipoprotein (VLDL) cholesterol concentration was calculated using the formula TG/5 [31]. The low-density lipoprotein (LDL) cholesterol concentration was determined using the formula TC-HDL-VLDL [31].
Short-chain fatty acids (SCFAs) and pH
Samples for measurement of SCFAs and pH were taken from the frozen cecal contents of each rat. After thawing, 0.5 g of cecal contents was diluted 5-fold with sterile distilled water and homogenized using a bead shocker (Yasui Kikai, Osaka, Japan) (2,500 rpm, 4°C, 2 min). The pH value of the homogenates was measured using a semiconducting electrode (ISFET pH meter KS701, Shindengen Electric Manufacturing Co., Ltd., Tokyo, Japan) [32]. One milliliter of the homogenate was transferred to a micro centrifuge tube. After centrifugation at 15, 000 × g for 10 min at 4°C, 500 µL of supernatant was taken, and then100 µL of 50 mM NaOH and 500 µL of chloroform was added into the supernatant. After centrifugation at 15,000 × g for 10 min at 4°C, 450 µL of the upper layer was collected and stored at −80°C overnight. Samples were defrosted and recentrifuged
at 15,000 × g for 10 min at 4°C, and the supernatant (200 µL) was then iltered through a cellulose acetate ilter (Φ 0.20 μm; DISMIC-13cp, Toyo Roshi Kaisha, Tokyo, Japan) (ADVANTEC) [33]. This supernatant was used to analyze SCFAs and other organic acids by high-performance liquid chromatography (HPLC). Eight organic acids (succinate, lactate, acetate, propionate, i-butyrate, n-butyrate, i-valerate and n-valerate) were measured using an HPLC (JASCO, Tokyo, Japan) equipped with two Shodex RSpak KC-811 columns (Φ 8 mm × 30 cm long; Showa Denko, Tokyo, Japan), and a guard column (Shodex RSpak KC-G, Showa Denko, Tokyo, Japan). The mobile phase used was 5% acetonitrile in 3 mM HClO4; the low rate was 1.0 mL/min, and the
column temperature was 55°C. The post-column reaction solution was comprised of 0.2 mM bromothymol blue and 1.5 mM Na2HPO4.12H2O. The reaction solution
low rate was 1.5 mL/min. The detector was a multi-wavelength detector set at 430 nm (MD-1510; JASCO, Tokyo, Japan) [34].
Statistical analysis
Data are presented as means of n experiments with the standard error (means ± SE). Statistical data processing was performed with XLSTAT (http://www.xlstat.com) using the Student’s t-test. P values less than 0.05 were considered to be signiicant. F-values were conirmed before the analysis.
Microbial community analysis: DNA extraction and PCR Prior to DNA extraction, fecal samples from each rat were homogenized using a mortar and pestle. Frozen cecal contents were thawed and homogenized by mixing several times with a sterile stainless steel spatula in a micro centrifuge tube. Genomic DNA was extracted using Extrap Soil DNA Kit Plus ver. 2 (JB 21, Tsukuba, Japan) according to the manufacturer’s protocol, with the exception that 100 mg of homogenized cecal and fecal samples rather than 500 mg of soil was used and cell disruption was performed using a bead shocker at 2,500 rpm for 2 min instead of a FastPrep instrument. DNA was quantiied using a Beckman spectrophotometer (DU 640), assessed for quality after 0.8% (w/v) agarose gel electrophoresis (Takara) and stained with ethidium bromide (EtBr). Microbial community structure was determined using denaturing gradient gel electrophoresis (DGGE) of PCR-ampliied 16S rRNA genes using bacterial universal primers for the V3 region, 338f-GC (5′-CGCCCGCCGCGCGCGGCGGGCGGGGGC GGGGGCACGGGGGGACTCCTACGGGAGG CAGCAG-3′, GC clamp is in boldface) and 518r Table 1. Compositions of the experimental diets (g/kg)*
Component ControlDietary groupYacon FOS
Casein** 200 200 200
(5′-ATTACCGCGGCTGCTGG-3′) [35, 36]. Reaction mixtures (50 µL) included 0.5 μM of each primer, Gold PCR Buffer (1X), dNTP Mix (0.2 mM each), 2.5 U of AmpliTaq Gold DNA Polymerase (Applied Biosystems, Foster City, CA, USA), 3.5 mM of MgCl2 solutions,
BSA 0.1%, and DNA template (1 ng). Ampliication was performed (GeneAmp PCR System 9700, Applied Biosystems) using an initial denaturation of 94°C for 5 min followed by 30 cycles of denaturation at 94°C for 1 min, annealing at 55°C for 1 min and extension at 72°C for 1 min, with inal extension at 72°C for 7 min. Quality and quantity of the PCR products was determined by comparison with size markers (100 bp) after separation by 1.5% agarose gel electrophoresis.
Denaturing gradient gel electrophoresis (DGGE)
Equivalent amounts of PCR amplicons were separated by DGGE (DCodeTM Universal Mutation Detection
System; Bio-Rad Laboratories, Hercules, CA, USA). Polyacrylamide gels (8% w/v; 40% acrylamide/bis solution, 37.5:1) in 1X TAE (40 mM Tris, 20 mM Acetate, 1.0 mM Na2-EDTA) were used with denaturing
gradients of 20–60% and 30–50% (where a 100% denaturant contained 7 M urea and 40% (v/v) deionized formamide). To aid in between-gel comparisons, DGGE band migration markers were included on all gels; markers were composed of PCR products of 16S rRNA genes from ive known microorganisms, including Bacteroides thetaiotaomicron JCM 5287, Lactobacillus acidophilus JCM 1927, Ruminococcus productus AHU 1760, Eschericia coli and Biidobacterium breve JCM 1273, that were ampliied independently using the same primers and then combined in equal quantities to make a ladder. Electrophoresis was initiated at 20 V for 10 min and then increased to 200 V for 5 hr. Electrophoresis buffer was maintained at 60°C throughout. Gels were then stained using SYBR Green I nucleic acid stain (Cambrex Bio Science, Rockland, ME, USA), visualized on a UV transilluminator and photographed.
PCR-DGGE ingerprint analysis
The dominant populations (>1%) appear as DGGE bands, and each band theoretically represents a unique population. This information was manually converted into a binary matrix (0/1), and pairwise comparisons of proiles were made using Dice similarity coeficients calculated with the following equation: Sd = 2j / (a+b), where j is the number of bands common to both samples, a is the number of bands in sample A and b is the number the unweighted pair group method with arithmetic mean (UPGMA) cluster analysis [38] based on Dice similarity coeficients [37] using a distance matrix generated with the Windist software [39]. Bootstrap analysis was performed with the Winboot [39] software with 1000 iterations, and clustering analysis was performed with the XLSTAT-Pro 2013 software (Addinsoft, New York, USA). The Dice similarity coeficient was also used for constructing a multidimensional scaling (MDS) diagram, a three dimensional map with artiicial x-, y- and z-axes
where each DGGE ingerprint is placed on one point, in a way that similar samples are plotted together. MDS was performed with BioNumerics software (version 5.01, Applied Maths, Kortrijk, Belgium) [40].
Construction of clone libraries
To obtain more phylogenetically informative sequences, clone libraries were made of almost full-length (–1500 bp) bacterial 16S rRNA genes. Clone libraries were produced from representative samples of feces from week 4 and ceca (n=3/group). The 16S rRNA genes were ampliied using primers 27f (5′-AGAGTTTGATCCTGG CTCAG-3′) and 1492r (5′-GGCTACCTTGTTACGACT T-3′) [41, 42]. PCR was performed using GoTaq Flexi DNA Polymerase PCR (Promega, Madison, WI, USA). The reaction mixture (50 µL) included 0.2 μM of each primer, PCR buffer (1X), dNTP Mix (2 μM each), 1.5 U of GoTaq Flexi DNA polymerase (Promega, Madison, WI, USA), 3.5 μM of MgCl2 solutions and DNA template
DNA sequencing and analysis
Clones were sequenced with forward and reverse M13 primers using a BigDye Terminator v3.1Cycle Sequencing Kit (Applied Biosystems, Foster City, CA, USA). Sequencing reaction products were analyzed on an ABI PRISM 3100 DNA Genetic Analyzer (Applied Biosystems, Foster City, CA, USA). To determine the closest matching type strains, SeqMatch and the RDP database were used [43] (http://rdp.cme.msu.edu/ seqmatch/seqmatch_intro.jsp). The sequences have been deposited into the DNA Data Bank of Japan (DDBJ) under accession numbers AB822938 to AB822978.
RESULTS
Rat body weight, food intake, and food eficiency ratio Addition of both yacon tuber and FOS to the diet was well tolerated by the rats. No gastrointestinal disturbances, diarrhea symptoms and/or any other negative responses, such as abnormal autonomic or central activity, were observed after ingestion of the three diet types throughout the experiment. The average daily
feed intake (DFI), total feed intake for 28 days, weekly weight gain, total weight gain and total food eficiency ratio (FER) did not differ signiicantly between the three experimental groups (p>0.05) (Table 2). Body weight at the beginning of the experimental period did not differ between the three different groups of animals (Table 2). Body weight gradually increased with time in all rats, except at week 4, when weight gain was lower than the previous week. However, in week 4, the average food eficiency ratios of rats that received either yacon tuber or FOS diet (0.40 ± 0.02 and 0.42 ± 0.02) were signiicantly higher than rats that received the control diet (0.36 ± 0.02) (p<0.05).
Cecal content and cecal wall weight
The cecal sizes of rats fed the FOS diet showed a signiicant enlargement compared with rats fed the yacon tuber diet and rats fed the control diet. This enlargement was mainly due to the greater cecal content weight in rats fed FOS (8.1 ± 1.1 g), which was almost two times greater than that of rats fed yacon tuber (4.7 ± 0.3 g). The cecal content weight of rats fed yacon tuber was Table 2. Body weight, food intake, feed eficiency, cecum weight, cecal pH, SCFAs, branched-chain
fatty acids (BCFAs) and organic acid concentrations for 28 days Diets
Control Yacon FOS
Food intake, g/day 22.2 ± 4.2 20.0 ± 3.2 20.9 ± 3.5 Initial body weight, g 113.6 ± 4.7 113.4 ± 6.4 113.5 ± 5.6 Final body weight, g 340.2 ± 23.3 335.4 ± 19.6 357.9 ± 21.8 Body weight change, g 219.4 ± 22.3 222.1 ± 15.4 243.3 ± 18.0 Total food intake, g/4 weeks 620.9 ± 40.9 555.4 ± 28.4 577.9 ± 43.8 Feed eficiency, g gain/g feed 0.36 ± 0.02 0.40 ± 0.02 0.42 ± 0.02 Cecum
Cecal content (g/100 g body weight) 4.1 ± 0.4a 4.7 ± 0.3b 8.1 ± 1.1c
Cecal wall (g/100 g body weight) 0.9 ± 0.2a 1.1 ± 0.2a 2.1 ± 1.1b
pH 7.8 ± 0.06a 6.4 ± 0.05b 6.5 ± 0.05b
SCFAs (μmol/g wet weight)
Acetate 46.2 ± 3.2a 91.0 ± 17.8b 47.3 ± 10.1a
Propionate 12.1 ± 2.4a 35.2 ± 4.6b 22.4 ± 4.7c
n-Butyrate 12.4 ± 1.2a 33.1 ± 7.2b 23.8 ± 6.3c
Total SCFAs 70.7 ± 8.0a 159.2 ± 13.4b 93.4 ± 4.7c
BCFAs (μmol/g wet weight)
i-butyrate 4.7 ± 1.7a 18.8 ± 5.3b 16.1 ± 3.0c
n-valerate 8.7 ± 2.3a 14.0 ± 3.4b 14.9 ± 5.2b
i-valerate 6.15 ± 2.3a 11.6 ± 4.6b 14.8 ± 5.1b
Total BCFAs 12.1 ± 0.8a 26.8 ± 1.5b 30.7 ± 0.3b
Other organic acids (μmol/g wet weight)
Succinate 37.8 ± 10.4a 33.8 ± 5.6a 44.5 ± 4.6b
Lactate 6.4 ± 1.3a 52.7 ± 12.3b 61.4 ± 25.4c
Total organic acids 205.3 ± 20.8a 336.0 ± 30.1b 302.4 ± 27.3c
signiicantly different from rats fed the control diet (4.0 ± 0.5 g). A similar trend was found for cecal wall weights; rats fed FOS had a signiicantly higher cecal wall weight (2.1 ± 1.1 g) compared with rats fed yacon tuber (1.1 ± 0.2 g) and the control diet (0.9 ± 0.2 g).
SCFAs, organic acids and cecal pH
The total concentration of SCFAs (sum of acetate, propionate and n-butyrate) produced by fermentation of yacon tuber (159.2 ± 13.4 μmol/g cecal content) was the highest; it was 70% greater than that with the FOS diet (93.4 ± 4.7 μmol/g cecal content) (Table 2). Both were signiicantly greater than the control diet (70.7 ± 8.0 μmol/g cecal content) (p=0.04 and p=0.0002 respectively). Acetate was the main SCFA produced by fermentation of yacon tuber (91.0 ± 17.8 μmol/g cecal content), and its concentration was approximately 2-fold greater than those produced by fermentation of FOS diet (47.3 ± 10.1 μmol/g cecal content) and control diet (46.2 ± 3.2 μmol/g cecal content) (p=0.03). The propionate concentration produced by fermentation of yacon tuber was 1.5 and 3-fold greater than the concentrations produced by fermentation of the FOS and control diets, respectively. The concentration of butyrate was 1.3 and 2.6-fold greater than those produced by the FOS and control diets, respectively. Dietary yacon tuber reduced the cecal pH (6.3 ± 0.3) relative to the control (7.5 ± 0.7) (p<0.05). This lower pH was similar to the pH of the FOS diet group (6.4 ± 1.0). The total concentration and composition of cecal SCFAs differed, but cecal pH in rats fed yacon tuber compared with rats fed FOS were about the same. However, there was nearly twice as much cecal material in FOS-fed rats, so the cecal SCFA pool in rats on both experimental diets was more than two times greater than that in rats fed the control diet.
Serum lipid concentrations
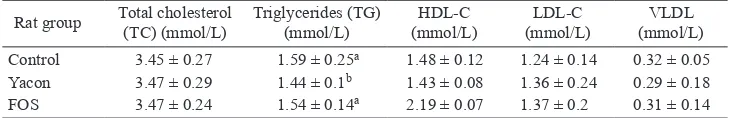
Total cholesterol (TC) taken at the end of the study did not show any signiicant differences between the three dietary groups. However, triglycerides (TG) showed a
slightly lower concentration in rats fed yacon compared with the control and FOS diets. The ratios of the HDL/ LDL concentrations were signiicantly higher in rats fed the FOS diet compared with rats fed the yacon diet or control diet (Table 3).
Intestinal microbial communities
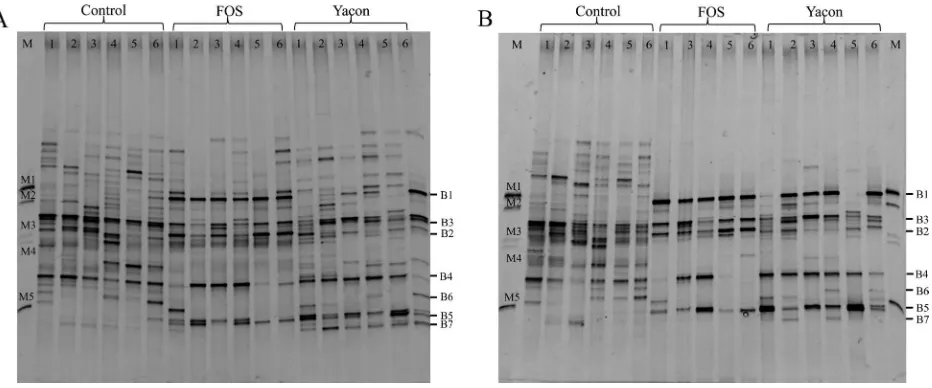
Microbial community structures were different among the groups, as shown by the PCR-DGGE proiles (Fig. 1). Bands in the high-GC region (bottom of the gel shown in Fig. 1) were clearly present both in proiles from rats on the yacon and FOS diets. More populations were detected in fecal samples compared with cecal samples; there were 10–28 distinct bands in fecal samples compared with 9–16 distinct bands in cecal samples. The control diet ingerprints had more bands (12–28 distinct bands) than the experimental diets (9–18 distinct bands).
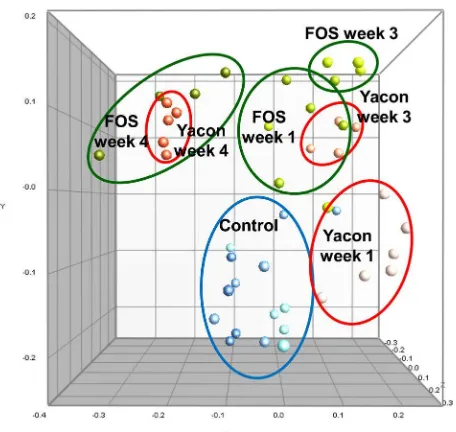
Dice similarity values between proiles within a diet treatment ranged from 0.5 to 1.0, whereas similarity values between treatments were 0.40 to 0.9. Similarity between proiles can be more easily seen in a dendrogram of pairwise analysis of Dice similarity using UPGMA (Fig. 2). A dendrogram of cecal samples generated two robust clusters with high bootstrapping values at the 55% similarity level: a group of rats fed the control diet and a group of rats fed the two experimental diets (Fig. 2a). A dendrogram derived from fecal samples from all experiment periods did not produce any robust cluster, indicating no distinct pattern of DGGE was detected (Fig. 2b). Another dendrogram derived from cecal samples and four-week fecal samples showed two somewhat robust clusters, with co-clustering of fecal and cecal samples from the same diet, indicating a certain relationship between cecal and fecal microlora (Fig. 2c). Temporal transition of the fecal microbial community in rats on the yacon and FOS diets was clearly shown in the MDS scatter plot (Fig. 3). MDS analysis also showed that this occurred in the rats on the control diet. The microbial community structure in fecal samples from rats on the yacon diet revealed large continual changes every week Table 3. Serum lipid concentrations in experimental animals after 28 days of treatment
Rat group Total cholesterol (TC) (mmol/L) Triglycerides (TG) (mmol/L) (mmol/L)HDL-C (mmol/L)LDL-C (mmol/L)VLDL Control 3.45 ± 0.27 1.59 ± 0.25a 1.48 ± 0.12 1.24 ± 0.14 0.32 ± 0.05 Yacon 3.47 ± 0.29 1.44 ± 0.1b 1.43 ± 0.08 1.36 ± 0.24 0.29 ± 0.18
from week 1 of the diet until week 4, as shown by the distance and spatial transition of data points in the MDS. The microbial community structure under the FOS diet also revealed continual changes every week. However, these changes were smaller than those observed with the yacon diet; the proiles of week 1 and week 3 were in the same dimension and then changed from week 3 to week 4. At week 4, the microbial community structures for the yacon diet and FOS diet were similar. The week 3 cluster of yacon diet proiles was closer to the week 1 FOS cluster, suggesting that the changes in microbial communities on the FOS diet occurred sooner than on the yacon diet.
Identiication of intestinal microbiota
Five distinct band positions, named B1, B2, B5, B6 and B7 (Fig. 1), were found only in the PCR-DGGE proiles of rats on the experimental diets, and two distinct band positions, named B3 and B4, were common to all proiles. DGGE proiles were used as a reference to analyze the change in intestinal microbiota, in which the presence or absence of known clones in all samples was detected using clone libraries. After conirming that PCR-DGGE migration of the clones matched the positions of bands of interest, clones of almost full-length 16S rRNA were
sequenced. Because clones could not be detected for band B7, the intestinal microbial community was identiied by sequencing the DGGE bands directly. A total of 27 clones were sequenced that belonged to three phyla, Firmicutes, Bacteroidetes and Actinobacteria (Table 4).
Band B1 was found to be a thick band in every rat on the FOS diet, while in the rats on the yacon diet, it was found in the cecal samples of rat numbers 3, 4 and 6 and in the fecal samples of rat numbers 2, 3, 4 and 6. The sequence of band B1 from the PCR-DGGE and its corresponding closest matching clone was Lactobacillus acidophilus. Band B2 was found in both cecal and fecal samples from every rat on the FOS diet. This band was not found in proiles of rats on the yacon diet or in rats on the control diet. The closest match to the 16S rRNA gene sequence of the PCR-DGGE band and corresponding clone was Lactobacillus acidophilus. Band B3 was found in cecal and fecal samples from all rats on the three diets. The best sequence match to these bands was the genus Blautia. Band B4 was found in every rat on the control diet and in the majority of rats on the yacon (ive rats) and FOS diets (four rats). The 16S rRNA gene sequences were most similar to that of a Ruminococcus sp. Band B5 was found in both cecal and fecal samples from every rat on the yacon and FOS diets. The band sequences most Fig. 1. PCR-DGGE proiles representing the (A) fecal week 4 and (B) cecal bacterial community in Sprague Dawley (SD) rats fed the
control, yacon and FOS diets .
closely matched Biidobacterium animalis. Band B6 was only found in two rats on the yacon diet and was most similar to Biidobacterium pseudolongum. Band B7 was found in the fecal sample of every rat on the yacon diet
and in three cecal samples. The band sequences were most similar to those of the genus Barnesiella.
DISCUSSION
We demonstrated that the addition of 10% yacon tuber to a rat’s conventional diet resulted in a signiicant difference in the gut environment of rats when compared with the addition of 5% commercialized FOS. This change occurred within one week of feeding, as shown clearly by MDS scatter plot. Despite the fact that the FOS (GF2, GF3 and GF4) content in the 10% of yacon diet was equivalent to a 5% FOS content in the commercialized FOS used in this study, yacon tuber also contains soluble saccharides, resistant starch and polyphenols, such as chlorogenic acid, dicaffeoylquinic acid and tricaffeoylquinic acid [13, 14, 44]. The difference in gut environment might be the result of components in the yacon tuber other than oligosaccharides.
The MDS scatter plot also indicates that the change in bacterial communities appeared to occur sooner in rats fed the FOS diet, as shown by the proiles at week 1 being more similar to the proiles of rats fed the yacon diet at week 3. This suggests that FOS was more readily fermented by the microbiota but that eventually similar populations were able to ferment the yacon tuber. The fewer number of bands in the PCR-DGGE proiles and more aggregated area in the MDS scatter plot of the yacon diet suggested that fermentation of these substrates
selectively increased Lactobacilli, Biidobacteria, and Barnesiella spp.
Although there have been a few studies that have examined the prebiotic effects of yacon tuber, they used a cultivation approach targeting speciic genera such as Biidobacteria and Lactobacilli [9, 21]. In our study, by using a method based on molecular genetics, 16S rRNA gene PCR-DGGE combined with cloning and sequencing, we demonstrated that the prebiotic effect of yacon was clearly different from that of FOS. Bacteria with a high GC-content, B. pseudolongum, were increased in the rats fed yacon diet. Furthermore, members of the genus Biidobacterium are considered beneicial bacteria.
Comparison of PCR-DGGE proiles indicated the presence of ive bands, which were named band B1, B2, B5, B6 and B7, speciic for the FOS and/or yacon diets that were not seen in the controls. Lactobacilli and Biidobacteria were common bacteria found in the rats fed the yacon and FOS diets. These two genera were also found to increase in the large intestine of rats fed 340 mg/ kg day−1 of yacon tuber lour or inulin [21] and in cecum
of guinea pigs fed 11.9% yacon lour (equivalent to 5% of FOS) [9]. In an in vitro study, growth of L. plantarum, L. acidophilus and B. biidum was found to increase in culture media containing 1.27% yacon tuber powder, demonstrating that these species could utilize yacon tuber powder for growth [20].
Furthermore, a Barnesiella sp. was found only in rats fed the yacon diet; this genus has not been previously associated with yacon or FOS fermentation using the conventional cultivation technique. A Barnesiella sp. was recently cultivated from the chicken gut [45], ruminant gut [46, 47] and human stool samples [48]. A Barnesiella sp. has recently been identiied in the contents of the rumen, and the increase in these bacteria was affected by starch addition [46, 47].
The signiicant differences in total SCFAs in rats fed the yacon diet indicate that the yacon tuber was undergoing abundant fermentation caused an acidic pH level in the cecum and produced a selective environment for the intestinal microbiota. Acetate was the main SCFA produced from fermentation of yacon tuber; it appears that the acidic pH level in the cecum of the rats fed the yacon mostly the result of production of acetate. The pH values were lower than those reported previously using similar yacon-FOS concentrations [25, 26]. The different composition of SCFAs in the cecal contents provided more evidence that there were differences in the microbial fermentation of yacon tuber and FOS.
The increase in cecal size was related to the increase in cecal biomass and metabolic activity of intestinal Fig 3. Multidimensional scaling (MDS) of 16S rRNA gene
microlora in the rats fed the yacon tuber and FOS diets. Higher cecal size was also enhanced by water solubility and bulking effects. FOS is water-soluble [49] but has no bulking effects, while dietary iber and resistant starch, which only yacon contained, have bulking effects. They absorbed water when moving through the digestive system and accelerated the movement of food through the digestive system. This might cause lower cecal size and other physiological and microbiological differences.
In conclusion, our results demonstrated that the gut microenvironment of rats fed the yacon tuber diet clearly differed from those of rats fed the FOS and control diets. Yacon tuber exhibited a prebiotic effect by promoting the growth of Lactobacilli and Biidobacteria in the rat cecum, resulting in a greater concentration of SCFAs and lower pH. Using culture-independent analysis, 16S rRNA gene PCR-DGGE combined with cloning and sequencing, the difference in the prebiotic effect of yacon
was substantiated by inding a band with a sequence most closely related to a Barnesiella sp. This genus has not been reported to be involved in yacon or FOS fermentation using the conventional cultivation technique. Our results revealed that yacon tuber consumption might play an important and slightly different role in colonic health maintenance compared with other FOS sources.
ACKNOWLEDGEMENT
The authors thank Dr. Hitoshi Iwaya, Mr. Erwin Suwandi and Mr. Nobuyuki Fujii from the Laboratory of Food Biochemistry (Hokkaido University) for their help in surgery on the rats.
REFERENCES
1. Gibson GR, Roberfroid MB. 1995. Dietary modulation of the human colonic microbiota-introducing the concept of prebiotics. J Nutr 125: 1401–1412. [Medline] Table 4. 16S rRNA gene sequence of select PCR-DGGE bands
Clone/ Band ID
Gen Bank accession
no. Phylum Closest type strain Accession no.
Sequence match/ length (bp)
Percentage
similarity Sample Source Diet
CB1_2* AB822944 Firmicutes Lactobacillus acidophilus BCRC 10695 AY773947 1478/1479 99.9 Cecum FOS FB1_1 AB822956 Firmicutes Lactobacillus acidophilus BCRC 10695 AY773947 1452/1460 99.4 Feces FOS CB1_4 AB822946 Firmicutes Lactobacillus acidophilus BCRC 10695 AY773947 1426/1427 99.9 Cecum Yacon FB1_3 AB822958 Firmicutes Lactobacillus acidophilus BCRC 10695 AY773947 1187/1188 99.9 Feces Yacon CB2_4 AB822950 Firmicutes Lactobacillus acidophilus BCRC 10695 AY773947 852/856 99.5 Cecum FOS FB2_1 AB822959 Firmicutes Lactobacillus acidophilus BCRC 10695 AY773947 1477/1478 99.9 Feces FOS CB3_1 AB822951 Firmicutes Blautia coccoides JCM 1395 AB571656 737/748 98.5 Cecum Control CB3_2 AB822952 Firmicutes Blautia hansenii JCM 14655 AB534168 1166/1254 93 Cecum Control FB3_1 AB822962 Firmicutes Blautia glucerasea HFTH-1 AB439724 1447/1469 98.5 Feces Control CB3_3 AB822953 Firmicutes Blautia coccoides JCM 1395 AB571656 1020/1023 99.7 Cecum FOS FB3_2 AB822963 Firmicutes Blautia glucerasea HFTH-1 AB439724 1023/1037 98.6 Feces FOS FB3_3 AB822964 Firmicutes Lactobacillus acidophilus BCRC10695 AY773947 1043/1044 99.9 Feces FOS CB3_6 AB822955 Firmicutes Clostridium alkalicellulosi Z-7026 AY959944 1235/1432 86 Cecum Yacon FB3_5 AB822965 Firmicutes Lactobacillus acidophilus BCRC 10695 AY773947 812/816 99.5 Feces Yacon FB3_6 AB822966 Firmicutes Blautia coccoides JCM 1395 AB571656 630/694 90.8 Feces Yacon CB5_2 AB822938 Actinobacteria Biidobacterium animalis JCM 1190 D86185 520/525 98 Cecum FOS FB5_1 AB822942 Actinobacteria Biidobacterium animalis JCM 1190 D86185 520/525 98 Feces FOS CB5_3 AB822939 Actinobacteria Biidobacterium animalis JCM 1190 D86185 480/487 97 Cecum Yacon CB6_3 AB822940 Actinobacteria Biidobacterium pseudolongum JCM 5820 D86194 422/435 97 Cecum Yacon FB6_1 AB822942 Actinobacteria Biidobacterium pseudolongum JCM 5820 D86194 468/476 97 Feces Yacon FB6_2 AB822943 Actinobacteria Biidobacterium pseudolongum JCM 5820 D86194 422/435 98 Feces Yacon FB7_1† AB822973 Actinobacteria Biidobacterium animalis JCM 1190 D86185 190/193 98 Feces Yacon FB7_2 AB822974 Bacteroidetes Barnesiella intestinihominis YIT 11860 AB370251 172/195 88 Feces Yacon FB7_3 AB822975 Bacteroidetes Barnesiella intestinihominis YIT 11861 AB370251 174/196 89 Feces Yacon FB7_4 AB822976 Bacteroidetes Barnesiella intestinihominis YIT 11862 AB370252 172/197 89 Feces Yacon FB7_5 AB822977 Bacteroidetes Barnesiella intestinihominis YIT 11863 AB370253 170/196 89 Feces Yacon FB7_6 AB822978 Bacteroidetes Barnesiella intestinihominis YIT 11864 AB370254 174/196 87 Feces Yacon CB7_7 AB822971 Bacteroidetes Barnesiella intestinihominis YIT 11865 AB370251 171/196 87 Cecum Yacon CB7_8 AB822972 Bacteroidetes Barnesiella intestinihominis YIT 11860 AB370251 174/196 87 Cecum Yacon *CB1_2 to FB6_2 were the sequences from the colonies containing plasmids.
2. Guigoz Y, Rochat F, Perruisseau-Carrier G, Rochat I, Schiffrin EJ. 2002. Effects of oligosaccharide on the faecal lora and non-speciic immune system in elderly people. Nutr Res 22: 13–25. [CrossRef]
3. Juśkiewicz J, Zdunczyk Z, Zary-Sikorska E, Krol B, Milala J, Jurgonski A. 2011. Effect of the dietary polyphenolic fraction of chicory root, peel, seed and leaf extracts on caecal fermentation and blood parameters in rats fed diets containing prebiotic fructans. Br J Nutr 105: 710–720. [CrossRef][Medline]
4. Ramnani P, Gaudier E, Bingham M, van Bruggen P, Tuohy KM, Gibson GR. 2010. Prebiotic effect of fruit and vegetable shots containing Jerusalem artichoke inulin: a human intervention study. Br J Nutr 104: 233–240. [CrossRef][Medline]
5. Liu H, Ivarsson E, Dicksved J, Lundh T, Lindberg JE. 2012. Inclusion of Chicory (Cichorium intybus L.) in pigs’ diets affects the intestinal microenvironment and the gut microbiota. Appl Environ Microbiol 78: 4102–4109. [CrossRef][Medline]
6. Menne E, Guggenbuhl N, Roberfroid M. 2000. Fn-type chicory inulin hydrolysate has a prebiotic effect in humans. J Nutr 130: 1197–1199. [Medline]
7. Kleessen B, Schwarz S, Boehm A, Fuhrmann H, Richter A, Henle T, Krueger M. 2007. Jerusalem artichoke and chicory inulin in bakery products affect faecal microbiota of healthy volunteers. Br J Nutr 98: 540–549. [CrossRef][Medline]
8. Azorín-Ortuño M, Urban C, Ceron JJ, Tecles F, Allende A, Tomas-Barberan FA, Espin JC. 2009. Effect of low inulin doses with different polymerisation degree on lipid metabolism, mineral absorption, and intestinal microbiota in rats with fat-supplemented diet. Food Chem 113: 1058–1065. [CrossRef]
9. Campos D, Betalleluz-Pallardel I, Chirinos R, Aguilar-Galvez A, Noratto G, Pedreschi R. 2012. Prebiotic effects of yacon (Smallanthus sonchifolius Poepp. & Endl), a source of fructooligosaccharides and phenolic compounds with antioxidant activity. Food Chem 135: 1592–1599. [CrossRef][Medline]
10. Simonovska B, Vovk I, Andrensek S, Valentova K, Ulrichova J. 2003. Investigation of phenolic acids in yacon (Smallanthus sonchifolius) leaves and tubers. J Chromatogr A 1016: 89–98. [CrossRef][Medline]
11. Takenaka M, Yan XJ, Ono H, Yoshida M, Nagata T, Nakanishi T. 2003. Caffeic acid derivatives in the roots of yacon (Smallanthus sonchifolius). J Agric Food Chem 51: 793–796. [CrossRef][Medline]
12. Takenaka M, Nanayama K, Ono H, Nakajima H, Isobe S. 2006. Changes in the concentration of phenolic compounds during growing, storing, and processing of yacon. J Jpn Soc Food Sci Technology-Nippon Shokuhin Kagaku Kogaku Kaishi 53: 603–611 (in Japanese). [CrossRef]
13. Takenaka M, Nanayama K, Inoue E. 2011. Evaluation of polyphenol content and other properties of 16 cultivars/
strains of yacon. J Jpn Soc Food Sci Technology-Nippon Shokuhin Kagaku Kogaku Kaishi 58: 603–611 (in Japanese). Isolation and structural analysis of oligosaccharides from yacon (Polymnia sonchifolia). Biosci Biotechnol Biochem 59: 2346–2347. [CrossRef]
16. Ohyama T, Ito O, Yasuyoshi S, Ikarashi T, Minamisawa K, Kubota M, Tsukihashi T, Asami T. 1990. Composition of storage carbohydrates tubers of yacon (Polymnia
sonchifolia). Soil Sci Plant Nutr 36: 167–171. [CrossRef]
17. Lachman J, Havrland B, Fernandez EC, Dudjak J. 2004. Saccharides of yacon Smallanthus sonchifolius (Poepp. et Endl.) H. Robinson tubers and rhizomes and factors affecting their content. Plant Soil Environ 50: 383–390. 18. Valentová K, Lebeda A, Dolezalova I, Jirovsky D,
Simonovska B, Vovk I, Kosina P, Gasmanova N, Dziechciarkova M, Ulrichova J. 2006. The biological and chemical variability of yacon. J Agric Food Chem 54: 1347–1352. [CrossRef][Medline]
19. Valentová K, Stejskal D, Bartek J, Dvorackova S, Kren V, Ulrichova J, Simanek V. 2008. Maca (Lepidium meyenii) and yacon (Smallanthus sonchifolius) in combination with silymarin as food supplements: In vivo safety assessment. Food Chem Toxicol 46: 1006– 1013. [CrossRef][Medline]
20. Pedreschi R, Campos D, Noratto G, Chirinos R, Cisneros-Zevallos L. 2003. Andean yacon root (Smallanthus sonchifolius Poepp. Endl) fructooligosaccharides as a potential novel source of prebiotics. J Agric Food Chem 51: 5278–5284. [CrossRef][Medline]
21. Bibas Bonet ME, Meson O, de Moreno de LeBlanc A, Dogi CA, Chaves S, Kortsarz A, Grau A, Perdigon G. 2010. Prebiotic effect of yacon (Smallanthus sonchifolius) on intestinal mucosa using a mouse model. Food Agric Immunol 21: 175–189. [CrossRef]
22. Geyer M, Manrique I, Degen L, Beglinger C. 2008. Effect of Yacon (Smallanthus sonchifolius) on colonic transit time in healthy volunteers. Digestion 78: 30–33.
[CrossRef][Medline]
23. Genta S, Cabrera W, Habib N, Pons J, Manrique Carillo I, Grau A, Sanchez S. 2009. Yacon syrup: beneicial effects on obesity and insulin resistance in humans. Clin Nutr 28: 182–187. [CrossRef][Medline]
24. Habib NC, Honore SM, Genta SB, Sanchez SS. 2011. Hypolipidemic effect of Smallanthus sonchifolius (yacon) roots on diabetic rats: biochemical approach. Chem Biol Interact 194: 31–39. [CrossRef][Medline]
growing rats. FASEB J 18: A150–A150.
26. Lobo AR, Colli C, Alvares EP, Filisetti TMCC. 2007. Effects of fructans-containing yacon (Smallanthus sonchifolius Poepp & Endl.) lour on caecum mucosal morphometry, calcium and magnesium balance, and bone calcium retention in growing. Br J Nutr 97: 776–785. [CrossRef][Medline]
27. Lobo AR, Cocato ML, Borelli P, Gaievski EHS, Crisma AR, Nakajima K, Nakano EY, Colli C. 2011. Iron bioavailability from ferric pyrophosphate in rats fed with fructan-containing yacon (Smallanthus sonchifolius) lour. Food Chem 126: 885–891. [CrossRef]
28. Weaver CM, Martin BR, Nakatsu CH, Armstrong AP, Clavijo A, McCabe LD, McCabe GP, Duignan S, Schoterman MHC, van den Heuvel EGHM. 2011. Galactooligosaccharides improve mineral absorption and bone properties in growing rats through gut fermentation. J Agric Food Chem 59: 6501–6510.
[CrossRef][Medline]
29. Hogarth AJ, Hunter DE, Jacobs WA, Garleb KA, Wolf BW. 2000. Ion chromatographic determination of three fructooligosaccharide oligomers in prepared and preserved foods. J Agric Food Chem 48: 5326–5330.
[CrossRef][Medline]
30. Reeves PG, Nielsen FH, Fahey GC. 1993. AIN-93 Puriied diets for laoratory rodents-inal report of the American institute of nutrition ad hoc writing committee on the reformulation of the AIN-76A rodent diet. J Nutr 123: 1939–1951. [Medline]
31. Nauck M, Warnick GR, Rifai N. 2002. Methods for measurement of LDL-cholesterol: a critical assessment of direct measurement by homogeneous assays versus calculation. Clin Chem 48: 236–254. [Medline]
32. Minamida K, Sujaya IN, Tamura A, Shigematsu N, Sone T, Yokota A, Asano K, Benno Y, Tomita F. 2004. The effects of di-D-fructofuranose-1,2’:2,3’-dianhydride (DFA III) administration on human intestinal microbiota. J Biosci Bioeng 98: 244–250. [Medline]
33. Hoshi S, Sakata T, Mikuni K, Hashimoto H, Kimura S. 1994. Galactosylsucrose and xylosylfructosidase alter digestive tract size and concentrations of cecal organic acids in lats fed diets containing cholesterol and cholic acid. J Nutr 124: 52–60. [Medline]
34. Minamida K, Shiga K, Sujaya IN, Sone T, Yokota A, Hara H, Asano K, Tomita F. 2005. Effects of difructose anhydride III (DFA III) administration on rat intestinal microbiota. J Biosci Bioeng 99: 230–236. [CrossRef] [Medline]
35. Muyzer G. 1999. DGGE/TGGE a method for identifying genes from natural ecosystems. Curr Opin Microbiol 2: 317–322. [CrossRef][Medline]
36. Yu Z, Morrison M. 2004. Comparisons of different hypervariable regions of rrs genes for use in ingerprinting of microbial communities by PCR-denaturing gradient gel electrophoresis. Appl Environ Microbiol 70: 4800–4806. [CrossRef][Medline]
37. Dice LR. 1945. Measures of the amount of ecologic
association between species. Ecology 26: 297–302.
[CrossRef]
38. Heyndrickx M, Vauterin L, Vandamme P, Kersters K, DeVos P. 1996. Applicability of combined ampliied ribosomal DNA restriction analysis (ARDRA) patterns in bacterial phylogeny and taxonomy. J Microbiol Methods 26: 247–259. [CrossRef]
39. Yap I, Nelson R. 1996. Winboot: a program for performing bootstrap analysis of binary data to determine the conidence limits of UPGMA-based dendrograms. In: IRRI Discussion Paper 14; Manila, Philipphines. International Rice Research Institute. 40. Shepard RN, Nerlove SB. Mathematical Social Science
Board’s Advanced Research Symposium on Social N, Romney AK. 1972. Multidimensional scaling: theory and applications in the behavioral sciences. New York: Seminar Press.
41. Lane DJ, Pace B, Olsen GJ, Stahl DA, Sogin ML, Pace NR. 1985. Rapid determination of 16S ribosomal RNA sequences for phylogenetic analyses. Proc Natl Acad Sci USA 82: 6955–6959. [CrossRef][Medline]
42. Wilson KH, Blitchington RB, Greene RC. 1990. Ampliication of bacterial 16S ribosomal DNA with polymerase chain reaction. J Clin Microbiol 28: 1942– 1946. [Medline]
43. Cole JR, Wang Q, Cardenas E, Fish J, Chai B, Farris RJ, Kulam-Syed-Mohideen AS, McGarrell DM, Marsh T, Garrity GM, Tiedje JM. 2009. The Ribosomal database project: improved alignments and new tools for rRNA analysis. Nucleic Acids Res 37: D141–D145.
[CrossRef][Medline]
44. Saitou N, Nei M. 1987. The Neighbor joining method-a new method for reconstructing phylogenetic trees. Mol Biol Evol 4: 406–425. [Medline]
45. Sakamoto M, Lan PTN, Benno Y. 2007. Barnesiella viscericola gen. nov., sp nov., a novel member of the family Porphyromonadaceae isolated from chicken caecum. Int J Syst Evol Microbiol 57: 342–346.
[CrossRef][Medline]
46. Kim M, Morrison M, Yu Z. 2011. Status of the phylogenetic diversity census of ruminal microbiomes. FEMS Microbiol Ecol 76: 49–63. [CrossRef][Medline]
47. Zened A, Combes S, Cauquil L, Mariette J, Klopp C, Bouchez O, Troegeler-Meynadier A, Enjalbert F. 2013. Microbial ecology of the rumen evaluated by 454 GS FLX pyrosequencing is affected by starch and oil supplementation of diets. FEMS Microbiol Ecol 83: 504–514. [CrossRef][Medline]
48. Morotomi M, Nagai F, Sakon H, Tanaka R. 2008.
Dialister succinatiphilus sp nov and Barnesiella
intestinihominis sp nov., isolated from human faeces. Int J Syst Evol Microbiol 58: 2716–2720. [CrossRef] [Medline]
49. Cummings JH, Macfarlane GT. 2002. Gastrointestinal effects of prebiotics. Br J Nutr 87: S145–S151.