Procedia CIRP
Open Access About this Journal Submit your Article
CIRP Get new article feed
Subscribe to new volume alerts Add to Favorites
Copyright © 2016 Elsevier B.V. All rights reserved
--This Journal/Book-- Advanced search
Journals Books Help
Procedia CIRP
Open Access About this Journal Submit your Article
CIRP Get new article feed
Subscribe to new volume alerts
Add to Favorites
Copyright © 2016 Elsevier B.V. All rights reserved
--This Journal/Book-- Advanced search
Journals Books Help
2212-8271 © 2016 The Authors. Published by Elsevier B.V. This is an open access article under the CC BY-NC-ND license
A Fuzzy Multi Criteria Approach for Sustainable Manufacturing Evaluation
in Cement Industry
Elita Amrina*, Chintia Ramadhani, Annike Lutfia Vilsi
Department of Industrial Engineering, Andalas University, Padang 25163, Indonesia* Corresponding author. Tel.: +62-751-72497; fax: +62-751-72566.E-mail address:[email protected]
Abstract
The cement industry has remarked as an intensive consumer of natural raw materials, fossil fuels, energy, and a major source of multiple pollutants. Therefore, it is a need to evaluate sustainable manufacturing in this industry. This paper aims to propose a fuzzy multi criteria approach for evaluating sustainable manufacturing in cement industry which integrated the Interpretive Structural Modeling (ISM) and the Fuzzy Analytic Network Process (FANP) methodology. The network relationship model is constructed using ISM methodology. Importance weights of indicators are assigned by pairwise comparisons and calculated using fuzzy ANP methodology. A case study is also presented to demonstrate implementation of the evaluation model. The results show the existing performance level on company’s strengths and weaknesses, and where improvements need to be made. It is hoped the proposed evaluation model can aid the cement industry to achieve the higher performance in sustainable manufacturing.
© 2015 The Authors. Published by Elsevier B.V.
Peer-review under responsibility of Assembly Technology and Factory Management/Technische Universität Berlin.
Keywords: analytic network process; cement industry; fuzzy; evaluation; interpretive structure modeling; sustainable manufacturing
1.Introduction
Sustainable manufacturing has became a critical issue in the cement industry. Cement is an indispensable industrial product for economic development, but its production is extremely energy-intensive and leads to excessive pollution [1]. The cement industry has regarded as one of the most energy intensive consumers amongst industries in the world [2]. Furthermore, cement plants are characterised as an intensive consumer of natural raw materials and fossil fuels, and has remarked as emitters of pollutants [3, 4]. The cement companies are under intense pressure to reduce the environmental impacts of their products and operations. Thus, it is important to implement sustainable manufacturing in this industry.
The US Department of Commerce defined sustainable manufacturing as the creation of manufactured products that minimize negative environmental impacts, conserve energy and natural resources, are safe for employees, communities and consumers and are economically sound [5]. According to the definitions, sustainable manufacturing must address the integration all the three indicators of environmental, social, and economic, known as the triple bottom line of sustainability.
Therefore, sustainable manufacturing should be evaluated with respect to those three indicators.
Sustainable manufacturing is currently a very important issue for governments and industries worldwide [6]. Achieving sustainability in manufacturing activities have been recognized as a critical need due to diminishing non-renewable resources, stricter regulations related to environment and occupational safety, and growing consumer preference for environmentally-friendly products [7]. Sustainable manufacturing must respond to [8]: (i) economical challenges, by producing wealth and new services ensuring development and competitiveness through time; (ii) environmental challenges, by promoting minimal use of natural resources (in particular non-renewable) and managing them in the best possible way while reducing environmental impact; and (iii) social challenges, by promoting social development and improved quality of life through renewed quality of wealth and jobs. It has been suggested that sustainable manufacturing has to be evaluated based on triple bottom line of economic, environmental, and social performance [9] as well as to consider their interdependencies [10].
© 2016 The Authors. Published by Elsevier B.V. This is an open access article under the CC BY-NC-ND license (http://creativecommons.org/licenses/by-nc-nd/4.0/).
This research proposes a fuzzy multi criteria approach for evaluating sustainable manufacturing in cement industry which integrated the Interpretive Structural Modeling (ISM) and the Fuzzy Analytic Network Process (FANP) methodology. The ISM methodology is utilized to determine the structural relationships and interrelationships amongst all the evaluation indicators, while the Fuzzy ANP methodology is applied to arrange the appropriate weights to each of the indicators in the evaluation model. A case study is then conducted to demonstrate implementation of the evaluation model.
2.Research method
2.1.Interpretive Structural Modeling (ISM)
Interpretive Structural Modeling (ISM) was proposed by Warfield in 1973 as computer assisted methodology [12]. ISM is an interactive learning process that enables one to develop a map of the complex relationships among many elements involved in a complex problem [12]. It helps build an interaction map to identify the interrelationships among system variables. ISM provides a better understanding of a system structure and draws up a useful guideline in generating a graphical representation of the structure [13]. ISM is interpretive as the judgment of the experts decides whether and how the system variables are related. It is structural as on the basis of relationship and overall structure is extracted from the complex set of system variables. The first step of ISM is to identify the variables relevant to the problem. A structural self interaction matrix (SSIM) is then developed based on a pair-wise comparison of variables. SSIM is then converted into a reachability matrix. Noted that the reachability matrix is under Boolean operations. Its transitivity is then checked. The transitivity is a basic assumption of ISM methodology, which stated that if variable-A related to variable-B and variable-B related to variable-C, then variable-A necessarily related to variable-C [12].
2.2.Fuzzy Analytic Network Process (FANP)
Analytic Network Process (ANP) method introduced by Thomas L. Saaty in 1996 is an extension of the Analytic Hierarchy Process (AHP) method. AHP decomposes a problem into a hierarchical structure where each decision element is assumed to be independent. ANP is designed to deal with complex decisions that involve dependency and feedback [14]. Because of its consideration to the interdependence of each element, ANP could establish a better understanding of the complex relationships between elements in decision making and thus, improve the reliability of decision making [15]. ANP method is capable of handling interdependence among elements by obtaining the composite weights through the development of a supermatrix [16].
It is the fact that human perception always contains a certain degree of vagueness and ambiguity, and traditional ANP fails to perceive these traits. Thus, fuzzy set theory is applied in dealing with uncertainty and imprecision associated with information concerning various parameters, and to cope with
situations in which only partial information is available. Fuzzy logic has been described as a problem solving method which provides definite conclusions from imprecise, vague, and uncertain information [17]. Generally, a fuzzy set is defined by its membership function, which represents the grade of any element x of X that have the partial membership to M. The degree to which an element belongs to a set is defined by the value ranging between zero and one [18]. If an element x belongs to M, μM(x) = 1 and clearly not μM(x) = 0.
A triangular fuzzy number (TFN) is defined as (l, m, u), where l ≤ m ≤ u. The parameters l, m and u, respectively, denote the smallest possible value, the most promising value, and the largest possible value that describe a fuzzy event. Each TFN has linear representations on its left and right side such that its membership function can be defined as:
ߤெሺݔሻ ൌ ൝
ሺݔ െ ݈ሻȀሺ݉ െ ݈ሻ ͳ ݔ ݉ ሺݑ െ ݔሻȀሺݑ െ ݉ሻ ݉ ݔ ݑ
Ͳ ݐ݄݁ݎݓ݅ݏ݁
(1)
3.Fuzzy multi criteria approach
This study provides decision makers with a fuzzy multi criteria approach for evaluating sustainable manufacturing in the cement industry. The methodology has three main stages. First, establish the KPIs for sustainable manufacturing evaluation in cement industry. Second, determine the interrelationships of KPIs using Interpretive Structural Modeling (ISM) method. Finally, calculate the importance weight of KPIs using Fuzzy Analytic Network Process (FANP) method.
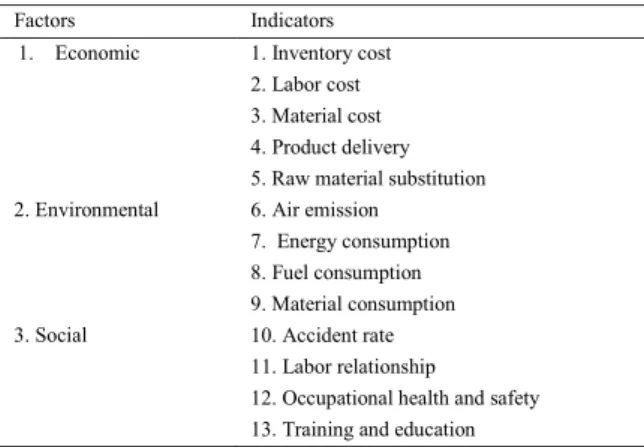
3.1.Establishing KPIs
2. Environmental
3. Social
6. Air emission 7. Energy consumption 8. Fuel consumption 9. Material consumption 10. Accident rate 11. Labor relationship
12. Occupational health and safety 13. Training and education
3.2.Determining the interrelationships of KPIs
Since the evaluation systems are complex, it is not appropriate to assume the indicators within the system are independent. Therefore, it is required to determine the relationships among the indicators. For that purpose, Interpretive Structural Modeling (ISM) method was applied. An ISM survey was conducted to develop a network structure model of the KPIs for sustainable manufacturing evaluation in cement industry. A questionnaire was then designed and sent to 15 managers from the cement manufacturing company in Padang, Indonesia. Those managers were carefully selected based on their experience in cement industry. Through the ISM survey, the experts were consulted to identify the relationships amongst the KPIs of sustainable manufacturing evaluation in cement industry. Answers to the questions from the experts were averaged. The results indicated a total of 30 direct relationships amongst the KPIs [20]. The Structural self-interactive modeling (SSIM) of the KPIs is presented in Table 2.
Table 2. Structural self-interactive matrix (SSIM) of KPIs.
Indicators 1 2 3 4 5 6 7 8 9 10 11 12 13
1 - O O A A O O A A O O O O
2 - O O O O O O O A O A A
3 - A A O A A A O O O O
4 - A O O O O O O O O
5 - O X A X O O O O
6 - A O O O O V O
7 - X A O O O O
8 - O O O O O
9 - O O O O
10 - A X A
11 - V A
12 - A
13 -
Four symbols are used to denote the direction of relationship between the indicators (i and j) where V for the relation from i to j, A for the relation from j to i, X for both directions, relations from i to j and j to i, and O if the relation between the indicators does not appear valid. The SSIM is then transformed into the initial reachability matrix by substituting the symbols of V, A, X, and O into a binary matrix of 1 and 0, where 1 means there is relationship between the indicators and otherwise, 0 means there is no relationship between the indicators. The initial
4 1 0 1 1 0 0 0 0 0 0 0 0 0
5 1 0 1 1 1 0 1 0 1 0 0 0 0
6 0 0 0 0 0 1 0 0 0 0 0 1 0
7 0 0 1 0 1 1 1 1 0 0 0 0 0
8 1 0 1 0 1 0 1 1 0 0 0 0 0
9 1 0 1 0 1 0 1 0 1 0 0 0 0
10 0 1 0 0 0 0 0 0 0 1 0 1 0
11 0 0 0 0 0 0 0 0 0 1 1 1 0
12 0 1 0 0 0 0 0 0 0 1 0 1 0
13 0 1 0 0 0 0 0 0 0 1 1 1 1
The final reachability matrix is developed from the initial reachability matrix by incorporating the transitivities. The final reachability matrix of the KPIs [20]is shown in Table 4.
Table 4. Final reachability matrix of KPIs.
Indicators 1 2 3 4 5 6 7 8 9 10 11 12 1 3
1 1 0 0 0 0 0 0 0 0 0 0 0 0
2 0 1 0 0 0 0 0 0 0 0 0 0 0
3 0 0 1 0 0 0 0 0 0 0 0 0 0
4 1 0 1 1 0 0 0 0 0 0 0 0 0
5 1 1 1 1 1 1 1 1 1 1 0 1 0
6 0 1 0 0 0 1 0 0 0 1 0 1 0
7 1 1 1 1 1 1 1 1 1 1 0 1 0
8 1 1 1 1 1 1 1 1 1 1 0 1 0
9 1 1 1 1 1 1 1 1 1 1 0 1 0
10 0 1 0 0 0 0 0 0 0 1 0 1 0
11 0 1 0 0 0 0 0 0 0 1 1 1 0
12 0 1 0 0 0 0 0 0 0 1 0 1 0
13 0 1 0 0 0 0 0 0 0 1 1 1 1
Finally, an ISM-based network model [20] is then generated based on the relationships of indicators given in the final reachability matrix as shown in Fig. 1. It can be concluded that raw material substitution is regarded as the most influencing indicator for sustainable manufacturing evaluation in the cement industry.
3.3.Determining the importance weight of KPIs
Fig. 1. ISM model of KPIs
Table 5. Fuzzy comparisons matrix under raw material substitution.
Indicators Fuel
consumption Energy consumption Material consumption Fuel
Answers to each question were then geometrically averaged before calculating the importance weight. Consistency ratio (CR) was checked for each pairwise comparison. Then the supermatrix is constructed based on the network relationship model from the ISM stage. The supermatrix is composed by many sub-matrices which obtained from the pairwise comparisons matrix. If there is no relationship between the KPIs, the value for the supermatrix is set equal to zero. Table 6 shows the unweighted supermatrix of the KPIs. The unweighted supermatrix is then multiplied by the importance weight of corresponding influencing factors and obtained the weighted supermatrix as shown in Table 7. The weighted supermatrix should be column stochastic (the total column equal to one). Finally, the weighted supermatrix then converged into the limit supermatrix by raising the supermatrix to the power M2k+1,where k is an arbitrarily large number. In
this case, the convergence was reached at M12. The limit
supermatrix is shown in Table 8. The value in each row of the limit supermatrix represents the importance weight of each indicator.
The importance weight of the four indicators of raw material substitution, energy consumption, fuel consumption, and material consumption are obtained directly from the limit supermatrix. Since the limit supermatrix gave zero values for the other nine indicators, then their importance weights were obtained using Fuzzy Analytic Hierarchy Process (FAHP) method. A pairwise comparisons questionnaire was then designed and the thirteen managers were consulted to establish the importance weights of KPIs of sustainable manufacturing evaluation. The pairwise comparisons were determined between factors, and indicators within each factor using Saaty’s scale of 1 to 9. The pairwise comparisons are determined to indicate how much more one factor or indicator is important than other factors or indicators.
Table 6. Unweighted supermatrix
Indicators 1 2 3 4 5 6 7 8 9 10 11 12 13
1. Inventory cost 2. Labor cost 3. Material cost 4. Product delivery 5. Raw material substitution 6. Air emission
7. Energy consumption 8. Fuel consumption 9. Material consumption 10. Accident rate 11. Labor relationship 12. Occup. health & safety 13. Training and education
0.000
delivery 12.Occupational health & safety 10. Accident rate
6. Air
emission relationship 11.Labor
5. Raw material
substitution consumption 7.Energy & education 13.Training
9.Material consumption
6. Air emission 7. Energy consumption 8. Fuel consumption 9. Material consumption 10. Accident rate 11. Labor relationship 12. Occup. health & safety 13. Training and education
0.000
Table 8. Limited supermatrix
Indicators 1 2 3 4 5 6 7 8 9 10 11 12 13
1. Inventory cost 2. Labor cost 3. Material cost 4. Product delivery 5. Raw material substitution 6. Air emission
7. Energy consumption 8. Fuel consumption 9. Material consumption 10. Accident rate 11. Labor relationship 12. Occup. health & safety 13. Training and education
0.000
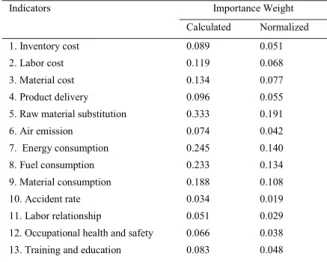
Table 9 shows a summary of the importance weights for the KPIs of sustainable manufacturing evaluation in the cement industry. The importance weights were then normalized to yield a sum of up to one. The table shows which indicator is regarded as being more important relative to other indicators. The results indicate that the most important indicator for sustainable manufacturing performance evaluation is raw material substitution with an importance weight of 0.191 which included in economic factor of KPIs. It followed by energy consumption (0.140), fuel consumption (0.134), and material consumption (0.108). These three are indicators in enviromental factor of KPIs. Based on the results, it can be concluded that those four indicators are regarded as the key indicators for evaluating sustainable manufacturing in cement industry. The least important indicator is labor relationship with an importance weight of 0.029.
Table 9. Importance weights of KPIs.
Indicators Importance Weight
Calculated Normalized
1. Inventory cost 2. Labor cost 3. Material cost 4. Product delivery 5. Raw material substitution 6. Air emission
7. Energy consumption 8. Fuel consumption 9. Material consumption 10. Accident rate 11. Labor relationship
12. Occupational health and safety 13. Training and education
4. Case study results
A case study was then conducted to a cement manufacturing company in Padang, Indonesia. The managers scored all the KPIs to evaluate their three plants using 1 to 10 rating scale. Plant-1 begins its operation in 1983 and has a total production capacity of 1,320,000 tons/year. Plant-2 operates in 1987 with a total production capacity of 1,620,000 tons/year. While Plant-3 begins its production in 1998 and has a total production capacity of 2,300,000 tons/year. The scores were calculated as the product sum of scores and importance weights over all KPIs. The overall score of the three plants compared is presented in Fig. 2. It can be seen that plant-3 has attained the highest performance with overall score of 8.083. It followed by plant-2 (7.495) and lastly, plant-1 (7.249) which has the lowest overall score. It is suggested from the results that sustainable manufacturing performance of plant-3 should improve in order to improve the overall company’s performance.
Fig. 2
5. Conclusions
This paper has proposed a fuzzy multi criteria approach for sustainable manufacturing evaluation in cement industry developed using interpretive structural model (ISM) and fuzzy analytic network process (FANP) method. The network relationship model is constructed using ISM method. Importance weights of the KPIs were assigned by pairwise comparisons and calculated using FANP method. Integration of ISM and FANP method will give a better understanding of the interrelationships amongst the KPIs and help to solve a complex evaluation problem, so that it can enhance the quality of decision making. A case study has also presented. The model enables and assists companies to know and understand their existing performance level on their strengths and weaknesses. It provides informative suggestions and directions for companies to take appropriate actions in improving their sustainable manufacturing performance. The model aids companies in achieving the higher performance and so as to compete in a much more sustainable manner. Future work will develop a sustainable manufacturing evaluation tool for the cement industry.
Acknowledgements
The authors would like to thanks to Andalas University, Padang, Indonesia for the research funding and Directorate General of Higher Education, Indonesia.
References
[1] Uwasu M, Hara K, Yabar H. World cement production and environmental implications. Environmental Development 2014;10:36-47.
[2] Uson AA, Lopez-Sabiron AM, Ferreira G, Sastresa EL. Uses of alternative fuels and raw materials in the cement industry as sustainable waste management options. Renewable and Sustainable Energy Reviews 2013; 23:242–60.
[3] Ali MB, Saidur R, Hossain MS. A review on emission analysis in cement industries. Renewable and Sustainable Energy Reviews 2011;15:2252-61. [4] Pardo N, Moya JA, Mercier A. Prospective on the energy efficiency and
CO2 emissions in the EU cement industry. Energy 2011; 36:3244–54. [5] US Department of Commerce. Sustainable manufacturing initiative.
Proceedings of the 2nd Annual Sustainable Manufacturing Summit 2009. [6] Seliger G, Kim H-J, Kernbaum S, Zettl M. Approaches to sustainable
manufacturing. International Journal of Sustainable Manufacturing 2008; 1(1/2): 58-77.
[7] Jayal AD, Badurdeen F, Dillon Jr. OW, Jawahir IS. Sustainable manufacturing: modeling and optimization challenges at the product, process and system levels. CIRP Journal of Manufacturing Science and Technology 2010;2(3):144–152.
[8] Jovane F, Yoshikawa H, Alting L, Boer CR, Westkamper E, Williams D, Tseng M, Seliger G, Paci AM. The incoming global technological and industrial revolution towards competitive sustainable manufacturing. CIRP Annals - Manufacturing Technology 2008;57(2):641–659. [9] Bakshi BR., Fiksel J. The quest for sustainability: challenges for process
systems engineering. AIChE Journal 2003;49(6):1350-1358.
[10] Gasparatos A, El-Haram M, Horner M. A critical review of reductionist approaches for assessing the progress towards sustainability. Environmental Impact Assessment Review 2008;28:286–311. [11] Agarwal A, Shankar R, Tiwari MK. Modeling agility of supply chain.
Industrial Marketing Management 2007;36(4):443-457.
[12] Kannan G, Pokharel S, Kumar PS. A hybrid approach using ISM and fuzzy TOPSIS for the selection of reverse logistics provider. Resources, Conservation and Recycling 2009;54:28-36.
[13] Chen SP, Wu WY. A systematic procedure to evaluate an automobile manufacturer-distributor partnership. European Journal of Operational Research 2010;205:687-698.
[14] Saaty TL. The analytic hierarchy and analytic network measurement processes: application to decisions under risk. European Journal of Pure and Applied Mathematics 2008;1(1):122-196.
[15] Jharkharia S, Shankar R. Selection of logistics service provider: An analytic network process (ANP) approach. Omega: The International Journal of Management Science 2007;35:274-289.
[16]Buyukozkan G, Cifci G. A novel fuzzy multi-criteria decision framework for sustainable supplier with incomplete information. Computers in Industry 2011;62:164-174.
[17] Dweiri FT, Kablan MM. Using fuzzy decision making for the evaluation of project management internal efficiency. Decision Support Systems 2006;42(2):712-726.
[18] Kahraman C, Ruan D, Dogan I. Fuzzy group decision making for facility location selection. Information Sciences 2003;157:135-153.
[19] Amrina E, Vilsi AL. Key performance indicators for sustainable manufacturing evaluation in cement industry. Procedia CIRP 2015;26C:19-23.
[20] Amrina E, Vilsi AL. Interpretive structural model of key performance indicators for sustainable manufacturing evaluation in cement industry. Proceedings of the IEEE International Conference on Industrial Engineering and Engineering Management 2014: 1111-1115.
,
,
,
, , , , , , , ,