Jurnal Kesehatan Masyarakat
http://journal.unnes.ac.id/nju/index.php/kemas
THE DETERMINANTS OF INFANT MORTALITY IN NEONATAL PERIOD
Indah Purnama Sari, Yustini Ardillah, Try Any Widyastuti
Public Health Faculty, Sriwijaya University
Article Info
Article History: Submited January 2016 Accepted June 2016 Published July 2016
Keywords:
Mortality; Neonatal; Ris
DOI
http://dx.doi.org/10.15294/ kemas.v12i1.4882
Abstract
Neonatal mortality is mortality happening to newborn baby who are alive dur-ing the birth but died ater irst month of life (28 days ater bedur-ing delivered). his study used data from 2013 reports. he aim of this study was to identify determinants of neonatal mortality risk. Case control design was used. Popula-tion of cases were newborn baabybies who dying within 28 days ater the birth, while the population of controls were newborn baby who do not die within 28 days, selected from the same population of cases. Cases and controls proportion were 1:3 with 39 babies served as cases and 117 babies as controls. Cases were identiied form he Health Oice and PHC reports, meanwhile controls were selected from neighbor of cases. Univariate, bivariate and multivariate analysis were conducted in this study. he results shows that newborn weight (p=0,03), immediately breastfeeding (p=0,00) and postnatal care (p=0,00) are the risk fac-tors for neonatal mortality.
neonatal mortality rate (NMR) (19 per 1,000 live births) (IDHS 2007 and IDHS 2012) (BPS, BKKBN, Kementrian Kesehatan, 2013).
he attention for several eforts to reduce neonatal mortality rate (NMR) (0-28 days) is important because neonatal mortality contributes to 56% of the total baby mortality. he major cause of death problems in infants and toddlers are in the neonatal period (newborn infants aged 0-28 days). Complications become the main cause of death such as asphyxia, low birth weight and infection (Kemenkes RI, 2013). In addition to the causes of death that have been mentioned, there are several other factors that can cause neonatal mortality such as factors of fetus/infant, maternal/ mothers, health care, and socio-demography of mother. Mosley and Chen (2003) formulate the proximate determinants or intermediate variables that directly afect the risk of illness (morbidity) and death (mortality) of children. Proximate determinants are grouped into ive Introduction
he infant mortality rate is one indicator which determines the health status of children. Neonatal period is a crucial period in the growth and development of babies. More than four million babies die in neonatal period (the irst four weeks of birth) from 130 million babies born every year (Titaley, 2008). Neonatal deaths occur in countries around the world. Indonesia (35.3%) is ranked second from the bottom, slightly above the Philippines (34.2%) in the neonatal mortality rate during 1990 to 2010 (Rajaratnam, 2010). he infant mortality rate (IMR) in Indonesia has yet to reach the targeted results based on Millennium Development Goal’s (MDG), goal 4 which is to reduce infant mortality (IMR) by two-thirds between 1990 and 2015, 23 per 1,000 live births. Based on the results of Indonesia Demographic and Health Survey (IDHS) in 2012, it shows that the infant mortality rate (IMR) in Indonesia is amounted to 32 per 1000 live births with no change in
Correspondece Address:
Maternal Mortality Ratio (MMR) and Infant Mortality Rate (IMR). Some provinces in Indonesia which become the focus of a decrease in Neonatal Mortality Rate (NMR) and are known as the Regional Intensive Treatment (WPI) include 12 provinces in Indonesia, one of which is South Sumatra Province. Neonatal Mortality Rate (NMR) for South Sumatra province is 20 per 1,000 live births, which is higher than the national rate (19 per 1,000 live births) (BPS, BKKBN, Kementrian Kesehatan, 2013). Based on Health Proile of Palembang in 2013, it is found that Seberang Ulu I District is the largest contributor to neonatal mortality by the number of neonatal mortality 39 infants (26.9%). herefore, the purpose of this study is to identify the determinants of the neonatal death risk in the district of Seberang Ulu I Palembang, South Sumatra Province.
Method
his research employed a descriptive and analytical approach through case control study design. he populations in this study were divided into two, namely the case and control populations. he case population was all live-born infants who died up to the age of 28 days and the control population was all live-born infants who did not die until the age of 28 days. Control population came from the same population with case population. he samples in this study were also divided into two, namely case samples and control samples based on inclusion and exclusion criteria that had been set by researchers. he inclusion criteria was the same between case and control groups, difering only in status of died or did not die until the maximum age of 28 days. he inclusion criteria included single births, the last child or irst child, and willingness of mothers to be respondents. he exclusion criteria in case group was mothers with history of severe diseases (Diabetes Melitus and heart attack), while the exclusion criteria in the control group were died before the baby was born and mothers’ houses had been visited twice but the mothers were in the place.
he independent variable included infants/baby factors (gender and birth weight), maternal factor (mother’s age at delivery, complications of pregnancy, birth categories, among others: maternal factors
(age, parity, birth spacing), contaminated environment (air, food/water, the skin/soil, insect vectors), malnutrition (calories, protein, vitamins and minerals), injuries (accidents) and health services (prevention and treatment).
Various studies have been conducted, among others is by Titaley (2008) which states that birth weight is a strong predictor of mortality risk where the infants with low birth weight (<2500 grams) have the possibility of 5.5 times higher for neonatal mortality as compared with infants with normal birth weight (2500-3500 grams) (95% CI: 3.59 to 8.57, p = 0.00). Results of research from Bashir (2013) ind that there is a relationship between the mother’s age at delivery, maternal parity, level of household welfare (social and economic), gender of the baby, type of birth, complications of pregnancy and childbirth complications. Research conducted in northern Ghana also shows that maternal age and number of children (parity) are associated with neonatal mortality (Welaga, 2013). Research by Upadhyay, et al. (2011) also shows that babies born to mothers aged <20 years old have 2 times higher risk of neonatal death as compared with infants born to mothers aged 25-29 years old (95% CI: 1.22 to 3.21 ).
Health service factors also play a role in neonatal mortality. hese factors include antenatal care (ANC), birth attendants, place of birth, type of birth, breast-feeding (IMD) and the postnatal visit. Debelew research (2014) shows that women with ≥ 4 times of ANC visit frequency have 0.35 times lower risk for neonatal mortality than women who never do ANC visit (95% CI: 0.18 to 0.68). he same study also inds that mothers who deliver the baby in health facilities have 0.43 times lower risk for neonatal mortality than women who deliver the baby at home (non-health facilities) (95% CI: 0.17 to 0.99). A research by Edmond, et al. (2006) also shows that the longer the delay in giving breastfeeding, the greater the risk of the baby in experiencing neonatal mortality (delayed breastfeeding).
complications, parity and spacing), health services factor (antenatal care, birth attendance, place of birth, type of delivery, immediately breastfeeding and postnatal visits) and socio-demographic factors (maternal education and family welfare).
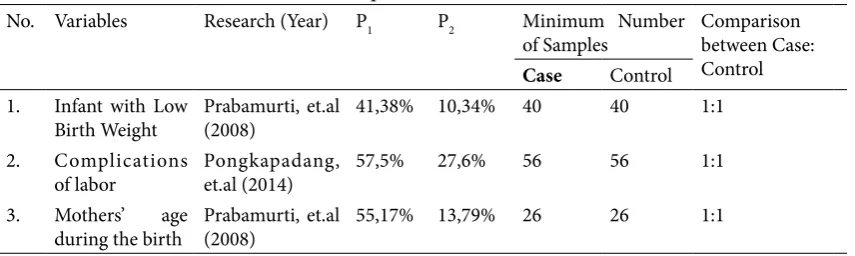
he sample size in this study was calculated using the formula of independent proportion hypothesis testing 2 groups of two sides.
he minimum sample size was calculated using some research results related to variables in this study. he results obtained are as follows:
Based on the calculation of the minimum sample size, the sizes of samples for cases and controls were calculated in the study. herefore, this study employed 56 babies as cases group and 56 babies as controls group. However, based on the Health Proile of Palembang in 2013, there were 39 infants experiencing neonatal deaths (cases) so that by using a ratio of 1: 3, the obtained 39 baby as cases and 117 infants as controls. his was done in order to meet the minimum number of samples which had been obtained from the calculation in Table 1.
Method for data collection was done by collecting primary data through interviews using a questionnaire. Cases of neonatal mortality which were reported to the Department of Health of Palembang through verbal autopsy documents (AV) were traced to the residence to do the interview. Only cases recorded in the Health Department were included in the study. Secondary data was obtained from mother and infant data cohorts (study document) and was available at Seberang Ulu I Health Center District Palembang. he data processing was done through the stages of editing (checking the completeness and correctness of the data that had been collected),
coding (a process to provide a code on the data that was to facilitate the processing of data), entry (a process by which data was transferred in a medium for data processing), tabulating (the process by which data were entered in the form of a frequency distribution table).
Data analysis was performed using the techniques of univariate, bivariate and multivariate analysis. he univariate analysis was done to explain/describe the frequency distribution of characteristics of each variable (dependent and independent) in accordance with the type of data. herefore, a clear picture of data could be obtained (simplifying the collection of data from interviews). he bivariate analysis was conducted to determine the relationship between the two variables. Bivariate test used in this study (hypothesis testing) was Chi-square test and the calculation of the value Odds Ratio (OR) with 95% Conidence Interval (95% CI) for analyzing the risk (OR) incidence of neonatal mortality. he inal analysis used was the analysis multivariate. In this stage, the analysis of the relationship among all independent and dependent variables was conducted. Multiple regression logistics test was performed to identify the relationship between all independent and dependent variables. herefore, the inal model and the dominant factors on the incidence of neonatal mortality could be obtained. Terms of independent variables that had to be expanded into a multivariable analysis were the variables with p <0.25. here were two steps involved in this multivariate analysis, namely bivariate selection and multiple logistic regression. Before entering the stage of the logistic regression analysis, the selection of independent variables was made. he goal was to eliminate any confounding variables. Table 1. he Calculation of Minimum Sample Size
No. Variables Research (Year) P1 P2 Minimum Number
of Samples
Comparison between Case: Control
Case Control
1. Infant with Low Birth Weight
Prabamurti, et.al (2008)
41,38% 10,34% 40 40 1:1
2. Complications of labor
Pongkapadang, et.al (2014)
57,5% 27,6% 56 56 1:1
3. Mothers’ age
during the birth
Prabamurti, et.al (2008)
Each independent variable was analyzed using simple logistic regression test. If the analysis produces p <0.25 then these variables could directly enter the multivariable analysis phase. For independent variables with p ≥0.25 but they are substantially important, these variables could be included in the analysis multivariate. he second step was a multivariable modeling. his multivariable modeling used multiple logistic regression. All variables with p<0.25 were included in the model and then one by one, the independent variable with p> 0.05 were excluded from the model. If the changes of OR value to independent variable was ≥10% when particular independent variable was excluded, those variables had to be included again in the logistic regression model. hese steps were carried out continuously to obtain the most parsimonious regression model.
Results and Discussion
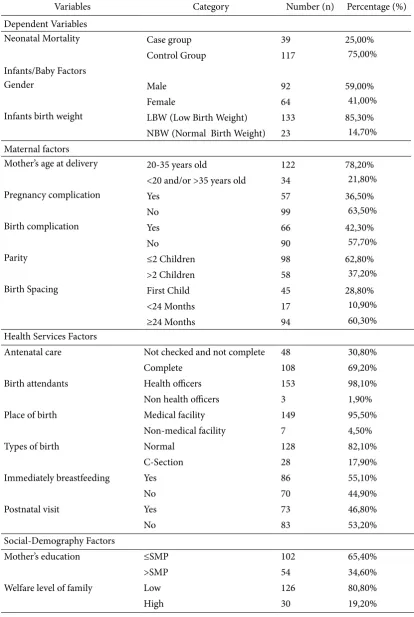
Table 2 shows the proportion of respondents characteristics from various factors which are examined. Infants with male gender have higher proportion of 2% as compared to the children with female gender. Only about less than 15.0% of infants are born with low birth weight (LBW). Mothers who are 20-35 years old during the delivery have the largest proportion (80.0%). In addition, less than 45.0% of women experience complications of pregnancy and childbirth. A total of nearly 70.0% of respondents receive complete antenatal care (once during irst trimester, once during irst trimester and twive during the third tmester). he proportion of infants who receive breast milk immediately and those who do not is almost evenly. he proportion of the respondents’ characteristics by socio-demographic factors shows that as many as 65.4% of women are educated up to junior high school (Table 2).
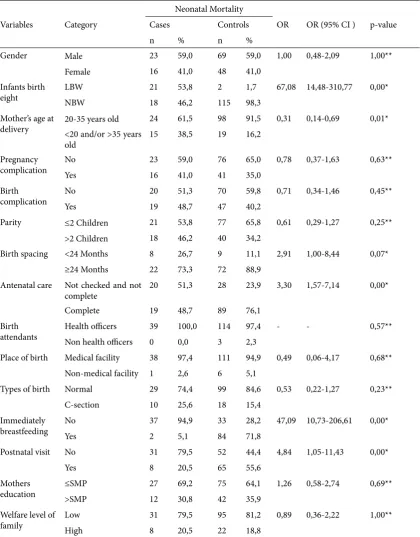
Table 3 shows results of bivariate analysis by testing the relationship between the various risk factors for neonatal mortality by using the chi-square test. here is a relationship between various risk factors and neonatal death proven by p value ≤0,05. Based on the value of p, it is known that there is a relationship between birth weight (p = 0.00), maternal age at delivery (p = 0.01), Birth spacing (p = 0.07), antenatal
care (p = 0.00), immediately breastfeeding (p = 0.00) and postnatal visit (p = 0.00) with neonatal mortality. While gender (p = 1.00), complications of pregnancy (p = 0.63), birth complications (p = 0.45), parity (p = 0.25), birth attendants (p = 0.57), place of birth (p = 0.68), types of delivery (p = 0.23), Mothers’ education (p = 0.69) and the welfare of the family (p = 1.00) are not associated with neonatal mortality.
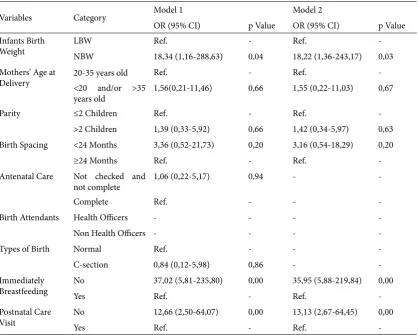
In this study, the analysis is done until stage of multivariable analysis using multiple logistic regression. he initial step in conducting multiple logistic regression is to make the bivariate selection. Bivariate selection is the stage of selecting candidates of variables which will be included in the multivariable analysis. he variables included in the multivariable analysis are variables with p <0.25 (obtained from the value of Onimbus Tests of Model Coeicients). Based on the bivariate selection results, variables that can be included in the multivariable modeling are birth weight (p = 0.00), mother age at delivery (p = 0.01), parity (p = 0.18), birth spacing (p = 0.05), antenatal care (p = 0.00), birth attendants (p = 0.19), the type of delivery (p = 0.16), breastfeeding (IMD) (p = 0.00), and postnatal visit (p = 0.00).
Ater the bivariate selection phase is done, the next step is to evaluate the results of multivariate logistic regression. he evaluation was performed based on the value of z and the value of Wald statistical test. he outcome of variables is done in several stages starting with variable that has the largest p-value or the lowest z value. he variables are kept in the model if, ater variable outcome, there is changes value OR ≥ 10% toward the other variable. he evaluation result can be seen in Table 5 (Model of parsimony End).
Table 2. Proportion of Determinant Respondents’ Characteristics with Neonatal Mortality Risk in Seberang Ulu I District Palembang 2015
Variables Category Number (n) Percentage (%)
Dependent Variables
Neonatal Mortality Case group 39 25,00%
Control Group 117 75,00%
Infants/Baby Factors
Gender Male 92 59,00%
Female 64 41,00%
Infants birth weight LBW (Low Birth Weight) 133 85,30%
NBW (Normal Birth Weight) 23 14,70%
Maternal factors
Mother’s age at delivery 20-35 years old 122 78,20%
<20 and/or >35 years old 34 21,80%
Pregnancy complication Yes 57 36,50%
No 99 63,50%
Birth complication Yes 66 42,30%
No 90 57,70%
Parity ≤2 Children 98 62,80%
>2 Children 58 37,20%
Birth Spacing First Child 45 28,80%
<24 Months 17 10,90%
≥24 Months 94 60,30%
Health Services Factors
Antenatal care Not checked and not complete 48 30,80%
Complete 108 69,20%
Birth attendants Health oicers 153 98,10%
Non health oicers 3 1,90%
Place of birth Medical facility 149 95,50%
Non-medical facility 7 4,50%
Types of birth Normal 128 82,10%
C-Section 28 17,90%
Immediately breastfeeding Yes 86 55,10%
No 70 44,90%
Postnatal visit Yes 73 46,80%
No 83 53,20%
Social-Demography Factors
Mother’s education ≤SMP 102 65,40%
>SMP 54 34,60%
Welfare level of family Low 126 80,80%
High 30 19,20%
as compared to mothers who give birth to the babies with normal birth weight (NBW) (95% CI: 1.36 to 243. 17, p = 0.03) ater being controlled by a factor of mother age, parity, birth spacing, immediately breastfeeding and postnatal visit (Table 4), the results of
this research are supported by the results of the study Sari (2014) which states that babies born with low birth weight (LBW) have a 4.1 times higher likelihood of neonatal mortality as compared with those born with normal birth weight (NBW) (95% CI: 1.8 to 9.4). In Table 3. Determinants of Neonatal Mortality Risks in Seberang Ulu I District Palembang 2015
Variables Category
Neonatal Mortality
OR OR (95% CI ) p-value Cases Controls
n % n %
Gender Male 23 59,0 69 59,0 1,00 0,48-2,09 1,00**
Female 16 41,0 48 41,0
Infants birth eight
LBW 21 53,8 2 1,7 67,08 14,48-310,77 0,00*
NBW 18 46,2 115 98,3
Mother’s age at delivery
20-35 years old 24 61,5 98 91,5 0,31 0,14-0,69 0,01*
<20 and/or >35 years old
15 38,5 19 16,2
Pregnancy complication
No 23 59,0 76 65,0 0,78 0,37-1,63 0,63**
Yes 16 41,0 41 35,0
Birth complication
No 20 51,3 70 59,8 0,71 0,34-1,46 0,45**
Yes 19 48,7 47 40,2
Parity ≤2 Children 21 53,8 77 65,8 0,61 0,29-1,27 0,25**
>2 Children 18 46,2 40 34,2
Birth spacing <24 Months 8 26,7 9 11,1 2,91 1,00-8,44 0,07*
≥24 Months 22 73,3 72 88,9
Antenatal care Not checked and not complete
20 51,3 28 23,9 3,30 1,57-7,14 0,00*
Complete 19 48,7 89 76,1
Birth attendants
Health oicers 39 100,0 114 97,4 - - 0,57**
Non health oicers 0 0,0 3 2,3
Place of birth Medical facility 38 97,4 111 94,9 0,49 0,06-4,17 0,68**
Non-medical facility 1 2,6 6 5,1
Types of birth Normal 29 74,4 99 84,6 0,53 0,22-1,27 0,23**
C-section 10 25,6 18 15,4
Immediately breastfeeding
No 37 94,9 33 28,2 47,09 10,73-206,61 0,00*
Yes 2 5,1 84 71,8
Postnatal visit No 31 79,5 52 44,4 4,84 1,05-11,43 0,00*
Yes 8 20,5 65 55,6
Mothers education
≤SMP 27 69,2 75 64,1 1,26 0,58-2,74 0,69**
>SMP 12 30,8 42 35,9
Welfare level of family
Low 31 79,5 95 81,2 0,89 0,36-2,22 1,00**
High 8 20,5 22 18,8
Source: Processed Primary Data *: Sig≤0,05
addition, several studies which have been done have proved this, among other are research conducted by Lawoyin et al (2010) in Nigeria which expresses the same inding that infants with low birth weight (<2500 grams) have the possibility 4.4 times higher in experiencing neonatal mortality as compared with normal birth weight (≥2500 grams) (95% CI: 2.4 to 8.3) and the results of research Nascimento, et al. (2012) in Brazil also shows the same results that there is a relationship between low birth weight (LBW) in neonatal mortality in which babies born weighing <2500 grams have 14.75 times higher of neonatal death as compared with those born weight ≥2500 grams (95% CI: 5.26 to 41.35, p = 0.00).
Infants’ birth weight is infants’ weight within the irst hour ater birth, whereas low birth weight babies (LBW) refers to a newborn whose weight at birth is less than 2500 grams. Low birth weight has a tendency toward an increase in the occurrence of infection and
susceptible complication. he result of research from Simbolon (2012) states that the probability of neonatal infants survival with low birth weight (94.65%) is lower than the probability of survival of neonatal infants with normal weight (98.75%). he lower the birth weight, the lower the probability of infant survival neonatal. One efort that can be done to minimize the risk of low birth weight (LBW) is through the eforts of kangaroo care method. Some of the beneits of kangaroo care method (PMK) for infants is to increase the growth and development of babies, to add the weight of babies, to help baby sleeping more soundly and longer, to stabilize the baby’s heartbeat, to have a better ability in maintaining body temperature, to better breathing (low oxygen), to make baby more stable psychologically, to make breastfeeding lasts longer and to faster the discharge from the hospital. In addition to the beneits for the baby, the beneits of kangaroo care method is also felt by mothers, among others, to have Table 4. Determinants Modeling of Neonatal Mortality Risk in Seberang Ulu I District Palembang 2015
Variables Category Model 1 Model 2
OR (95% CI) p Value OR (95% CI) p Value
Infants Birth Weight
LBW Ref. - Ref.
-NBW 18,34 (1,16-288,63) 0,04 18,22 (1,36-243,17) 0,03
Mothers’ Age at Delivery
20-35 years old Ref. - Ref.
-<20 and/or >35 years old
1,56(0,21-11,46) 0,66 1,55 (0,22-11,03) 0,67
Parity ≤2 Children Ref. - Ref.
->2 Children 1,39 (0,33-5,92) 0,66 1,42 (0,34-5,97) 0,63
Birth Spacing <24 Months 3,36 (0,52-21,73) 0,20 3,16 (0,54-18,29) 0,20
≥24 Months Ref. - Ref.
-Antenatal Care Not checked and not complete
1,06 (0,22-5,17) 0,94 -
-Complete Ref. - -
-Birth Attendants Health Oicers - - -
-Non Health Oicers - - -
-Types of Birth Normal Ref. - -
-C-section 0,84 (0,12-5,98) 0,86 -
-Immediately Breastfeeding
No 37,02 (5,81-235,80) 0,00 35,95 (5,88-219,84) 0,00
Yes Ref. - Ref.
-Postnatal Care Visit
No 12,66 (2,50-64,07) 0,00 13,13 (2,67-64,45) 0,00
Yes Ref. - Ref.
higher compassion toward baby, to reduce stress ater birth, symptoms of depression are lower, to give more conident and competent in meeting the needs of infants, to reduce bleeding, to accelerate faster delivery of the placenta and to reduce pain ater C-section delivery (Shrivastava et al, 2013).
In addition, immediately breastfeeding factor is the factor that mostly inluences neonatal mortality. Almost all (94.9%) infants who are not breastfed immediately have experienced neonatal mortality (Table 3). his proves that breastfeeding is very important to be given immediately to newborn babies so that the risk of neonatal mortality can be reduced. he results of this study also suggest that babies who are not breastfed immediately are at risk for neonatal mortality by 35.95 times higher than those who get immediately breastfeeding (95% CI: 5.88 to 219.84, p = 0.00) ater being controlled by a factor of birth weight, maternal age, parity, birth spacing and postnatal visit (Table 4). Immediately breastfeeding is one way to prevent neonatal mortality. Research by Edmond (2006) in Ghana reveals that the initiation of early breastfeeding done in the irst hour of birth can save 22% of the infants from the risk of neonatal death. If the irst breastfeeding begins on the irst day of life then just 16% of the babies could be saved from the risk of neonatal death. Early breastfeeding delays by more than one day will increase 2.4 times the risk of neonatal death as compared with infants who get early breastfeeding before 24 hours. In line with this, the research conducted by Bamji (2008), in India also shows that early initiation of breastfeeding is signiicantly associated with neonatal mortality. he research by Garcia (2011) in South India also shows a line that the breastfed infants >24 hours ater birth have a lower survival in the neonatal period than in breastfed infants within <12 hours (RR = 1.76; 95% CI: 1.01 to 3.07). In addition, these results are also consistent with the results of research by Debes (2013) which states that there is a protective relationship between early initiation of breastfeeding with neonatal mortality (within 48 hours ater birth) (RR = 0.56; 95% CI: 0.40 to 0.79). herefore, it is very important for expectant mothers to get knowledge about the beneits of breastfeeding immediately ater
birth.
Research from Raharjo (2014) states that there is a relationship between knowledge about the beneits of breastfeeding right away with the practice of giving IMD (p = 0.001) and as many as 52.5% of women have less knowledge about the IMD. his is because although the mothers have been informed about the IMD by midwives during antenatal examination, but ways of doing IMD is still rarely practiced by midwives. IMD has a very important beneit for infants and mothers. By performing IMD, the failure will be much reduced so the baby’s survival is naturally longer. he instinct and relexes of baby are very strong, so soon ater birth the baby is ready to get the main intake of nutrients from breast milk (ASI). In addition to the beneits for the baby, immediately breastfeeding is also beneicial for the mother. Anggorowati’s research results (2013) state that a history of breast-feeding efect on the incidence of breast cancer (women who do not breastfeed will have a greater risk for breast cancer). One condition that afects this is the hormonal mechanism. During breastfeeding, the mother produces the hormone prolactin that suppresses exposure to the hormone estrogen in large quantities and in the long term it can trigger breast cancer. herefore, through the process of breastfeeding, the mother will avoid the risk of breast cancer.
-5.77). herefore, the postnatal visit is one of the possible interventions in reducing neonatal mortality because the incidence of death in infants and toddlers occur in the neonatal period. Riskesdas 2007 shows that 78.5% of neonatal mortality occurs at the age of 0-6 days. Neonatal visit is one of the interventions to reduce newborn mortality through which visits can be identiied early neonatal disease or danger signs so that they can receive help immediately to prevent the disease getting worse and death.
Mother age at delivery is one of the confounding variables (confounding factors) in multivariate modeling. Most mothers (78.2%) are 20-35 years at delivery (Table 2). his shows that most mothers are in childbearing age (safe ages to give birth). hus, the results of this study show that babies born to mothers aged 20-35 years have 0.31 times lower risk for neonatal mortality than babies born to mothers aged <20 or> 35 years (95% CI: 0.14 to 0.69). he results are consistent with the results of research conducted by Machando (2005) and Kumar (2013) which conclude that the maternal age efects on neonatal mortality. In addition, the results of research conducted by Welaga (2013) concludes that the neonatal mortality occurs more frequently in women less than 20 years old as compared to mothers aged 20-35 years. It is also revealed in Mekonnen (2013) that the neonatal mortality in infants in Ethiopia is more common among 18 years old women. Women who get pregnant at a young age, in terms of the biological development of reproductive organs, are not yet fully optimized. hey have not developed psychical immaturity to deal with the moral, mental and emotional burdens. Financially, they are not yet ready to be independent and in terms of medical health, pregnant woman under the age of 20 years old will experience a variety of obstacles that will have an impact on the increased risks of pregnancy. In addition, if a pregnant woman is too old, they also have risks due to the function of the reproductive organs which have sufered a setback toward organ function abnormalities and emergence of degenerative such as hypertension, diabetes mellitus and so forth. herefore, the risk of death is increased if the mother age is 35 years old or more. he
inding is in line with research conducted by Bashir (2013) in Sudan stating that babies with mothers over 40 years old have a greater risk from having neonatal death because the woman who have reached the age of 40 years or more will generally experience fertility declines so it will afect the baby.
Another confounding variable in multivariate modeling is parity. Parity is a state of giving birth both alive and died as well as the status of the pregnancy termination (number of pregnancies that have been experienced by the mother). Based on the results of the study, 53.8% mothers with parity ≤ 2 children give birth to babies who experience neonatal mortality (Table 3). he result shows that there is no relationship between parity and neonatal mortality (p = 0.25). he results are consistent with research from Sari (2014) which states that there is no relationship between parity and neonatal mortality (p = 0.123). However, these results are not consistent with research by Welaga (2013), Machando (2005), Simbolon (2012) which state that there is a signiicant relationship between parity with the possibility of neonatal mortality. Mothers with irst pregnancy have a 1.89 times higher risk for infants in experiencing neonatal mortality as compared to mothers who are not with the irst pregnancy (OR = 1.89 (95% CI: 1.54 to 2.32) (Welaga, 2013).
Population and Family Planning (BKKBN), ideal birth spacing is 2 years or more because of short birth spacing would cause mothers not to have enough time to recover hers body ater the previous birth. his is one of the causes of weakness and maternal mortality as well as babies born. Risk reproduction process can be suppressed if the minimum distance between the births is two years. Simbolon’s research result (2012) shows that there is a relationship between birth spacing with neonatal infant survival probability (p-value <0.001). However, the result is diferent from the results of Mahmudah (2011) which states that there is no relationship between the birth spacing with perinatal mortality (p = 0.064).
he other variables contained in modeling are antenatal care, birth attendants and type of childbirth. hose variables play an important role in the survival of babies in the neonatal period. Based on the results of the study, as many as 76.1% of women who receive antenatal care in full, their babies do not experience neonatal mortality, with an average age of mothers in childbirth 27 years and 64% do not experience complications during pregnancy. his suggests that maternal antenatal care is important to be obtained during an oversight of pregnancy. Antenatal care before delivery is mainly aimed at the growth and development of the fetus in the womb. he purposes of antenatal care are to monitor mothers’ health care, to early detect the concomitant diseases and complications of pregnancy, to establish the risk of pregnancy so that mothers and babies spared from death, to set up a well-childbirth and to maintain and prepare infants and lactation. In addition, pregnant women are entitled to health care by skilled professionals during pregnancy to standard antenatal care, namely measuring body weight, measuring blood pressure, measuring height fundus, complete TT immunization, provision of iron tablets at least 90 tablets during pregnancy, tests for STIs, HIV/AIDS and malaria and colloquium (counseling) in preparation for the referral (Depkes RI, 2007). Titaley (2010) states that the antenatal care visits conducted to mother during pregnancy has positive inluence on neonatal mortality, as expressed also by Machando (2005) that neonatal mortality is
more common among women who do not receive antenatal care regularly.
he results also inds that almost all (98.1%) of mothers giving birth with the help of health workers (Table 2) with as many as 74.5% of mothers who gave birth with the help of health professionals, their babies do not experience neonatal mortality. According to the Law of the Republic of Indonesia No. 36 2014 on health oicers, health oicers are people who dedicate themselves to the health sector and have knowledge and/or skill through education in the ield of health for certain types required by the authority to make health eforts. Health oicers have an important role to improve the quality of health care up to the public so that the public is able to raise awareness, willingness and ability of healthy living that will manifest high health standard as an investment for the development of human resources socially and economically. In addition, based on research result, as many as 95.5% of women deliver at health facilities (Table 2) with 74.5% of mothers who give birth with the help of health professionals, their babies do not experience neonatal mortality. According to the Law of the Republic of Indonesia No. 36 2014 on health oicers, health-care facilities are tools or places used to organize health care eforts, both as preventive, curative and rehabilitative actions undertaken by the Government, Local Government, and / or community. his shows that awareness is emerging in pregnant women to perform safe delivery with the help of health professionals and in health care facilities.
Conclusion
Several eforts in preventing neonatal mortality are very important because neonatal mortality is the largest contribution to mortality on babies. he immediately breastfeeding is the most inluential factor in preventing neonatal mortality. herefore, it takes a cross-sectorial cooperation between the BKKBN, the Department of Health and Higher Education to promote the beneits of immediately breastfeeding to pregnant women and to improve the promotion of maternal and child health about the good and safe pregnancy.
Anggorowati, Lindra. 2013. Faktor Risiko Kanker Payudara Wanita. KEMAS, 8 (2) : 121-126. Bamji, Mahtab S., et al. 2008. Maternal Nutritional
Status & Practices & Perinatal, Neonatal Mortality in Rural Andhra Pradesh, India.
Indian J ournal of Medical Research, 127 : 44-51.
Bashir AO, et al. 2013. Neonatal Mortality in Sudan: Analysis of he Sudan Household Survey, 2010. BMC Public Health, 13 (1) : 287. Blencow, H., et al. 2011. Clean Birth and Postnatal
Care Practices to Reduce Neonatal Deaths From Sepsis and Tetanus: A Systematic Review and Delphi Estimation of Mortality Efect. BMC Public Health, 11 (Suppl 3) : S11. BPS, BKKBN, Kementerian Kesehatan. 2013.
Survei Demograi dan Kesehatan Indonesia 2012. Jakarta: BPS, BKKBN, Kementerian Kesehatan.
Debelew, G. T., Afework, M. F. & Yalew, A. W. 2014. Determinants and Causes of Neonatal Mortality in Jimma Zone, Southwest Ethiopia: A Multilevel Analysis of Prospective Follow Up Study. PLoS One, 9 (9) : e107184.
Debes, Amanda K., Anjalee Kohil, Nef Walker, Karen Edmond, & Luke C. Mullany. 2013. Time to Initiation of Breastfeeding and Neonatal Mortality and Morbidity: A Systematic Review. BMC Public Health, 13 (Suppl 3):S19.
Depkes RI. 2007. Pedoman Pelayanan Antenatal. Jakarta: Direktorat Bina Pelayanan Medik Dasar.
Edmond, K. M., et al. 2006. Delayed Breastfeeding Initiation Increases Risk of Neonatal Mortality. Pediactrics, 117 (3) : 905.
Garcia, CR et al. 2011. Breast-Feeding Initiation Time and Neonatal Mortality Risk Among Newborns in South India. Journal of Perinatology, 31: 397-403.
Kemenkes RI. 2013. Buletin Jendela Data & Informasi Kesehatan Volume 2. Jakarta: Kementerian Kesehatan RI.
Kumar, C., Singh, K. P., Rai, K. R. & Singh, L. 2013. Early Neonatal Mortality in India, 1990-2006. J Community Health, 38 : 120-130. Lawoyin T, Onadeko M, Asekun-Olarinmoye E.
2010. Neonatal Mortality and Perinatal Risk Factors in Rural Southwestern Nigeria: A Community-Based Prospective Study. West African Journal of Medicine, 29(1) : 19-23. Mahmudah et al. 2011. Faktor Ibu dan Bayi yang
Berhubungan dengan Kejadian Kematian Perinatal. KEMAS, 7 (1) : 41-50.
Machando, J. C. & Hill, K. 2005. Maternal, Neonatal and Community Factors Inluencing Neonatal Mortality in Brazil. J Biosoc Sci, 37 : 193-208.
Mekonnen, Y. et al. 2013. Neonatal Mortality in Ehiopia: Trends and Determinants. BMC Public Health, 13 : 483.
Mosley, W. H. & Chen, L. C. 2003. An Analythical Framework for he Study of Child Survival in Developing Countries.Bulletin of the world Health Organization, 81:140-145.
Nascimento RMd, et al. 2012. Determinants of Neonatal Mortality: A Case-Control Study in Fortaleza, Ceará State, Brazil. Cadernos de Saúde Pública, 28(3) : 559-572.
Raharjo, Bambang Budi. 2014. Proil Ibu dan Peran Bidan dalam Praktik Inisiasi Menyusu Dini dan ASI Eksklusif. KEMAS, 10 (1) : 53-63. Rajaratnam JK, et al. 2010. Neonatal, Postneonatal,
Childhood, and Under-5 Mortality for 187 Countries, 1970–2010: A Systematic Analysis of Progress Towards Millennium Development Goal 4. he Lancet, 375 (9730) : 1988-2008.
Sari, Indah Purnama. Berat Badan Lahir Rendah (BBLR) Terhadap Kematian Neonatal. 2014. Prosiding Pertemuan Ilmiah Nasional Kependudukan dan Pembangunan Berkelanjutan. Jakarta: IPADI & Pusat Kesehatan Reproduksi FK UGM.
Shrivastava SR, Shrivastava PS, Ramasamy J. 2013. Utility of Kangaroo Mother Care in Preterm and Low Birthweight Infants. South African Family Practice, 55(4) : 340-344.
Simbolon, Demsa. 2012. Berat Lahir dan Kelangsungan Hidup Neonatal di Indonesia.
Jurnal Kesehatan Masyarakat Nasional, 7(1) : 8-15.
Titaley CR, et al. 2010. Iron and Folic Acid Supplements and Reduced Early Neonatal Deathsin Indonesia. Bulletin of heWorld Health Organization, 88(7):500-508.
Titaley CR, et al. 2008. Determinants of Neonatal Mortality in Indonesia. BMC Public Health, 8 (1) : 232.
Upadhyay, R., et al. 2011. Determinants of Neonatal Mortality in Rural Haryana: A Retrospective Population Based Study. Indian Pediatric,
49(4) : 291-294.