:
| 624
The Factors Which Influence the Quality of Education in Undeveloped Area
(Multi-Cases Study in 10 Districts in Indonesia)
Bambang Sigit Widodo
State University of Surabaya, Surabaya, Indonesia
Corresponding e-mail: [email protected]
Abstract: This study aims to find out the factors that affect the quality of education in undeveloped areas. The variables
of this study were: 1) the quality of teachers, 2) the educational devices and infrastructures, 3) the community participation in education, 4) the educational funding, 5) the public perception of education, 6) the accessibility of education, 7) the educational service, and 8) the educational equity. The design of this study was quantitative with survey and multi-cases approach. The populations of this study were the communities in 10 undeveloped districts and its samples were 500 respondents. The data were collected by using questionnaires and analyzed by cluster analysis. The results show that the variables consisting of the public perception on education, the community participation, the educational funding, and educational service have score below average total score of public perception on educational equity, because Z score is minus (-).
Therefore, these variables are important to be concerned in improving the quality of education. While, the quality of teachers, educational devices and infrastructures, and the accessibility of education become the variables which need to be concerned because Z score is positive (+) but it is very small. The educational equity is good because Z score is positive (+) and it is more than 1 or 1.09776. The clusters of this study are Empat Lawang and South Nias districts. The second clusters show that all variables have positive Z score with almost of Z scores are more than 1. Those variables are educational perception, quality of teachers, educational devices and infrastructures, the community participation, educational funding, educational service, accessibility of education, and educational equity. The two districts under the cluster are South Kayong and Seluma.
Keywords: quality of education, cluster analysis
1 INTRODUCION
The successful development, especially human development can be judged partially by seeing how large the most fundamental problems in the society can be solved. These
fundamental problems are poverty,
unemployment, illiteracy, food security, and the rule of democracy, but the problem of the achievement of human development is partially varied among countries, in which some certain construction aspects works and some fail. Based on the experience on the human development in various countries, it is noted that there are two things to do in order to accelerate human development, such as; the equitable distribution of income and adequate allocation of public expenditure on education and health. South Korea as an example, consistently do two things but Brazil fails because of the unequal distribution of income and inadequate
allocation of public expenditure on education and health (UNDP, BPS, Bappenas, 2004). Thus it can be said that education is one of the indicators to measure the achievement of human development.
:
| 625
people who have high school education and above. Literacy Rate of 15-24 is an indicator of the achievement of the MDG's by 2015. By 2015 the entire population aged 15-24 wherever s/he is to be able to read and write. Group of school-age population is the population of productive age group, as a development resource which should have sufficient education and skills to get a proper job. If the quality of human resources is not fulfilled properly, it can make the area undeveloped.
The description of the education in undeveloped areas in Indonesia is reflected from aspect of literacy rate which is 92.91% lower than the average of national literacy rate. The Human Development Index (HDI) is under 67.2 and the duration of school (LS) is 7.92% under the average of the National duration of school. While, for the 10 undeveloped districts which become the target of the educational policy design shows that the literacy rate and The Human Development Index (HDI, as below; (1) Pidie Jaya, literacy rate is 95.48 and 72.82 for The Human Development Index (HDI), (2) South Nias, literacy rate is 85.28 and 67.72 for The Human Development Index (HDI), (3) Central Tapanuli, literacy rate is 95.82 and 71.63 for The Human Development Index (HDI) , (4) Seluma , literacy rate is 93.96 and 67.29 for The Human Development Index (HDI) , (5) Empat Lawang, literacy rate is 97.83 and 69,08 for The Human Development Index (HDI), (6) Sukabumi, literacy rate is 97.35 and 71.06 for The Human Development Index (HDI) , ( 7 ) the regency, literacy rate is 78.25 and 63.81 for The Human Development Index (HDI) , ( 8 ) East Lombok : AMH 82.89 And 63 , 93 for The Human Development Index (HDI), (9) Central Lombok : literacy rate is 72.88 and 61.66 for The Human Development Index (HDI) , and ( 10 ) District of North Kayong: literacy rate is 88.31 and 65.75 for The Human Development Index (HDI).
Actually, the latest data of Indonesia Human Development Index (HDI) rose both
index values and ranking. Indonesia's HDI rank is equal with South Africa’s, namely 121 of 187 countries, which means Indonesia Rose 3 levels of the order to 124 last years (UNDP, 2013). Based on the “Human Development Report 2013' in 2012, HDI is 0,629. The index rose three points and put Indonesia in 121 ranking of 124 in 2011 with 0,624 indexes. The index puts Indonesia in the medium human development category, the same as South Africa. Between 1980 and 2012, Indonesia's HDI value increases from 0.422 to 0,629, meaning that getting an increase of 49% or an average increase of 1.3% per year. The expectation of school duration increases 4.6 years from 8.3 in 1980 to 12.9 years in 2012. This means that school-age children in Indonesia fulfill the program of 12.9 years of education or reaches the higher education level. This figure is far above the average value of learning
expectations for Medium Human
Development index, namely 11.4 years.
However, the average of Indonesia’s HDI is
still below the average of countries in East Asia and Pacific region, which consists of 15 countries, namely 0.683 and it is still 0.694 below the world's average HDI. The average school duration in Indonesia is 5.8 years, lower than the regional average of 7.2 years.
The increase of Indonesia’s HDI certainly is caused by the achievement of the national commitment to health care and better education, the innovative poverty alleviation programs and strategic engagement is equal with the world economy. Especially for education in undeveloped areas has a good effort and also conducted by the Ministry of Rural Development through the independent and intelligent Village program (DCM) with the programs that include: alleviating the alliterate, distributing the access of basic education, distributing teachers and education personnel, equalizing primary education and revitalizing the early childhood education and Community Library.
:
| 626
HDI. If you look at the data from the Ministry of Rural Development, there are 183 districts classified as undeveloped areas in Indonesia, as following: the human development index is 72.2 for 32 districts, 133 districts with the human development index between 60.68 and 72.2, and 18 districts is less than 60.68. Based on latest
data from the UNDP 2013 about Indonesia’s
HDI, it is 62.4, which can be concluded that the undeveloped areas in Indonesia are still in the quadrant of HDI between 60.68 and 72.2. The synergistic effort is need to improve HDI for undeveloped areas and one of the indicators to improve the quality of education through indentifying the factors that influence the quality of education in undeveloped areas. (multi-cases study in 10 undeveloped districts in Indonesia).
2 RESEARCH METHOD
The objects of this research are: (1) Pidie Jaya, (2) South Nias, (3) Central Tapanuli, (4) Seluma, (5) Empat Lawang, (6) District Sukabumi, (7)Bondowoso , (8) East Lombok, (9) Central Lombok, and (10) east Kayong. The approach of research is survey which conducted to explore the primary data relating to public perception on education service and needs. The data were collected by using questionnaires to 500 respondents. Whereas, the secondary data were collected by using the study of the documentation relating to the strategic plan of education, educational profile, evaluation or annual report and other documents which are relevant to the needs of these activities. In addition, these activities are also conducted by Focus Group Discussion (FGD) in every department of education in 10 undeveloped districts. FGD is conducted inviting some the stakeholder of education, such as: department of education, teachers, principals, board of education, professional organizations (Indonesia republic teacher union), school inspectors, and legislator from education field.
Data were analyzed by using a
quantitative approach with Cluster Analysis.
:
| 627
each district to the center of the group is minimum, Therefore, districts in the districts have a common characteristic of public perceptions on the quality of education The
following table analyzes the results of the formation of clusters based on similarity or community preferences in each district.
Table 1
The grouping of the Districts with Characteristics and Similarities
City
3 Clusters 4 Clusters
Cluster
The Average
Distance Cluster
The Average Distance
Empat lawing North Kayong
1 2
0.448980084 0.353159558
1 2
0.448980084 0.353159558
Central Lombok East Lombok
3 3
2.269162467 1.538610113
3 3
0.610883848 0.610883848
Sukabumi Pidie Jaya
3 3
1.037758554
1.673192327 4
4 2 1 4 4
1.067930866 1.079668664
Seluma South Nias
2
1 0.353159558
0.448980084 1.079141093 1.632885053
0.353159558 0.448980084 0.988033927 1.019790204 Central Tapanuli
North Kayong
3 3
Source: primary data, 2013 (processed by SPSS)
a. If Made 3 Clusters
Cluster 1 : Empat Lawang and Nias Selatan Cluster 2 : North Kayong and Seluma
Cluster 3 : Central Lombok, East Lombok, Sukabumi, Pidie Jaya, Central Tapanuli, and North Kayong.
Table 2
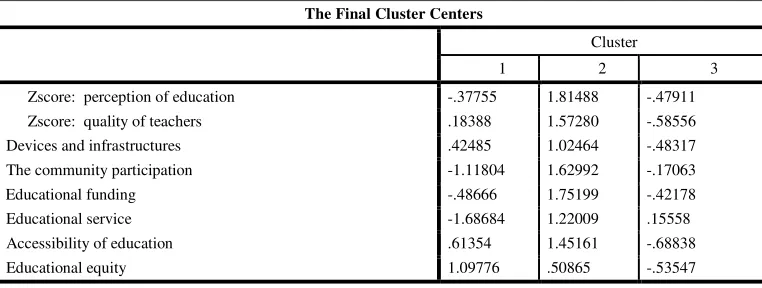
The Final Cluster Centers
The Final Cluster Centers
Cluster
1 2 3
Zscore: perception of education -.37755 1.81488 -.47911 Zscore: quality of teachers .18388 1.57280 -.58556 Devices and infrastructures .42485 1.02464 -.48317 The community participation -1.11804 1.62992 -.17063
Educational funding -.48666 1.75199 -.42178
Educational service -1.68684 1.22009 .15558
Accessibility of education .61354 1.45161 -.68838
Educational equity 1.09776 .50865 -.53547
The score (-) for every variable means that the variable is under the average total public perception on the quality of education, while
:
| 628
1) Cluster 1The variables of Perception Education, Community Participation, Educational funding and Educational Services have score below the average total public perception on the quality of education, because Z scores (-). Therefore, these variables must be considered as focused variables for the improvement of the quality of education. Community participation is an important part in the development of quality education (Epstein, 2001)
While variables of Teacher Quality, devices and infrastructures, and Accessibility of Education are variables which needs to be considered, although Z score (+) but it is very small. Education Equity variable is a variable that is good enough by the community because Z scores (+) and more than 1, that is
1.09776. Districts in cluster 1 are Empat Lawang and south Nias. Issues related to the quality of the teacher is always the center of attention in developing countries (Marylin, 2005).
2) Cluster 2
In the second cluster, all of the variables have Z score (+), in which the score is more than 1. The variables are perceptions of Education, Teacher Quality, devices and infrastructures, Public Participation, Educational funding and Educational Services, Accessibility of Education and Equity of Education. This means that these variables are good enough to support the
Quality of Education by the community. This cluster is the best cluster compared to others because all variables have Z scores (+). Districts in cluster 2 are North Kayong and Seluma. Educational facilities and infrastructure have an important role in improving the quality of education and student achievement (Cynthia, 2003
3) Cluster 3
The cluster 3, most of variables have Z score (-). The variables are the perception of Education, Teacher Quality, device and Infrastructure, Public Participation, Educational funding, Accessibility of Education and Equity of Education. This means that the variables according to the community are still less and must be considered as focused variables for the improvement of the quality of education in all districts in cluster 3.
While the Education Services variable has Z scores (+), means that it is sufficient to support the quality of education according to the community, although the Z score is still less than 1, that is 15558. There are six districts included in cluster 3, namely Central Lombok, East Lombok, Sukabumi, Pidie Jaya, Central Tapanuli, and north Kayong.
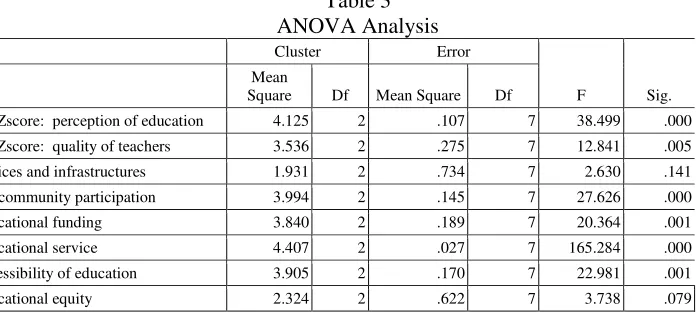
Generally, according to the public perception on the variables of education quality, it can be seen in the ANOVA table. Variables with a high and Significant F score is very small compared to 0.05, a significant variable in forming clusters districts.
Table 3 ANOVA Analysis
Cluster Error
F Sig. Mean
Square Df Mean Square Df
Zscore: perception of education 4.125 2 .107 7 38.499 .000 Zscore: quality of teachers 3.536 2 .275 7 12.841 .005 evices and infrastructures 1.931 2 .734 7 2.630 .141 he community participation 3.994 2 .145 7 27.626 .000
ducational funding 3.840 2 .189 7 20.364 .001
ducational service 4.407 2 .027 7 165.284 .000
ccessibility of education 3.905 2 .170 7 22.981 .001
:
| 629
The F tests should be used only for descriptive purposes because the clusters have been chosen to maximize the differences among cases in different clusters. The observed significance levels are not corrected for this and thus cannot be interpreted as tests of the hypothesis that the cluster means are equal. The significant variables that form these clusters are Educational Services, Perception Education,
Community Participation, Accessibility of Education, educational funding and quality of teachers. Public perception toward the importance of education to be one of the factors that influence on improving the quality of education in the region. Positive public perception of education will affect their level of participation in education
(Omer, 2011)
b. If made 4 clusters
Cluster 1: Lawang empat and south Nias Cluster 2: North Kayong and Seluma Cluster 3: Central Lombok, East Lombok
Cluster 4: Sukabumi, Pidie Jaya, Central Tapaluni, and north Kayong.
Table 4 Final Cluster Centers
However, results of Z score of cluster 3 and 4 are almost similar, for instance; cluster 3 has Z scores (+) but it very small. Therefore, the analysis should be conducted by using 3 clusters because they have almost similar score. Basically improving the quality of education requires a lot of things to do. Factors that affect the quality of education in undeveloped areas should get serious attention from the government. Furthermore, the government must have intervened sufficiently strong so that the lagging regions will catch up and in the foreseeable future
there is no area that is still lagging behind in education.
Quality of education is becoming a hot issue in the education community and in the wider society. The concept of quality education was given by different authorities. It also presents the roles of teachers in improving quality of education. The perception and commitment of teachers to the issues of quality of education was increasing the commitment of teachers is an important first step in the process of school reform. The current shift in emphasis from access to quality and the introduction of several
Final Cluster Centers
Cluster
1 2 3 4
Zscore: perception of education -.37755 1.81488 -.11470 -.66132 Zscore: quality of teachers .18388 1.57280 .20345 -.98007
evices and infrastructures .42485 1.02464 -1.19958 -.12496
he community participation -1.11804 1.62992 .36370 -.43779
ducational funding -.48666 1.75199 .14600 -.70566
ducational service -1.68684 1.22009 .08734 .18970
ccessibility of education .61354 1.45161 -.28779 -.88868
-1.11501
:
| 630
reforms in the education system should also take into consideration the perception and commitment of teachers towards improving quality of education so that cumulative effort of stakeholders will gear towards common
goals i.e, improving quality (Omer, 2011). Government policy in improving the quality of education is one of which can be done by raising education funding (Kenneth, 1999.
4 CONCLUSION
From the results, it can be concluded that the variables must be repaired of each districts
based on similarities and characteristics. See the following table.
Tabel 5
Preference of Variables in Each Cluster
No Cluster Lawang dan north Nias
perception of education, the
perception of Education,
Teacher Quality, device and
Infrastructure, Public
Participation, Educational
funding, Accessibility of
Education and Equity of because coincidentally the four districts area are the expanded district of n. Then cluster 3 can be called "non-expanded district" although there is one district of Pidie Jaya, result of expansion, but the others are the old district which tend to have similar characteristics as the undeveloped district. in general, educational variables that must be considered as the priority to improve are: public perception on Education, Quality and human Resources of Educator, device and Infrastructures of Education, community Participation, Educational funding, accessibility of Education and Equity of Education.
5 REFERENCES
American Educational Research Education. 2005. Studying Teacher Education. New Jersey: Lawrence Erlbaum Associates Publisher, Inc.
Brian, S Everitt. 2011. Cluster Analysis, 5th Edition.
New York: John Wiley and Sons, Incorporated.
Cynthia, Irvine., Helen, Armstrong. 2003. Security Education and Critical Infrastructures. New York: Springer Science and Business Media, LLC.
Epstein, Joyce L. 2001. School, Family, and Community Partnerships: Preparing Educators and Improving Schools.
Washington, DC.; Office of Educational
Research and Improvement (ED),
Washington, DC.
Kenneth, K. Wong. 1999. Funding Public Schools: Politics and Policies. Kansas: University Press of Kansas.
Leonard, Kaufman., Peter J. Rousseeuw. 2009. Finding Group in Data: An Introduction to Cluster Analysis. San Fransisco: John Wiley and Sons, Incorporated.