SPATIO-TEMPORAL SIMULATION AND ANALYSIS OF REGIONAL ECOLOGICAL
SECURITY BASED ON LSTM
Chen Gong1,2,*, Li Qi1,2,* , Liang Heming1, Hamed Karimian1, Mo Yuqin1,2
1 Smart City Research Center of Peking University,Beijing 100871, China-(gong.chen,liqi)@pku.edu.cn 2 Beijing Advanced Innovation Center for Future Internet Technology, Beijing University of Technology
KEY WORDS: Deep learning, Machine learning, LSTM, Ecological deficit, Spatio-temporal simulation
ABSTRACT:
Region is a complicated system, where human, nature and society interact and influence. Quantitative modeling and simulation of ecology in the region are the key to realize the strategy of regional sustainable development. Traditional machine learning methods have made some achievements in the modeling of regional ecosystems, but it is difficult to determine the learning characteristics and to realize spatio-temporal simulation. Deep learning does not need prior identification of training characteristics, have excellent feature learning ability, can improve the accuracy of model prediction, so the use of deep learning model has a significant advantage. Therefore, we use net primary productivity (NPP), atmospheric optical depth (AOD), moderate-resolution imaging spectrometer (MODIS), Normalized Difference Vegetation Index (NDVI), landcover and population data, and use LSTM to do spatio-temporal simulation. We conduct spatial analysis and driving force analysis. The conclusions are as follows: the ecological deficit of northwestern Henan and urban communities such as Zhengzhou is higher. The reason of former lies in the weak land productivity of the Loess Plateau, the irrational crop cultivation mode. The latter lies in the high consumption of resources in the large urban agglomeration; The positive trend of Henan ecological development from 2013 is mainly due to the effective environmental protection policy in the 12th five-year plan; The main driver of the sustained ecological deficit growth of Henan in 2004-2013 is high-speed urbanization, increasing population and goods consumption. This article provides relevant basic scientific support and reference for the regional ecological scientific management and construction.
1. INTRODUCTION
Since the industrial revolution, resources, environment and economic development have conflicted, there is excessive consumption of natural resources, environmental pollution, climate change, ecological deterioration and other issues, sustainable development has become the 21st century’s development theme of our world( Brundtland, 1987a; Peng S Z., 2014a; Xi J P., 2015; Zhang Z Q., 1999a) To measure whether the region is sustainable, there is a need for quantitative comparison of the state of development in the region( Castaneda B E., 1999a; Hard P B., 1997). The research of quantitative methods of sustainable development has started globally, such as "sustainable economic welfare indicators", "real development indicators", "China's sustainable development index system" (Xu Z M., 2001; Xu Z M., 2000a; Castaneda B E., 1999a; Lu X Z., 1999; Zhang Z W., 2000a) and so on. The representative model is the ecological footprint model (Ayres R U., 2000a.), which provides a scientific basis for assessing regional sustainable development.
Machine learning can automatically exploit the patterns and patterns hidden in the data (Sun Z Y., 2016). Traditional machine learning method has made some achievements in the modeling of regional ecosystems( Yang J., 2009; Wu M., 2001a; Sun H R., 2009a; Jin X., 2014a; Stoica C., 2016a; Li H., 2006): In 2014, Jinxin use General Regression Neural Network (GRNN) model to compute Ecological Footprint(EF), which was proved to have higher prediction accuracy than Back Propagation Neural Network (BPNN), and EF of the basin was calculated by using the EF influencing factors( Jin X., 2014a). Storia et al. used the machine learning method to evaluate the ecological status of the Danube Delta in 2016 and carried out a real-time simulation of water quality (Stoica C., 2016a). But the traditional machine
* Corresponding author
learning needs to extract training characteristics, which is influenced by the knowledge level of the researcher. The learning characteristics need a1 lot of time to adjust; it is difficult to realize the temporal and spatial simulation; the model which represents complicated problem is limited in the case of finite samples and computing units, generalization capacity is subject to certain constraints (Li K J., 2016a).
Deep learning has a hierarchical structure similar to that of neural networks. It consists of input layer, hidden layer and output layer. There is no connection between the same layer nodes, and each layer can be regarded as a logical regression model (Sun Z J., 2012a.). Different from traditional machine learning, deep learning does not need to determine the training characteristics in advance, reducing the artificial design features caused by the incompleteness. Deep learning also has excellent characteristics of learning ability, learning more basic characteristics of the data, the difficulty of training can be overcome by "through the layer initialization". In addition, deep learning can improve the accuracy of model prediction and is more suitable for modeling complex systems (Le Cun Y., 1998; Mo D., 2012).
At present, the existing application of regional ecological management based on ecological footprint mostly rests on the calculation of provincial units (Zhu X L., 2015a; Guo R Z., 2015a; Chen C Z. 2006a; Yang J. 2009a; Wu M., 2013a; Sun H R. 2009a; Jin X. 2013a; Liu Y C. 2015a), which can not meet the needs of regional ecological management and the research unit need to be refined. This paper breaks down the limitation of administrative unit, realizes the spatial grid prediction of regional ecological security, and for the first time deep learning is used to make the spatial and temporal prediction of regional EF. Different from the previous ecological deficit(ED) calculation method based on regional statistical data (Zhu X L., 2015a; Guo R Z., 2015a; Chen
C Z. 2006a; Yang J. 2009a; Wu M., 2013a; Sun H R. 2009a; Jin X. 2013a; Liu Y C. 2015a), in this paper, the remote sensing data is of easy access, low cost and high precision are added to the calculation. Not only from the space, but also from the time, the ecological security of Henan Province is simulated and predicted. It provides relevant basic scientific support and reference for the regional ecological scientific management and construction.
2. RESEARCH DATA AND METHODS
2.1 Research area and data
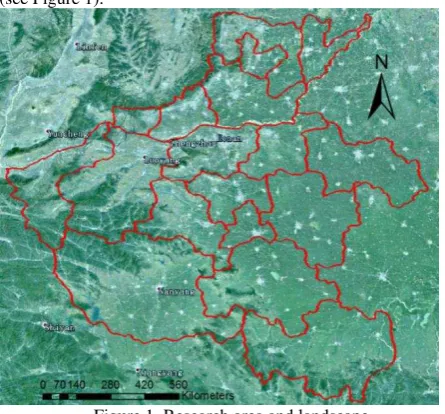
This paper chooses Henan province as the research area. Henan is located in the central and eastern part of China, a typical plain area, located in the middle and lower reaches of the Yellow River, between 110 °21 'to 116 ° 39' E, latitude 31 ° 23 'to 36 ° 22' N (see Figure 1).
Figure 1. Research area and landscape
Statistical data comes form 2007-2014 Henan Province Statistical Yearbook data, spatial data has population and four remote sensing data: (1) 5km population grid data (http://www.chinageoss.org); (2) 200 m grid of vegetation Net Primary Productivity (NPP) data (http://dsac.cn); (3) Atmospheric optical Depth (AOD) of 3 km grid (https://lpdaac. usgs.gov) (4) Normalized Difference Vegetation Index (NDVI) (https://lpdaac.usgs. gov.). NPP is called net primary productivity, NDVI is vegetation coverage, both reflects the degree of carbon sequestration in the region, which reflects the ecological capacity (EC) of the area (X H S. 2007a). AOD and carbon emissions have a strong correlation (Alfö Ldy. 2007a), therefore, AOD to a certain extent reflect the ecological capacity of carbon emissions, that is, carbon source. In the ecological footprint model, the regional total EF needs to be averaged by person (Li H., 2006). Therefore, NPP, NDVI, AOD and population grid data are used to obtain the spatial distribution of regional ecological deficit / surplus per capita. Considering the scale and calculation of the study, the resolution of the three data is unified with the AOD, and the population and NPP and NDVI are re-interpolated with IDW (reverse distance weight) to obtain the unified 3km grid data.
2.2 Research methods
(1) Improved ecological footprint calculation model
EF model analysis method is proposed by Willian Rees and Wachernagel to quantify the quantitative indicators of ecological sustainable development. However, there are many drawbacks of the global equilibrium factors in the equilibrium factors of EF calculation (Li H., 2006). We use local equilibrium factor which reflect the EF and EC of different provinces and cities better. The EC is defined as how much area of the productive land and waters can be provided to humans in that place, used to characterize the EC of the area. In the calculation of EC, due to the inconsistency of resource status in different regions, the production factor is used to adjust the different types of areas, that is, the ratio of the regional production and the world average yield represented by the regional bio-productive area (Li H., 2006). The yield factors used in this paper are: 1.91 for construction land, 0.85 for water, 1.91 for cultivated land, 2.54 for orchard, and 1.24 for vegetable planting. Ecological deficit (ED) is equal to EC minus EF.
(2) Deep learning calculation
Recurrent Neural Network (RNN) is a kind of node-oriented artificial neural network, which can use its internal memory to deal with any temporal-sequence of input (Li H. 2006; Jordan M I. 1997a). Long Short-Term Memory (LSTM) is an improvement to the traditional RNN model. When the traditional RNN model expands too many layers, it will lead to the disappearance of the gradient, and the effective historical information is affected by the new input data and can not be saved for a long time. LSTM redesigned the RNN memory module, which has a unique design structure, and LSTM is suitable for handling and predicting the time series interval and delaying very important events (Elman J L. 1990a; Hochreiter S. 1997a). During the period of training, the training set,validation set and test set is set to 5: 1: 1, the test set is independent of the validation set and the training set. The LSTM model calculates the error in the training set and the verification set respectively using the training error T_LOSS (training loss) and the cross validation error VAL_LOSS (validation loss), T_LOSS and VAL_LOSS are calculated by MSE. The MSE formula is as follows (Tian Y. 2012a):
��� =
�∑
��=�
��− �
� 1Yt is model prediction value and an n-dimensional vector, Y is the observation vector or actual vector corresponding to Yt. MSE is the mean square error between the true and predicted values. We use Acc (as in equation 2) to calculate the model test accuracy in the test set: represents the accuracy of the model in the test set.
In the case of spatial prediction, the data used are the data mean of each county and the ED of each county. The input data of the model is NPP, NDVI, AOD and population, and the time if from the year 2007 to 2014, 8 years of data. 4 kinds of input data as the dependent variable, ED as an independent variable. The from 2016 to 2020. Use the first 4 years of data as input and the
fifth year of data as output in the training process, when sufficient training and verification accuracy are achieved ,we forecast the 2016-2020 data.
(3) Driving force analysis
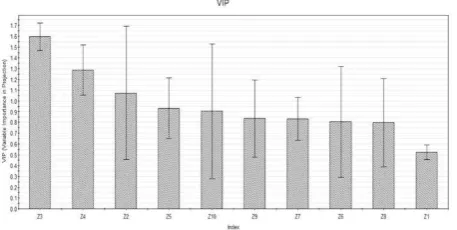
The importance degree of the driving factor is judged by the variable importance in projection (VIP). When VIP value is greater than 1, it indicates the driving factor is important; When VIP value is below 0.8, it indicates that the driving factor is not important; When VIP value is between 0.8-1, it indicates that the importance of the driving factor is uncertain (Li Y L. 2010).
3. RESULTS AND ANALYSIS
3.1 EF calculation
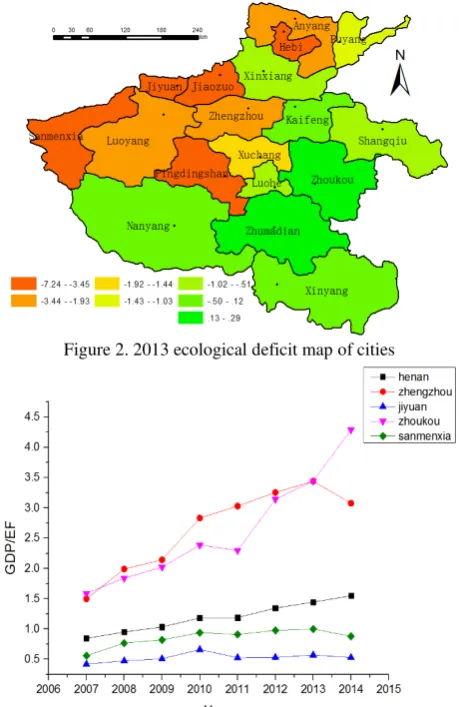
The ecological footprints of Henan cities were calculated by using the improved ecological footprint method. The ED results are shown in Figure 2.(The ecological footprint, ecological deficit ,GDP, refers to ecological footprint per capita ,ecological deficit per capita, GDP per capita respectively in this article )
Figure 2. 2013 ecological deficit map of cities
Figure 3. 2007-2013 GDP/EF of Henan and some cities
The annual GDP/EF of Henan Zhengzhou, Jiyuan, Zhoukou, Sanmenxia are calculated and shown in Figure 3. GDP / EF value of Henan Province gradually increased, indicating that the economic development of Henan is becoming more and more efficient, which proved the effectiveness of industrial upgrading in Henan (Zhengzhou, 2004). GDP / EF of Zhengzhou decline in 2014 years, its EF in 2013-2014 increased, due to large-scale infrastructure construction in Zhengzhou, such as Zhengzhou Airport District (Zhengzhou, 2004). Jiyuan and Sanmenxia are industrial cities (Henan. 2012), GDP / EF has a downward trend.
Table 1. Economic Index for Henan Province in 2013
GDP/c( GDP per capita) of Zhengzhou, Jiyuan, Sanmenxia, etc. leads in Henan in Table 1, in Figure 2 EF/c(ecological deficit per capita )is higher; GDP/c of Zhoukou, Shangqiu, Zhumadian falls behind, EF/c of them is low. That indicates that GDP/c and EF/c have a strong positive correlation. Jiyuan, Sanmenxia are industrial city and have high GDP/c while EF/c is high. Although Zhengzhou has the highest GDP/c in, the EF/c relatively lower than other high GDP/c cities. Zhengzhou is the provincial capital, it removed high-polluting industries and imported less polluting high-tech industries through a certain policy (Zhengzhou, 2004), thus confirmed the impact of government policies on regional ED.
3.2 Spatio-temporal prediction based on deep learning method
Neuron number 1 3 10 30 50 100
T_Loss 0.1325 0.1239 0.0097 0.0298 0.0268 0.0268
VAL_LOSS 0.1861 0.1821 0.1821 0.0327 0.0265 0.0027 Table 2. Relationship between LSTM neurons and training errors
(a)Relationship between train loss and epoch
(b)Relationship between validation loss and epoch Figure 4. Relationship between LSTM training error and training epcoh
(1)Application of LSTM model for spatial prediction.
Firstly LSTM is used to test. The relationship between training accuracy and the number of neurons is shown in Table 2; the relationship between training loss (training and validation loss) and the number of training is shown in Figure 4. LSTM training accuracy and the relationship between the number of neurons has an optimal value, training accuracy no longer significantly improves after training 100 times, so we choose LSTM( 15 neurons, 50 epcohes, 5 layers, considering the balance of computation source and efficiency) to perform prediction.
The LSTM spatial prediction model and the LSTM temporal prediction model are used to test the spatial and temporal data respectively. The Acc(accuracy) is 98.53% and 97.01% respectively by the formula (2), which proves that the model can achieve high accuracy. So we conduct spatial prediction and temporal prediction of ED in Henan Province.
(1)Application of LSTM model for spatial prediction.
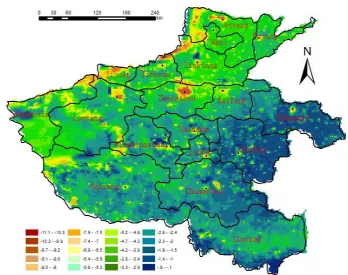
As the ED changes in 2007-2014 is very small, only the spatial prediction in the first year 2007 and the most serious year 2013 are shown in Figure 5 and Figure 6 respectively. In order to express the relation between ED and the administrative center or the boundary more clearly, the two are superimposed in Figure 5.
Figure 5. 2007 Henan Province, the city's ED map (point on behalf of the city center or city government location)
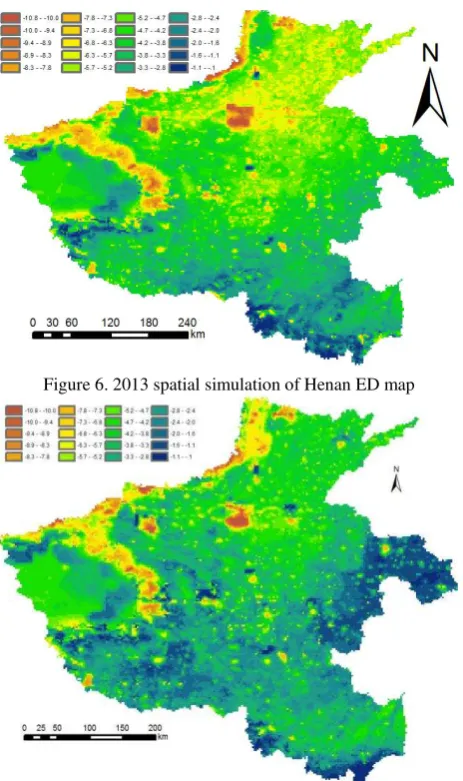
Figure 6. 2013 spatial simulation of Henan ED map
Figure 7. 2018 temporal prediction of Henan ED map
In Figure 5, the spatially continuously distribution of the EF in Henan Province can be clearly observed. Compared with the EF model calculated by the EF model of the administrative city (Figure 2), it can provide more detailed spatial information of the regional ecological distribution, and more close to the real ecological state distribution. It can be seen that the EF in the central and northern parts of Henan Province is more serious (as shown in Figure 2 and 5). In contrast, the ecological surplus of the south-western mountainous areas is better. The EF are more serious in Zhengzhou and Luoyang (Figure 5). The urban area has high EF (Figure 5). Compared with Figure 1 and Figure 5, the EF on the edge of the mountainous area in the northwest of Henan Province is higher, and from google earth we find that area are mostly exposed to the land. Most of the land in that area is cultivated as bare land and the green vegetation is sparse. The northern part of Henan Province is at the southern end of the Loess Plateau, and the land productivity is weak (Pei X F.1991a), which shows a higher ED in Figure 5 and Figure 2. These also prove that the prediction results are in good agreement with the urban central area and the landscape of Henan Province.
(2) Application of deep learning to temporal prediction. We predict EF in Henan Province from 2015 to 2020 by LSTM Model. The relatively high EF year is 2018, is displayed in Figure 7. The temporal prediction of EF of Henan Province is averaged over grid basis every year. The results are shown in Figure 8
Figure 8. Forecast of Ecological Deficit in Henan Province from 2007 to 2020
Figure 9. 2007 total ecological deficit of Henan
Figure 10. 2007-2020 GDP/EF value and prediction of Henan Province
The EF of Henan has been decreasing year by year from 2007 to 2013 (Figure 8), because the consumption of natural resources (the increase of EF) has increased due to the rising standard of living( Li Y L. 2010). The gradual increase in 2013 is due to the fact that Henan Province has implemented a proactive environmental policy during the 12th Five-Year Plan period, investing heavily in protecting the environment( Henan. 2012) and increasing its ecological capacity in 2014( Pei X F.1991a). From forecast results of 2015 - 2020, Henan Province, the ecological condition is in the wave to a good development trend after 2013, which verifies the effectiveness of Henan environmental policy.
The total ecological deficit (TEF) is multiplied by ecological deficit and population in a single grid, as shown in Figure 9. Compared with google earth we found that TEF is high in Luoyang, Zhengzhou, these two large urban communities, indicating that the human activities are one of the main reasons of high ecological deficit. So the general public should save energy consumption, improve the awareness to protect the environment. Government should continue to optimize the industrial structure, to encourage the development of industry which has low consumption of energy and high output, such as
the tertiary industry, support scientific research, improve production efficiency and reduce the negative impact on the environment. Compared with the EF/c, TEF is less affected by the geographical environment (from Figure 9 and Figure 5).
The temporal and spatial prediction of ecological footprint and GDP was carried out using the same temporal prediction method. The GDP / EF results are shown in Figure 10. Henan GDP / EF will continue to improve during 2007-2020, indicating that the efficiency of economic growth continues to increase.
Tag Z1 Z2 Z3 Z4 Z5
Meaning GDP GDP Grow Percent Population Urbanization
rate
Total retail sales
Tag Z6 Z7 Z8 Z9 Z10
Meaning Proportion of the tertiary
industry
Table 3. Relative factors of ED and their tag
3.3 Driving force analysis
We use STIRPAT and VIP to extract the key factors of ED(Figure 11): Z3, Z4, Z2, Z5 have the greatest impact on the ecological deficit, and the cumulative effect rate is 98% and Z3 Z4 total contribution rate is 90%. Z4, Z2 to a certain extent reflect the economic development state, but the growth of GDP should not be the cost of ecology; Z5 reflects the resources consumption of the population, the population of the ecological deficit, to reduce the ecological deficit, first to implement the appropriate population policy; Consumption state.
Therefore, through the effective control of urbanization rate, regulation of economic development from extensive to refined changes, and regulation of goods consumption from a certain degree, we can use these key factors to adjust regional ED from the essence.
Figure 11. Contribution of different factors
4. CONCLUSION AND PROSPECTS
This paper proposes a method to simulate the ecological ED of the region by LSTM. For the first time, deep learning is applied to the calculation of ED, and LSTM is selected to simulate the spatial ED. Deep learning does not need feature extraction, data is directly put into deep learning model, that avoid human interference, and has a more essential characterization, it improves accuracy.
In the past, the calculation of ED can only be based on the city and county level, and requires a lot of economic, environmental and other aspects of statistical data, which is of long cycle, high cost and difficult to refine (He Y F., 2015), This study uses grid data (including remote sensing data which is easy to obtain, of
low cost, have high accuracy), changing the data source of ED calculation. Not only from the space, but also from the time, ecological security of Henan Province has been simulated and predicted, that can be used for more sophisticated ecological data calculation and policy simulation( Cheng G J., 2011a), more sophisticated EF driving force analysis( Yue D P., 2010a). For the regional ecological scientific management and construction for the relevant basic scientific support and reference.
VIP can be used to analyze the key factors affecting the ecological deficit in Henan, and provide reference for policy formulation. Through the effective control of urbanization rate, control the economy from extensive to fine, efficient development mode change, adjust the consumption of consumer goods, to a certain extent it will reduce the ecological deficit. GDP / EF of Henan is increasing, indicating that the province's economic efficiency continues to improve, and industrial upgrading policy achieves certain results.
The data used in this method are limited, and some data such as CO2 can better reflect the regional ecological and economic conditions (Zheng L C., 2017). Adding this data to the calculation can improve the rationality and reliability of the calculation. The population etc. used in this study is grid data, are calculated by IDW. This method often have stripes, which is not consistent with the actual situation (He Y F., 2015). If the land cover data is used to calculate, it will be more efficient and reasonable to compute the grid population data. Above are the direction of the next research.
ACKNOWLEDGMENTS
This work was supported by the National Key Technology R&D Program of the Ministry of Science and Technology of China (Grant No. 2012BAC20B06).
REFERENCES
Alfö Ldy. 2007a, Aerosol optical depth, aerosol composition and air pollution during summer and winter conditions in Budapest. Science of the Total Environment. 383(1), pp. 141-163.
Ayres R U., 2000a. Commentary on the utility of the ecological footprint concept. Ecological Economics, 32(3): 347-349. Brundtland, G H., 1987a. Report of the World Commission on Environment and Development. Environmental Policy & Law, 14(1), pp. 26-30.
Castaneda B E., 1999a. An index of sustainable economic welfare (ISEW) for Chile. ECOLOGICAL ECONOMICS, 28(2), pp. 231-244.
Castaneda B E., 1999a. An index of sustainable economic welfare (ISEW) for Chile. Ecological Econonics. 28(2), pp. 231-244.
Chen C Z. 2006a, Nonlinear Dynamics Analysis of Ecological Footprint and Ecological Carrying Capacity .Journal of Ecology. 26(11):3812-3816.
Cheng G J., 2011a, Modeling and Simulation of Ecological Complex Adaptive System Based on Multi-Agent. Journal of Xi'an Shiyou University (Natural Science Edition): 2011, 2 (02): 134-148.
Elman J L. 1990a, Finding structure in time. Cognitive science, 14(2), pp. 179-211.
Guo R Z., 2015a. Prediction Analysis of Ecological Footprint and Ecological Carrying Capacity of Changsha City Based on Gray Model.Research on the study. 22(04): 195-200.
Hard P B., 1997. Measuring sustainable development: review of current practices, pp. 13(6):591-595.
He Y F., 2015, Grid-based evaluation of land ecological carrying capacity in Nanchang; Jiangxi Agricultural University 2015;
Henan Government, 2016, "Twelve Five" period Henan population development report. Henan: Henan Bureau of Statistics, 2016
Jin L Y., 2016, Study on regional ecological modeling and spatio-temporal prediction based on CyberGIS_R. Beijing: Peking University, 2016.
Jin X. 2013a, Study on influencing factors of ecological footprint based on GRNN neural network. 5(13), pp. 112-131
Jin X., 2014a. Study on influencing factors of ecological footprint based on GRNN neural network. (05). pp. 137-139.
Jordan M I. 1997a, Serial order: a parallel distributed processing approach. Advances in Psychology, 121: 471-495.
Le Cun Y., 1998. Gradient-based learning applied to document recognition. Proc. IEEE, 1998. USA: IEEE, 1998: 2278-2324.
Li H. 2006, The Study of Ecological Footprint Theroy and Application. Lanzhou Unviersisty.
Li H., 2006. The study of ecological footprint theory and application. Lanzhou University. 2006
Li K J., 2016a. Talk about deep learning. Software. 37(5): 81-83
Li Y L. 2010, Henan Province ecological footprint changes and its influencing factors. Nanjing: Nanjing Agricultural University, 2010
Liu Y C. 2015a, Ecological Footprint Forecasting Model Optimization - Taking Wuhan City as an Example. Journal of Peking University (Natural Science Version. 51(05), pp. 897-904.
Lu X Z., 1999. Comment on "1999 China's Sustainable Development Strategy Report". Publishing and Research, (10): 11
Mo D., 2012. A survey on deep learning: one small step toward AI. 2012.
Pei X F.1991a, On the Range of the Loess Plateau. China Journal of Soil and Water Conservation. (12): 37-42
Peng S Z., 2014a . Global Sustainability Report: Background, Progress and Related Proposals. China Population. Resources and Environment. 24(12): 1-5
Stoica C., 2016a. Water quality of Danube Delta systems: ecological status and prediction using machine-learning algorithms. Water Sci Technol. 73(10):2413-2421
Sun H R. 2009a, Based on GIS-BP neural network of ecological geological environment sensitivity evaluation - to Qianshan scenic area and the surrounding as an example. Groundwater. 31(06), pp. 126-128.
Sun H R., 2009a. Assessment of the sensitivity of eco-geological environment based on GIS-BP neural network - Taking Qianshan scenic area and surrounding area as an example. Journal of Groundwater. 31(06), pp. 126-128.
Sun Z J., 2012a. Review of Deep Study .Application Research of Computers, 29 (8): 2806-2810
Sun Z Y., 2016. Study and Progress of Deep Learning. Computer Science, 43 (2): 31-38.
Tian Y. 2012a, Speaker Recognition System Based on Depth Neural Network and Bottleneck Feature. Journal of Tsinghua University (Science and Technology) 49 (7), pp. 2036-2043
Wu M. , 2013a. State prediction of urban ecological pressure based on radial basis function neural network. Natural Resources,: 328-335.
Wu M., 2001a. State prediction of urban ecological pressure based on radial basis function neural network. Journal of Natural Resources. 2013 28(02): 328-335.
X H S. 2007a, Study on net primary productivity model of vegetation. Subtropical Soil and Water Conservation. 19 (4), pp . 24-28.
Xi J P., 2015: ecological civilization construction is the key direction of the thirteen five planning. 2015.
Xu Z M., 2000a. Evaluation of Several New Methods for Quantitative Research on Sustainable Development. Chinese Journal of Resources and Environment, 10(02), pp. 61-65.
Xu Z M., 2001. Ecological Tracing Method: A New Method for Quantitative Research on Sustainability - Taking the Ecological
Footprint of Zhangye Prefecture in 1995 as an Example. Acta Ecologica Sinica, 21(9), pp. 1484-1493.
Yang J. 2009a,. Prediction of per capita ecological footprint in Chengdu based on genetic neural network. Journal of Ecology,3(01): 359-367.
Yang J., 2009. Prediction of per capita ecological footprint of Chengdu based on genetic neural network. Journal of Ecology. 29(01), pp. 359-367.
Yue D P., 2010a, Dynamic change of per capita ecological footprint and its driving force analysis in Henan Province from 2000 to 2007. Resource Development and Market. 13 (07): 211-216.
Zhang Z Q., 1999a. Research on Sustainable Development: Progress and Trend. Advances in Earth Science. 28(2), pp: 231-244.
Zhang Z W., 2000a. Study on regional sustainable development and man-land system coordination. Journal of Xiangfan University, (05): 85-88.
Zheng L C.,2017. Study on Implied Carbon Dioxide Emissions and Its Influencing Factors in Hebei Province .Progress in Climate Change Research, 12 (12) 201-205.
Zhengzhou, 2004. Zhengzhou City Master Plan Manual (2005-2020). Zhengzhou: Zhengzhou Municipal Government, 2004
Zhu X L.,2015a. Study on Ecological Footprint Fitting and Prediction of Hubei Province Based on BP Neural Network. Journal of Wuhan University of Science and Technology (Social Science Edition). 17(01): 77-80.